Quantcast
Channel: Market Calls
Viewing all 2070 articles
Browse latest View live

How to Handle Nifty Breakout Trades?

$
0
0

Breakouts

One of the toughest part in trading is you see a trend breakout and not try to trade against it. However most of traders love to short a strong trend for smaller gains and the short sellers keep on piling up every up every upmove. When you are seeing a breakout on your charts one of the questions you have to ask yourself is “is this breakout really strong on weak breakout” and that understanding make you to ride the trend. Else we will be the weaker prey and ends providing liquidity to the strong players!

Currently Nifty September Futures on the 4 hourly charts are in a breakout and momentum traders are driving this market post the long consolidation.

Questions to ask yourself to get better resolution about the market

So is this breakout strong?
Who is driving this rally?
Are these players who are driving this market strong?
How long they remain strong? Who is shorting this market at every rally?
And why people do so?
Where is the herd mentality?
What is my trading objective with the given situtation?
Am I patient enough to handle this trade?
When i have to prepare to exit if something goes wrong against my opinion?

Possibly asking these questions to yourself will nurture you to become a better trader or even a better speculator.

The post How to Handle Nifty Breakout Trades? appeared first on Marketcalls.


Understanding Market Participants and their Behavior

$
0
0

Understanding who is dominating the market on a given day gives fair advantage and plays a crucial role in deciding trading strategy and executing the strategy at the better price. When the market participants behavior changes one can continually readjust his strategy and change his/her tactics depending upon who is in control.

Market Participants

Variety of traders enter and trade the markets in anticipation of profits. They are motivated to take a trade by variety of reasons, emotions. The way each of the these participants combines and employs information is different. Participants rely on fundamental analysis, technical analysis, New based information, Global Events, Political events, Earnings results, orderflow, trading models/algorithms to take their trading decisions.

We can classify these market participants into 5 segments

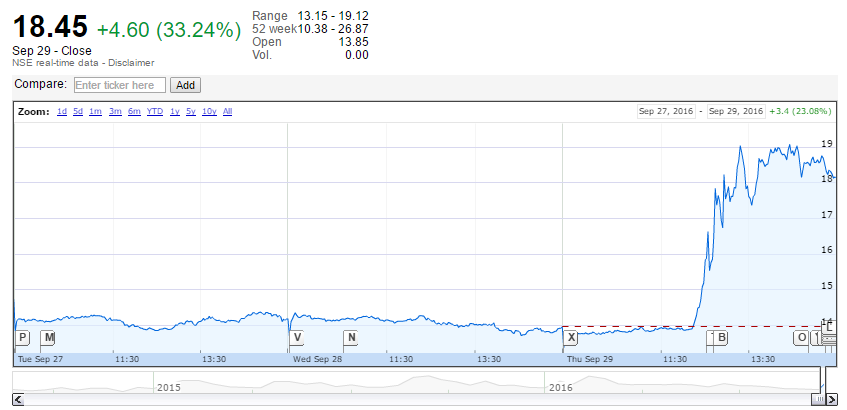
Scalpers : Most of the scalpers holding positions are measured in seconds to a maximum of few minutes. They rely on Tick data/ lower timeframe charts 1min-5min charts. Few scalpers use orderflow/volume analysis as a part of their trading decisions. They enter and exit the market damm quickly. And most of the scalping is done in the exchanges by the high frequency traders who use speed and computer algorithms as a advantage to enter and exit their trading positions faster. Market Data is critical element for them and they mostly rely on their intuition.

Day Timeframe traders

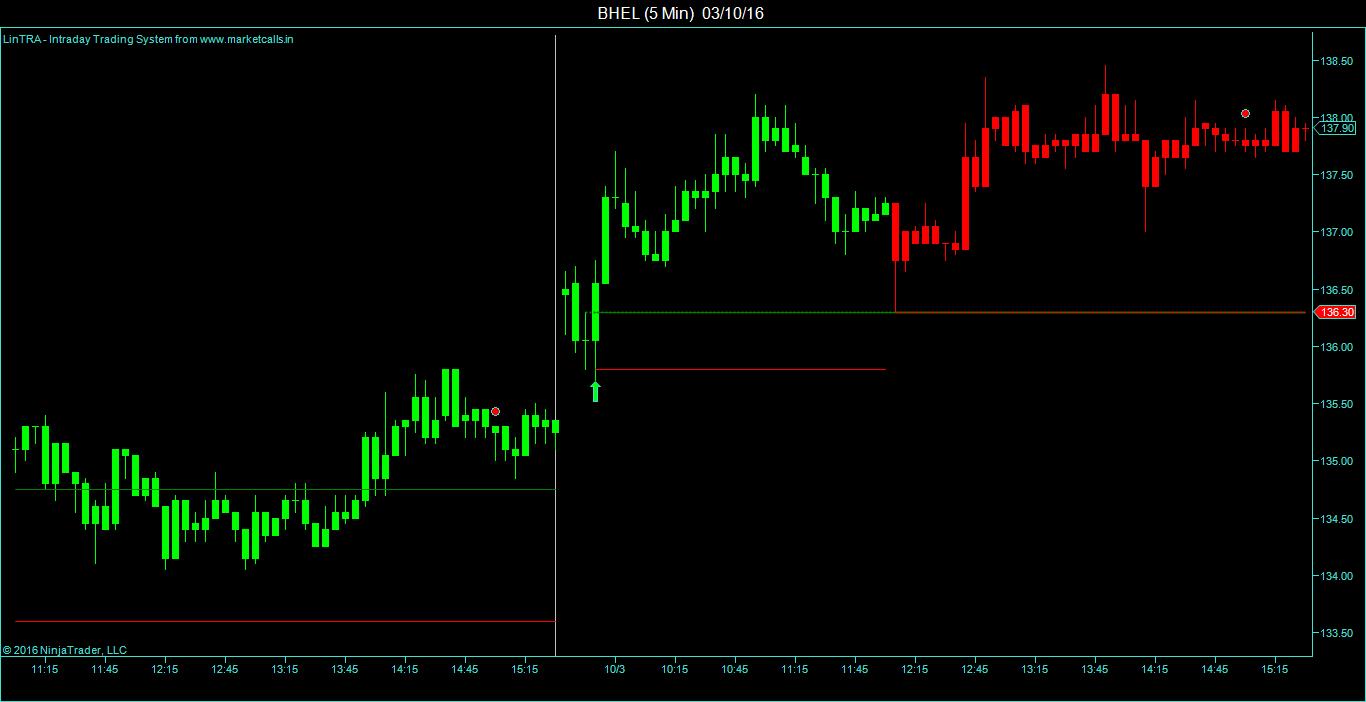
Day timeframe traders are the one who comes into the market with no position and goes out without any position. i.e if they are buying on the same day they have to sell on the same day..viceversa. Most of the Day timeframe traders shows emotional behavior. They rely on news based information, rumors, reacts to gap situations, global events, global sentiments & Earnings result.

Most of them uses charting indicators,Chart Patterns, buy or sell signals, pivot points, advisories, tv analysts,social media to double confirm their trading decisions. Some people are highly obsessed with ichimoku cloud, Elliot Wave, GANN Analysis and few even trade against the TV Analyst opinions and social media opinions thinking that their opinions are often dumb. Few set of day timeframe traders even employ low frequency trading algorithms to avoid emotions. Their stoploss are generally tight due to highly leveraged positions.

Shorter Timeframe Traders

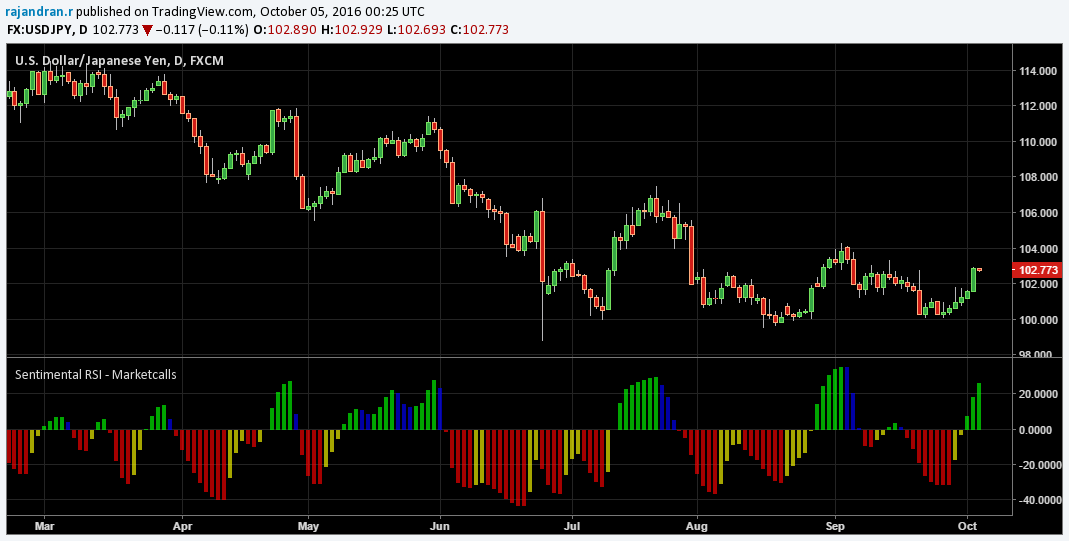
Their holding period is typically ranging from few days to 1-2 weeks. Their trading decisions are motivated by economics events, speculate on global events, brokerage opinions, research reports, advisories, and market rumors. Often they relies on classical technical indicators, market guru’s, Watching Dow Jones , SGX Nifty, Crude Oil, Local Currency movements and other market movements to double confirm to ensure that their trading decisions are right.

They are typically swing traders or breakout traders and very well aware about the recent economic/political conditions and have good knowledge on fundamental information and the effects its impact on market movements. Most of the time shorter timeframe traders or day timeframe players will be dominating the market.

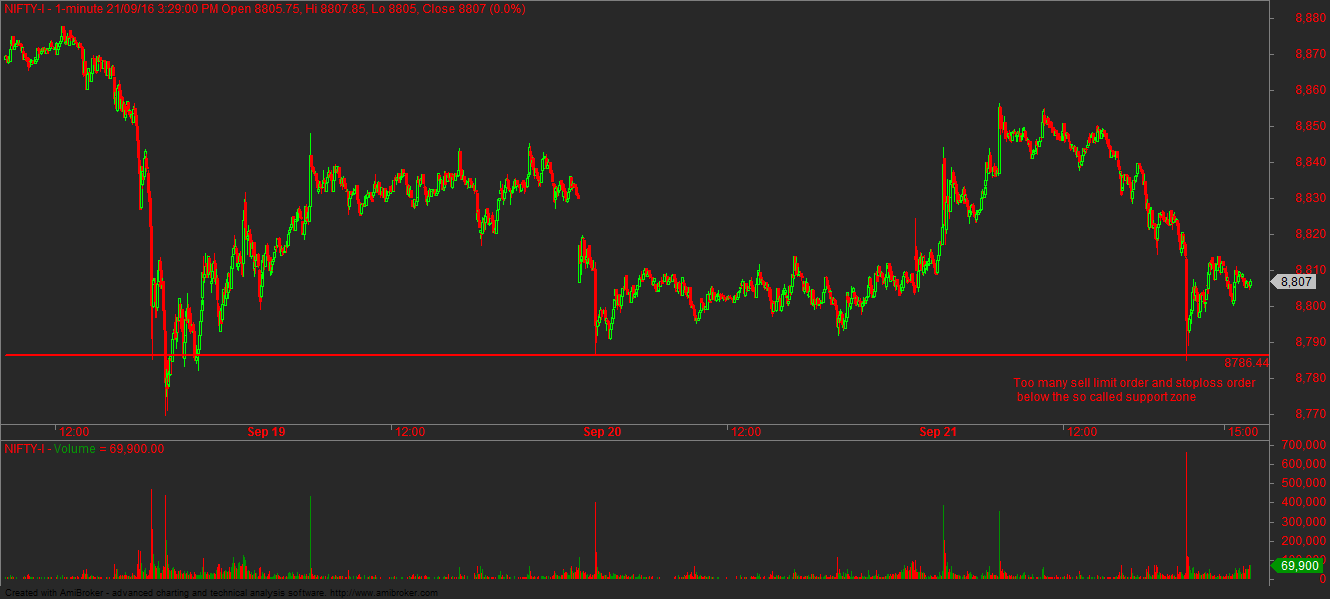
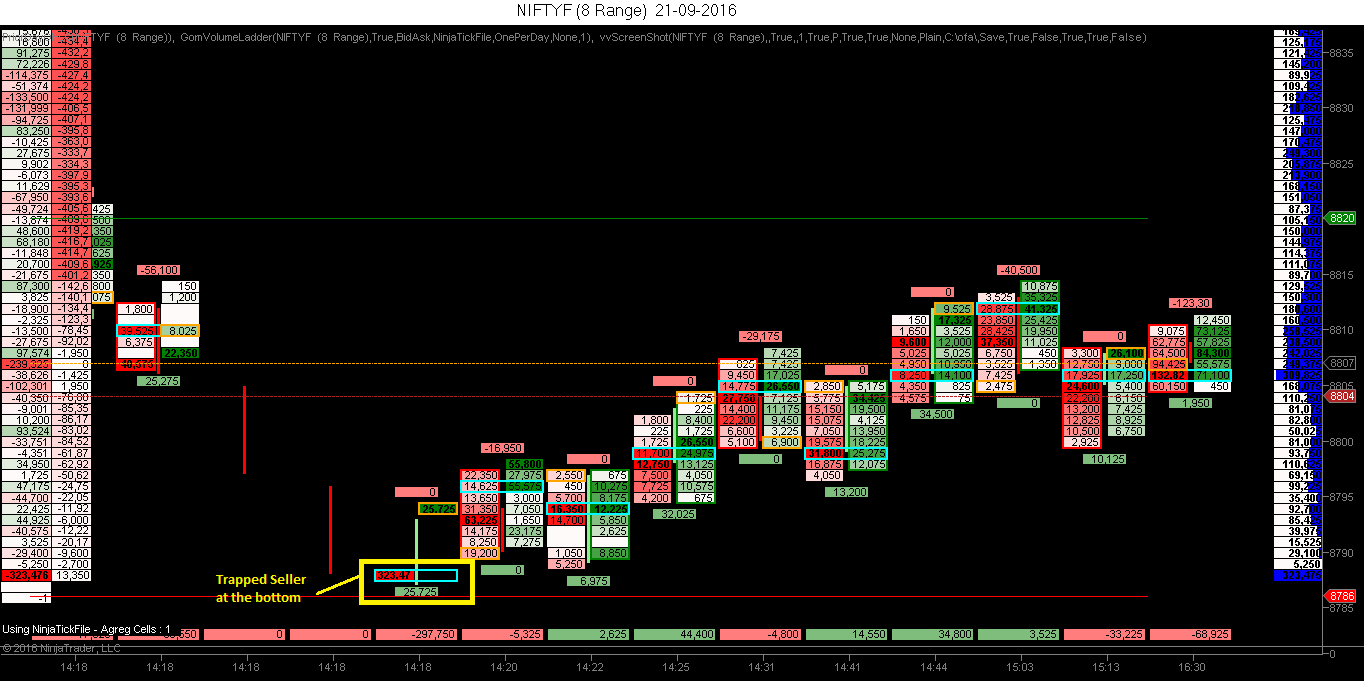
When the market opens typically a day traders/shorter timeframe traders pile on faster. Scalpers/Day timeframe traders/Shorter timeframe traders are often subjected to stop hunting

Intermediate Timeframe Traders

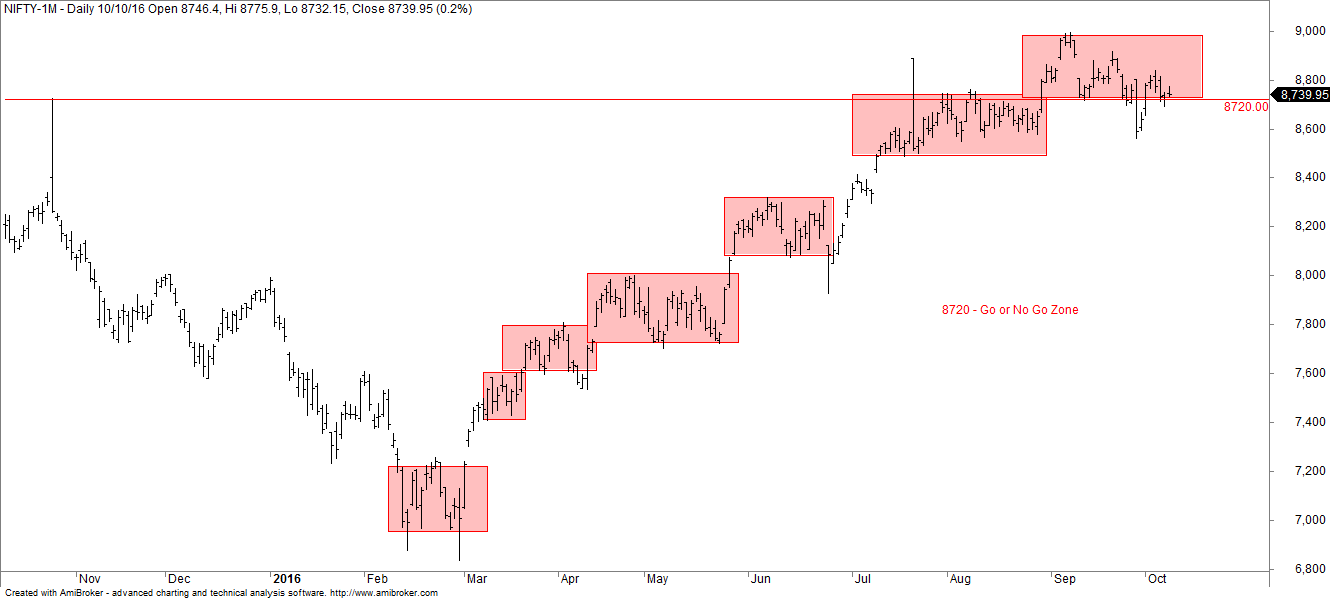
Thier holding period is typically ranging from few weeks to couple of months. They are strongly motivated by fundamental data or technical analysis and some even do techno-fundamental analysis. Their trading behavior is aggressive when they start dominating the market. However they are very less dominant compared to the shorter timeframe traders. When they are dominating the market they are very aggressive in moving the price to the extreme. During this phase the shorter timeframe traders who are trading against these intermediate traders will incur significant damage to their portfolio. They have the potential to breakout of the daily consolidation trading ranges.

Longer Timeframe Investors/Traders

Their holding period is typically ranging from more than 6 months to even couple of years. They are strongly motivated by fundamental data and market valuations. Their focus is on finding an outstanding company at a sensible price. When they started dominating the market every other timeframe joins along with them. They have the potential to breakout of the weekly or monthly trading ranges.

The post Understanding Market Participants and their Behavior appeared first on Marketcalls.

Momentum Slowdown in Nifty Futures

$
0
0

Momentun Decline

In the last week we had seen aggressive short covering from shorter timeframe sellers followed by lack of momentum post the breakout of 8800 zone. In the last three days again we started making fresh three day consolidation in the range 8800-8860 zone indicating that trend is getting tired and whomever trading this zone is most likely dominated by shorter timeframe buyers and this behavior also resembles that upside is very limited and one should prepared to trade with reversal mindset. Momentum Indicator is marginally up but subdued. This is the phase where the crowd cheers for every small up trends.

Daily Sentiment
Daily Sentiment

Daily Sentiment indicator is holding positive. However Weekly sentimental indicator is negative for the last three weeks. This indicates that price reversal below 8800 or the price consolidating below 8860 could drag the price even lower.

Weekly Sentiment
Weekly Sentiment

India VIX
India VIX

India VIX is currently in the declining phase since mid of june 2016 and currently at 12.9 very close to the all time low indicating that fear is completely eliminated from the markets.

Open Interest
NIFTY OI

Open interest is now currently maintaining the expiry range 8600-9000. Put writers are currently aggressive at 8500PE and 8600PE, Call writers are aggressive at 9000CE. And the Participation Open Interest indicates that FII’s and Clients piled up their inventories in futures to the extreme.

The post Momentum Slowdown in Nifty Futures appeared first on Marketcalls.

Are We in a Emotional Buyers Market?

$
0
0

emotional-market

If you frequently track gap in Nifty (Spot) you would understand that there are so far 10 unfaded gaps since the start of March 2016. Current leg of rally is almost 8 months old and during this leg we had hardly made only 2 gap downs, 19 gap ups and 10 unfaded gap ups. which indicates that we are in a emotional buyers market.

Why does that Matters?

It matters a lot from a short term or medium investors perspective. An Emotional Buyers market is sort of overbought market where an short term/medium term investor rarely benefit in the given scenario. statistically, the odds of closing the gaps favor a lot. Chasing the trend as current juntion might not be a wise decision though.

Previously we had spotted a emotional market behavior in CNX IT. As everyone know that IT sector under performs drastically compared to the benchmark index Nifty 50 and also made a negative returns YTD.

In any Emotional Market longer timeframe players are hungry enough to drive the market along with the mad crowd. This is not a healthy situation for a trending market.

The post Are We in a Emotional Buyers Market? appeared first on Marketcalls.

Market Profile : Understanding Price Vs Value

$
0
0

For many people price by itself not a key factor while making a purchase decision. No one will be buy a house or mobile phone just because of the price tag. Most of us understand the value (i.e offerings, features, benefits) before making any purchase decision and not solely based on product price. While making a purchase decision price is one of several variables which attracts buyers to evaluate when they mentally assess a product’s overall value.

price-vs-value-quote

Price is simply a advertising mechanism. If the advertising is successful it attracts buyers. There are times a price tag failed to attract buyers if the price is not worth the value and shuts down buying activity. Many traders does not make this distinction between price and value and often they are price based traders. If you simply trade the price without looking into the value you often get emotional and often ends up entering at the unfair price points .

Start here if you are new to market profile charts

Let take the example from Nifty September Futures profile charts. You can see that friday’s value was lower than the thursday’s value. It was clear that as the auction unfolded that we would have lower value on friday. This observation would have helped you to maintain your trading decision on not to carry forward your longs to monday morning.

nfsep-30-min-09_09_16

The relationship between price and value differs in a trending environment and sideways market. In a trending environment or breakout mode value catches the price and the price lead the value. It is a price discovery mechanism where price is searching for a new equilibrium where buyers and sellers finds a fair value and the two way auction process happens. In a sideways markets price catches the value whenever the price moves away from the value.

The post Market Profile : Understanding Price Vs Value appeared first on Marketcalls.

How to Play a Faster Market?

$
0
0

There are events like Union Budget 2016,BR-Exit where the downtrend was imminent followed by the faster recovery and in most of the panic situations recovery was faster than we think. And there are times where we face slower markets. One of the problem we face in today’s trading world is market changes its opinion faster than a human mindset and there are times it frustrates a traders and changes its opinions slower than we think.

thinking-fast-and-slow

The problem is we dont want to change our opinions faster when there is a sudden trend reversal in the markets followed by a sudden reversal. Our human minds are not prepared to handle such extreme price movements. And often subject to cognitive biases followed by erroneous and emotional predictions about the market. All of us, and especially experts, are prone to an exaggerated sense of how well we understand the trading world. This is where our competitors plays a major role and take advantage by trading against majority of the opinions.

//www.youtube.com/watch?v=uqXVAo7dVRU

When to think fast and when to think slow are two different brains involved. Reading “Thinking Fast and Slow” by Daniel Kahneman who won the Nobel in economic science could solve some of your thinking abilities and drives you to cultivate as habit of thinking and helps to avoid blindly repeating our same mistakes over and over again.

The post How to Play a Faster Market? appeared first on Marketcalls.

Will Nifty Futures Pullback to make New High?

$
0
0

Nifty Futures opened gap down and made a island reversal pattern on Monday. Though it is a classical bearish pattern,markets generally reacts against the classical technique most of the time. Trading Sentiment is negative and after the Monday’s impact on markets expectation on the psychological figure 9000 reduced.

island-reversal

Is the Markets Tired? Yes We are in a Emotional Buyers Market which makes the market tradeable but doesn’t suit from the investing view point as the Markets are dominated by shorter timeframe buyers and sellers hunting each other stops and colliding with each other in September series. Currently shorter timeframe sellers are in control and the recent down move looks like more of long liquidation and to remove the weaker shorter timeframe buyers who anticipated the psychological level. Since the drive is more of shorter timeframe sellers behavior and their inventories are piled up one can expect their stops to be hunted in upcoming trading sessions.

From the Open Interest Point this expiry market is expected to move in a narrow range 8600-9000 as both put and call writers are active in those zones. Volatility increased on Monday trade India VIX is at 15.24 up by 15%. Volatility is like a energy drink which is much more required to get some momentum in the markets and it makes all the trading participants active and makes exotic price movements and brings bizarre and unexpected swings. Stops have to widen as volatility increases substantially and the trading quantity has to be reduced as the swings are quick and wide.

open-interest

The post Will Nifty Futures Pullback to make New High? appeared first on Marketcalls.

The Mind Game for Exercising Traders Brain

$
0
0

The Bloomberg Tradebook Trader Exercise has been designed by The ReThink Group to assist traders in practicing the thinking style. This mind game can be accessed over the web and bloomberg terminal.

Ironically, brain and behavioral research shows that the markets only masquerade as a numbers game. They are actually a game that neuroeconomists have called “intentional social risk”.

bloomberg-tradebook

As such, this trader brain warm-up leverages classic psychology research into the perception of social meaning. If indeed the brain works a bit like muscle, engaging with the exercise can be expected to help bring a trader into the right mindset to make his or her best trades.

This game is based on Classic Heider-Simmel Experiment (1944) – Using only geometric shapes, they determined that almost 100 percent of subjects watching such shapes move impute human meaning and a story to the movements. Even when their shape video played in reverse, all but two of the studies’ subjects reported a detailed story being played out. A series of video is played out with moving shapes followed by questions to predict a particular shapes next move.

shape-game-trading-pschycology

Predicting the movement of the shapes taps into a brain facility called Theory of Mind which has been shown in brain scans to be the thinking style underlying exceptional market prowess.

Engaging with the Bloomberg Tradebook Trader Exercise can reasonably be expected to tap into a trader’s the most useful neuronal “muscles”. Consciously working with the actual skill underlying performance – social cognition – should in effect warm-up the trader’s brain in a way that makes it more facile and effective in anticipating the likely development of price action. We hope you enjoy this exercise and we believe that with practice, it will benefit your trading

The post The Mind Game for Exercising Traders Brain appeared first on Marketcalls.


How an Institutional Trader Gets Large Pool of Liquidity?

$
0
0

fridays-price-action-explained

Lets analyze the Fridays Intraday Price movement of Nifty Futures 1-min chart to understand how exactly Institutional Traders Gets Large Pool of Liquidity? and lets try to understand the context behind that move. On Friday, Nifty futures opened gap up and continued moving unidirectional and lasted for almost 90 minutes. First 90 minutes is a crazy fast upwards drive. Most of the traders (including me) expecting the upside gap (8890 zone) to get closed. Market Sentiment is totally bullish. However 10:45a.m – 1:30p.m is totally a frustrating moment for trend followers as the market is tightly moving in a narrow 25 point range.

And all in a sudden shorter timeframe sellers stepped in and driven the market towards the previous day range thereby closing the gap created in the morning. Move was faster and sharp down move. It also turned the market sentiment from bullish to bearish.

So What could be the motive behind the move?

One of the possible reason is to get fresh liquidity of the sellers aka shake the weaker hand buyers or attract emotional sellers! We call it as liquidity hunt.

What is Liquidity hunt?

Well you need some imagination to understand this topic. Let say you are from ABC institutional desk and you have goals to acquire 10,000,000 shares of Nifty Futures by today at a better net execution price. However market is bullish and there is no enough demand from the sellers as the market sentiment is highly bullish and buyers are dominating and it is practically impossible to get instant liquidity from the sellers.

One way is to acquire slowly and steadily from the market but the problem is you may not get a better effective net price. Alternatively one has to identify where could be the possible maximum sellers liquidity so that big players can drive the market towards the zone (also called as stop hunting) to and get the liquidity.

How by driving the Market Lower you get sellers liquidity?

There are various ways to manipulate liquidity. One of the easiest way is most of the intraday players/positional players have a habit of placing their stop loss at days low, days high, prev day high/low, weekly high/low zones. Possibly the buyers who entered in the market at the market open and the one who entered late seeing the breakout rally would believed that Current Day’s low or Prev Days High or 3 Day high as a potential support zone.

More over many participants those who are watching from outside who wants to enter shorts are the ones who wants markets to break those support zones. So when crowd has a major opinion, it drives pool of crazy liquidity. Shorter timeframe sellers are hitting those zones with smaller volumes, probably their motive is to trigger those large pool of liquidity, make the weaker hands (buyers) to liquidate/sell their positions and also attract the emotional positional sellers (who believe that market will crash from here on) and there by acquiring Nifty Futures at a better possible net effective price.

End of the day Institutional traders would have carry-fwded with their longs, Weaker buyers shaken out and Emotional Positional Sellers carry-fwded with shorts. And the Markets though closed positive would have ended in a negative sentimental note.

The post How an Institutional Trader Gets Large Pool of Liquidity? appeared first on Marketcalls.

How the Liqudity Hunt Happened on 21st Sep 2016

$
0
0

nf-liquidity-hunt

Lets understand the price movement of Nifty Future charts on 21st Sep 2016 and lets try to understand how the liquidity hunt happened. Nifty Futures opened within previous days range and started moving up unidirectional in the first 90min which also broken 2 day high followed by sideways action till 12:45p.m. The sideways action is followed by a sharp selloff in the noon session triggering huge volume at the bottom.

Our motive is here to study who are the buyers/sellers who appeared all in a sudden?

If you notice 1min charts of nifty futures the volume triggered around 2:18p.m is around 6,67,725 which is almost 10-15 times normal than the usual volumes. Who is transacting all in a sudden. We know that, any transaction at any given price involves both buying and selling parties. So who is exactly willing to buy and sell with that huge volume exactly at that price?

As i explained in liquidity hunt article most of the traders have habbit of placing stops at day high, day low, weak high, weak low, significant high or low and even at round figures below 8800 as expained in stop hunting. In this case traders would have placed their stops below 8800 zone or even below the prev significant low zone 8786.1. Also traders who want to short this market would placed their limit orders below 8800 or significant low zone 8786.1.

Trapped Sellers – Orderflow Charts of Nifty Futures
trapped-sellers

Smart traders who wants more liquidity would love to trigger this zone and thereby swallowing all the liquidity triggering huge volume on the charts. Liqudity hunt is very much visual from Orderflow as well where sellers get trapped at the extreme bottom as shown in the above orderflow charts.

Moral of the story : Knowing what is happening in the market provides more edge rather than trading blindly with support resistance zones or simply placing stops around high/lows and ends getting trapped.

The post How the Liqudity Hunt Happened on 21st Sep 2016 appeared first on Marketcalls.

Who is Dominating Bank Nifty Futures Now – Market Profile Case Study

$
0
0

Bank Nifty Daily Charts

bank-nifty-sep-futures

Interesting Development happening in Bank Nifty Futures on the daily charts. Bank Nifty Futures had broken the 15 days of consolidation movement with a strong breakout and also close below the bottom of the consolidation zone 18760. This post is to analyze whether the breakout is really strong or not. Market Sentiment is really negative and the last fridays sentiment continued on monday as well.

Bank Nifty Profile Charts

bnfsep-30-min-26_09_16

Bank Nifty Futures formed a double distribution on Monday. By Reading the Bank Nifty September Futures profile charts you could witness only shorter timeframe sellers are driving the market so far. Shorter timeframe sellers are strongly visible at 20650 (poor high), 20570 (Poor High), 20195 (Halfback rejection), 19808 (Mechanical Selling around Open).

bnfsep-30-min-26_09_16

Shorter timeframe sellers moved the price to the other side of the Daily balance and further continued the tone of the market from weaker sentiment to strongly weaker sentiment. If the sellers are really strong they will maintain the tone negative in the upcoming sessions as well. However if the price is moving back into the consolidation zone suggests that sellers are getting weaker and the confidence of sellers are not great.

The post Who is Dominating Bank Nifty Futures Now – Market Profile Case Study appeared first on Marketcalls.

U.S. Elections May Affect Online Forex Trading

$
0
0

Any trader of foreign currencies likely understands the influence that both local and international politics have on currency values. Successful online forex trading involves following the changes and trends that are taking place across the globe, and making the right trades at opportune moments to capitalize on changes of currency values.

us-presidential

Without a doubt, a current event that will influence the forex markets is the United States presidential campaigns and election that will be held in November. The United States is one of the most powerful nations in the world and whoever becomes the leader of that nation – whether it be Democratic candidate Hillary Clinton or the Republican bid Donald Trump – will have an enormous sphere of influence. Every decision they make has the potential to influence online forex trading.

Following these trends can be extremely difficult, even for the most experienced traders. That’s why it’s important to utilize the tools provided by your trading platform. For example, XTrade offers a powerful platform that allows you to track the values of currencies and can help you make educated trades. For more information, click here.

Election Debates May Influence Forex Values

One example of how the election campaigns can influence online forex trading is this week’s televised election debates. Donald Trump will face off against Hillary Clinton for what is expected to be one of the most televised events of the year.

The United States dollar is vulnerable to fluctuation in its value and comments by the candidates can push the dollar in one direction or another. The candidates sit in a powerful position and they are able to influence currency values with the slightest comments.

According to Reuters, traders will be watching the debate closely to see who comes out on top because the winner could influence the dollar’s short-term value.

“If the debate ends in favour of Trump and adds to his support, we may see dollar/yen slip on risk aversion. Trump has strongly backed a weaker dollar, which is likely to retreat particularly against the yen if he is seen to have taken the lead,” said Barclays Japan FX strategist Shin Kadota.

Using Trading Platforms to Capitalize on Political Changes

So, how can you use your trading platform to capitalize on the changes in currency values that result from political changes? The first step is to simply stay informed and keep up to date with current events. Try and read many different sources of news, especially those with a financial orientation, in order to get a full picture of the state of affairs in the world. This will help you stay notified of potential changes in currency values that you can trade against.

Similarly, it is important to use the best online forex trading platform. Be sure to use a platform that lets you trade wherever you are, both on mobile and desktop computers. This way you can make trades on a moment’s notice. Similarly, use a platform that has good customer service. You want to be sure that you have access to support and services in the unlikely scenario that you face an issue with your trading platform.

The post U.S. Elections May Affect Online Forex Trading appeared first on Marketcalls.

Nifty Futures Expiry Crash and October 2016 Overview

$
0
0

Nifty Futures September Expiry – 1min Charts
nifty-sep-expiry-crash

Nifty Futures on the September Expiry Date Crashed -1.9% on a strong sentimental note and it is a strong rejection out of the previous consolidation zone 8700-9000. The drop was imminent post the break of 8700 zone on the announcement of Indian army launched surgical strike on Pakistani soil.

BankNifty Futures September Expiry – 1min Charts
bank-nifty-sep-futures

BankNifty September Futures Crashed roughly 800 points intraday. And the top made in the first minute after the market open. Crash in Bank Nifty would have made the naked put option writers scream on the expiry day.

Indian army Surgical Strikes News on TV

//www.youtube.com/watch?v=we8I35F_4Ts

Nifty Futures EOD Charts
non-linear-breakout

From the EOD Charts clearly we broken the trading range with a strong sentiment which will have extended pressure from the sellers. VIX increased 33.24% and the F&O turnover in NSE FNO segment increased to 11 Lakh Crore. Which indicates that breakout sentiment is really bad.

Unless price resumes back into 8700 zone we are not seeing any solid aggressive buyers returning back. Moreover daily chart ends with a bearish engulfing pattern with price rejection at the open.

india-vix

The aggressiveness of the price movements along with strong and commanding volume indicates the presence of intermediate/longer timeframe sellers. Overall Shorterm sentiment is negative and we can expect further downturns if price open below 8600 in OCT Futures.

The post Nifty Futures Expiry Crash and October 2016 Overview appeared first on Marketcalls.

Sentimental RSI – TradingView PineScript

$
0
0

Sentimental RSI helps shorter term discretionary Traders to prepare for their trading decision. It doesn’t gives buy or sell signals but guides you to focus on right side of the trade most of the time especially when you holding period is for 2-3 days.

sentimental-rsi

Just like any other indicator it has whipsaws but responsive and smooth compared to the traditional RSI where the noise factor reduces and helps you to focus on mean reversion trades.

The Color Transition from Red to Yellow indicates possible mean reversion from negative to positive trend

The Color Transition from Green to Blue indicates possible mean reversion from positive to negative trend

The Color Transition from Yellow to Green indicates possible positive trend continuation.

The Color Transition from Green to Blue indicates possible negative trend continuation.

Indicator suits to understand the underlying sentiment on the higher timeframes like 4h, Daily. Helps you to understand the underlying trend setup during your pre-trade analysis.

Tradingview Pinescript Code for Sentimental RSI

The post Sentimental RSI – TradingView PineScript appeared first on Marketcalls.

Webinar on LinTRA – Intraday Trading System & System Performance

$
0
0

bhel-5-min-03_10_16

If you’re looking for a hands-on experience that will give you the confidence to build Intraday trading system this introductory webinar could guide in some of basic principles, tactics and case studies required for building and understanding intraday trading models.

//www.youtube.com/watch?v=AgVc3q-0w1c

What the Session Focus on :

– Understanding LinTRA – Linear Regression Based Intraday Trading System
– LinTRA Vs LinPos
– How to Configure Notification Alerts
– LinTRA System Metrics
– How your Brokerage/Slippage impacts your Trading System
– Position Sizing

Mode : Online Webinar

Date and Time
Mon, Oct 10, 2016 8:00 PM – 8:40 PM IST

Who Should Attend :

Those who are interested in Learning about trading system & trading software enthusiasts.

The post Webinar on LinTRA – Intraday Trading System & System Performance appeared first on Marketcalls.


Trader Education Week – A FREE trading event that will teach you how to spot trading opportunities in your charts

$
0
0

Dear Trader,

You have an opportunity to spend the next week learning how you can spot high-confidence trade setups in the charts you follow every day.

Elliott Wave International (EWI) is hosting a free Trader Education Week, October 12-18. Register now and get instant access to free trading resources — and you’ll receivemore lessons as they’re unlocked each day of the event. Plus, you’ll be invited to attend a live, online webinar with Jeffrey Kennedy on October 13 and have the opportunity to ask him questions about the lesson he teaches that day.

5669-alb-ewj

Jeffrey Kennedy, EWI Senior Instructor and a Chartered Market Technician, has taught thousands how to improve their trading through his courses, subscription services and as an adjunct professor of technical analysis at Georgia Tech University. Now you have the opportunity to be a student in his online classroom, as he takes complex technical methods and tools and breaks them down so that you can apply them to your trading immediately.

Don’t miss this opportunity to learn how to spot trading opportunities in the markets you follow.

Register today and get your first 3 free trading resources immediately, plus we’ll alert you to valuable new resources unlocked every day beginning October 12.

Register for Trader Education Week — It’s FREE!

The post Trader Education Week – A FREE trading event that will teach you how to spot trading opportunities in your charts appeared first on Marketcalls.

Nifty Futures and Bank Nifty Futures October 2016 Outlook

$
0
0

The RBI cut benchmark rates by 25 basis points (bps) on 4 October, bringing down the repo rate from 6.5% to 6.25% since then there is a significant underperformance in banknifty futures as compared with nifty futures. And this underperformance in banknifty futures is expected to continue in the upcoming trading sessions as every minor rallies in banknifty gets rejected at higher level and sellers stepping in.

Nifty Futures Daily Charts
nifty-futures-daily-charts

Nifty Futures is currently trading near the crucial support zone 8720 zone which is a go or no go zone. As long as price trades above 8700 zone one can anticipate price oscillation around 8700-9000 range. One has to be cautious if any day price tends to trade and close beloww 8720 levels.

Too many consolidation zones in both nifty and banknifty futures indicates that we are dealing with a aged trend. Which means long trades has to be handles with reduced position size compared to the short trades and one should mentally prepare for any quick reversal trades. One should not forgot that we are in a emotional buyers market which is not a good sign for a long term trend evolution.

Bank Nifty Futures Daily Charts
bank-nifty-futures-daily-charts

Nifty Open Interest Lookup

Nifty Open Interest Range for this series is 8500-9000 range. Call writers are active at 9000CE and put writers are active at 8500PE and 8600PE levels. And the current downtrend in nifty and banknifty is more of liquidation in index futures positions from the participants and no fresh addition of shorts visible in this series. India VIX is back to square one after the surgical strike attack. Currently we are facing a low volatile markets and fear started to reduce but with improved volatility compared to previous month.

nifty-oi

The post Nifty Futures and Bank Nifty Futures October 2016 Outlook appeared first on Marketcalls.

Raising the Caution Flag in Nifty Auto Sector

$
0
0

Nifty Auto Weekly Sentimental Charts
nifty-auto

Since 2012 Nifty Auto Sector had delivered phenomenal returns of more than 300x times Return on Investment. That shows the significant presence of longer time-frame participants who believed in the growth story and economics of the auto sector. Also sheer out-performance when compared with benchmark index Nifty 50.

On the weekly charts momentum buyers are coming and buying every break. Momentum drivers are the trend makers in the current rally. They bought despite the recent global and local extreme negative sentiments like BR Exit, Surgical Strike attacks. Definitely would have raised the eyeballs of sidelined and newer investors.

However too many consolidation patterns on the weekly charts indicates a possible distribution activity could be underway and long term buyers drying up and lacking momentum to drive the rally further higher which is a weaker sign of trend persistence.

Nifty Auto Daily Charts

nifty-auto-daily

Our take is whomever going to invest at this juncture in auto sector are more likely to end up catching unfair price and more likely not going to favor shorter term buyers and medium term buyers in this sector as the odds of trend reversal is high.

Possibly investing activity in Nifty Auto sector is drying up, momentum starts to lag and more likely to under-perform benchmark index in the medium term. Probably a better time to hedge the long term positions if one still believe in the growth story.

The post Raising the Caution Flag in Nifty Auto Sector appeared first on Marketcalls.

Is the Broken Support in Nifty is Really a Support Zone?

$
0
0

nifty-futures

Nifty futures had done a interesting activity on the daily charts. If you observed the historical daily charts of nifty futures you would have noticed that in the last three months 8580 zone is whipsawed multiple times (12 trading sessions in last 4 months) and whenever price approaches 8580 price made a pullback and buying behavior happens.

So does it mean 8580 zone is a support zone?

In a classical technical analysis it means price respected 8580 zone multiple time and hence the becomes the support and if you would draw a trendline it would have broken yesterday as shown above and hence it becomes the resistance zone (Not sure who written this dumb rule). In reality when 8580 is respected multiple time then it mean many participants are valuing as a fair place to get a trade and buyers show some interest at those price zone. If those zone got broken again and if the buying activity resume on the second day and let say the price is above 8580 then it still means buyers are interested in those zone.

Remember you are not the only one watching the supports/resistance, trendline breakout almost everyone watches the same movie! And if the price gets defends 8580 and still sellers are willing to take control then you can see price moving down further. When we put such nonsensical rules and market reverses against our opinion you mind could not make it rightly aligned with the market direction and ends up trading against the trend.

Moral of the Story : And support is not a support and neither a resistance is nor a resistance. Supports/Resistance are meant to be tested.

The post Is the Broken Support in Nifty is Really a Support Zone? appeared first on Marketcalls.

Marketcalls Android App Now Available in Google Play Store

$
0
0

We are pleased to announce the addition of a android mobile app for all of our users. The App is intended for traders/investors who love to learn and evolve with Marketcalls. You get updates on focused learning and observations about stock market movements, trading strategies & trading software.

Coming Dec 2016, iOS users will have access to the Marketcalls mobile app via the App Store. The app will be free for all users, but will require a free signup to use.

android-app

Features

-Get Instant Market Related Alerts from Marketcalls
-Interesting Charts
-Read Recent Articles from Marketcalls
-Intelligent Market Analytics, Strategies on your finger tips​​​​​​​

en_badge_web_generic

In case if you are facing any issues you can send your queries to support@marketcalls.in for any resolution. Hoping to add more interesting features in the upcoming version which really makes more sense from trading standpoint.

The post Marketcalls Android App Now Available in Google Play Store appeared first on Marketcalls.

Viewing all 2070 articles
Browse latest View live