Quantcast
Channel: Market Calls
Viewing all 2070 articles
Browse latest View live

Option Action – Options Analysis Tool for Indian Markets

$
0
0

OptionAction is a Option Analysis tool which lets you to build and analyze option strategies for Indian Stock Markets. It provides most of the analytics required for a option trader to practice and implement their option strategies. Though it is a simple tool with cool UI interface you can build any complex option strategies with the available pre built option templates.

OptionAction comes with features like Option Chain, Option Greeks, Option Strategy Builder, Option Greeks Calculator, Option Pain, Put-Call Ratio (OI & Volume), Open Interest look up, Volatility Smile, Volatility Cone and much more features.

Step to Download OptionAction

1)Download OptionAction Setup and Install it

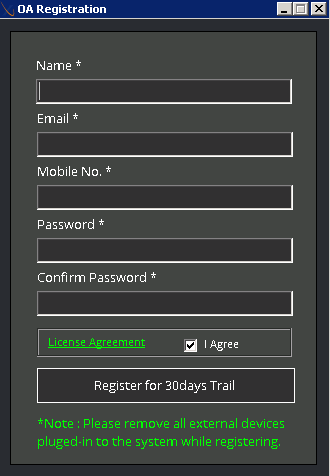
2)Open OptionAction. It opens the registration page. Give your registration details and register. This will send you the activation key details to the registered email id.

oa-registration

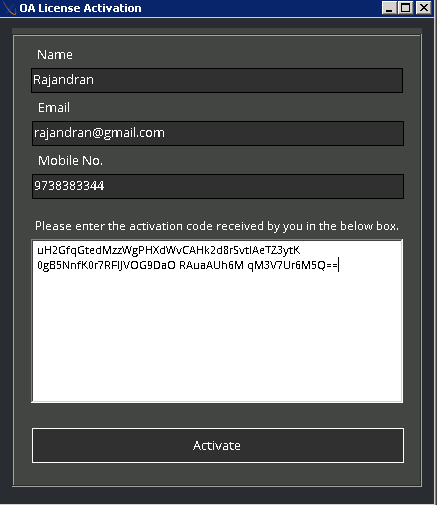
3)Copy the activation key you received in your registered mail and paste it in the activation code box as shown below and press Activate

license-activation

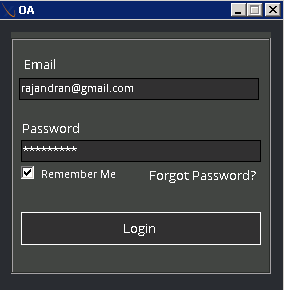
4)After successful license activation. It ask for user credentials. Enter the login credentials which you created during registration and press Login button.

oa-login

Features

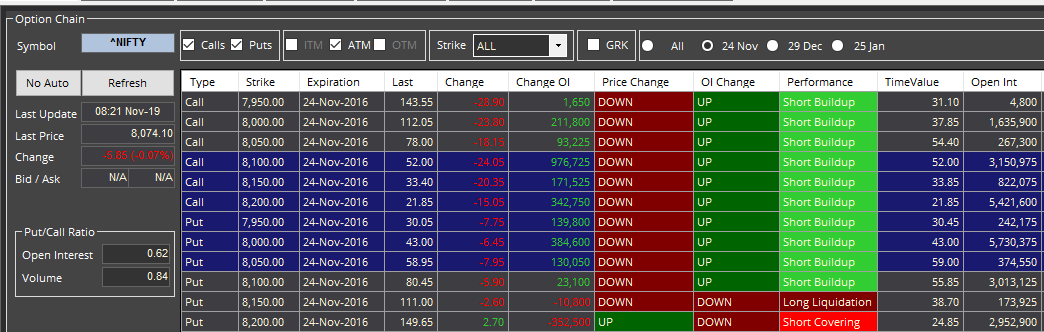
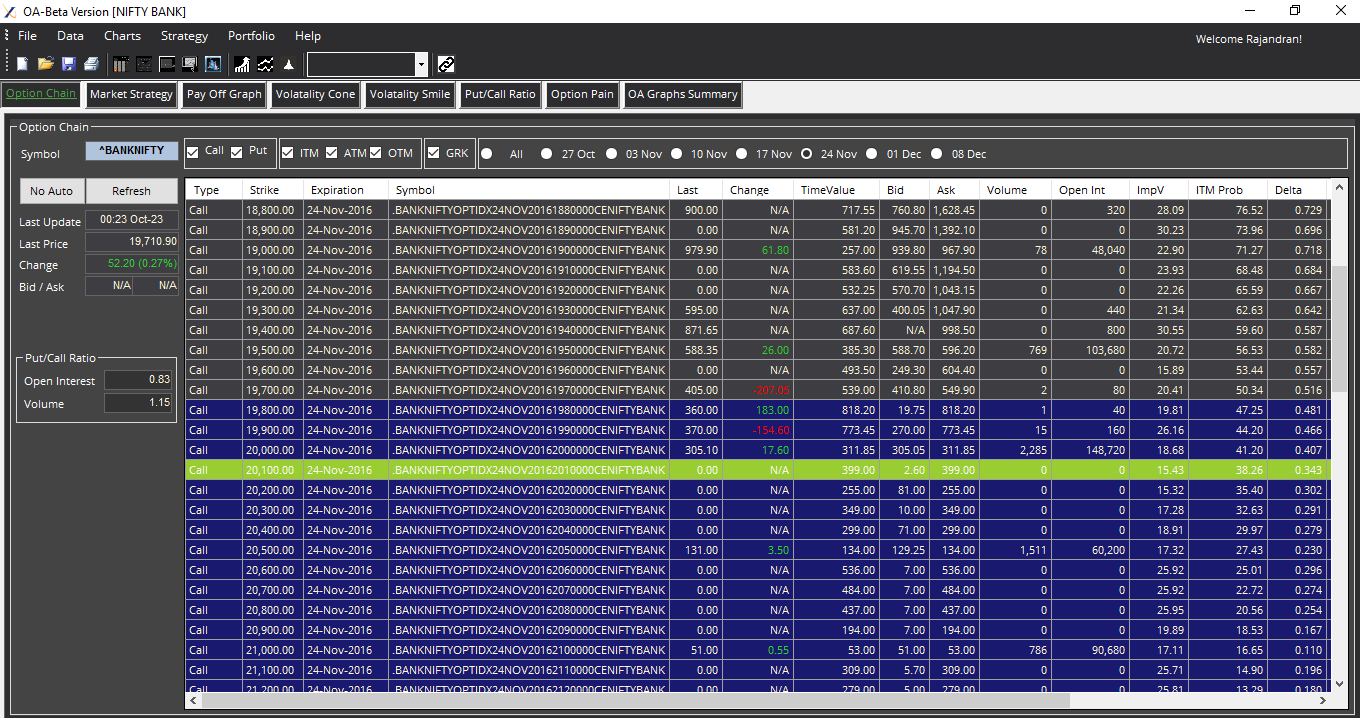
1)Neat and Cool Option Chain tool with Option Greeks, Implied Volatility, PCR Ratio (OI & Volume), Type and Search Symbols. It also computes total PCR ratio for the entire option expiry contracts or individual expiry contracts. By default it computes Total Put-Call Ratio for the entire expiry contracts.

oa-main-screen

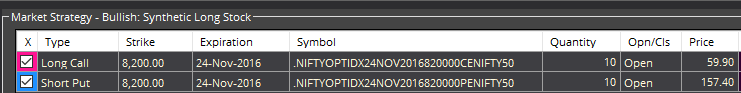
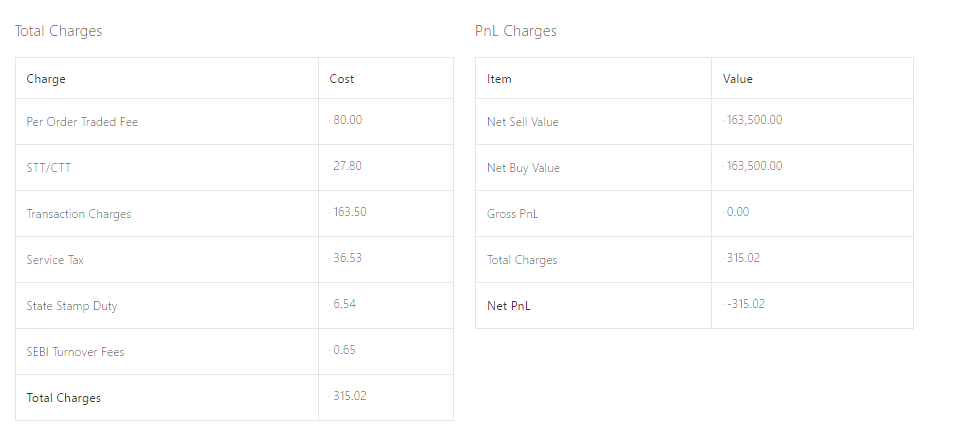
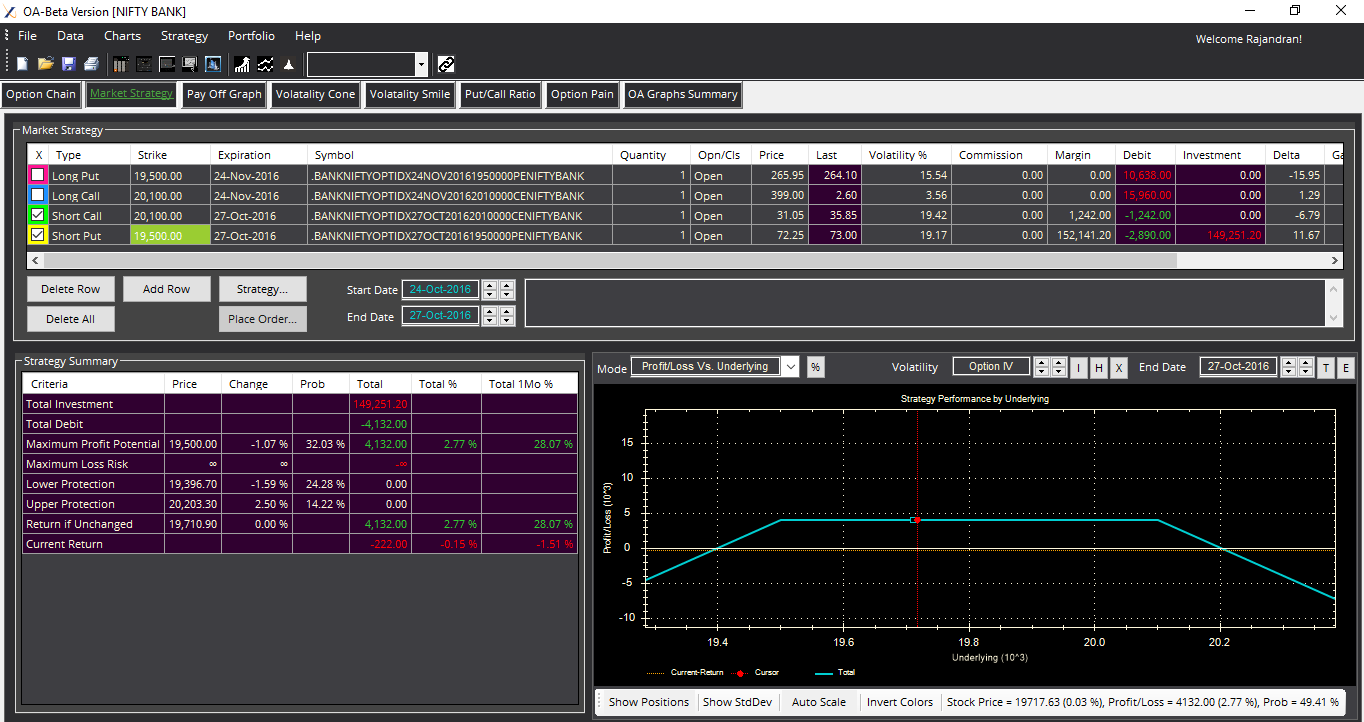
2)Market Strategy is where one can build their option strategy either manually or with custom prebuilt templates (click on strategy button to get pre built templates). Once the strategy is built you can immediately analyze using strategy summary and payoff graph analyzer as shown below.

oa-market-summary

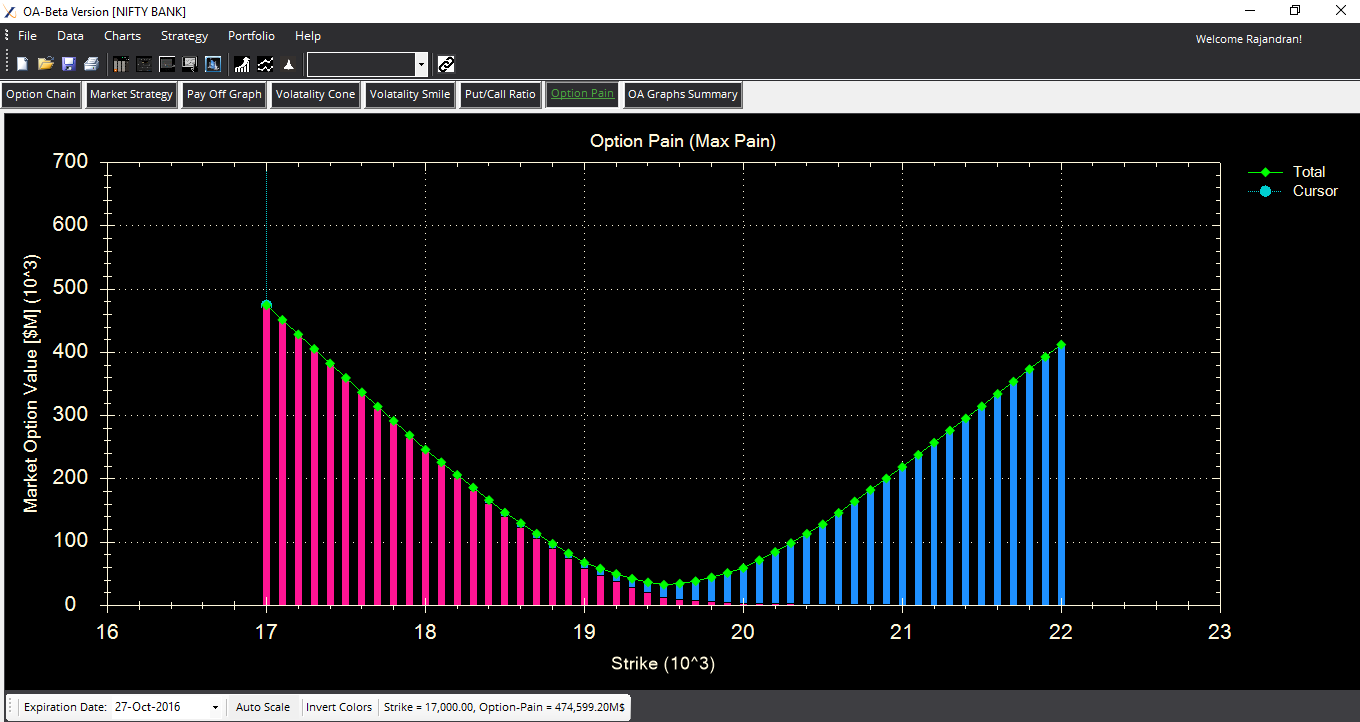
3)OptionAction provides provision to compute and plot Option Pain. Option Pain, also known as Max Option Pain or Max Pain, is based on the theory that since most options buyers lose in options trading, the price of the underlying stock must be manipulated somehow to close during options expiration at a price that results in the most options contracts expiring out of the money

oa-option-pain

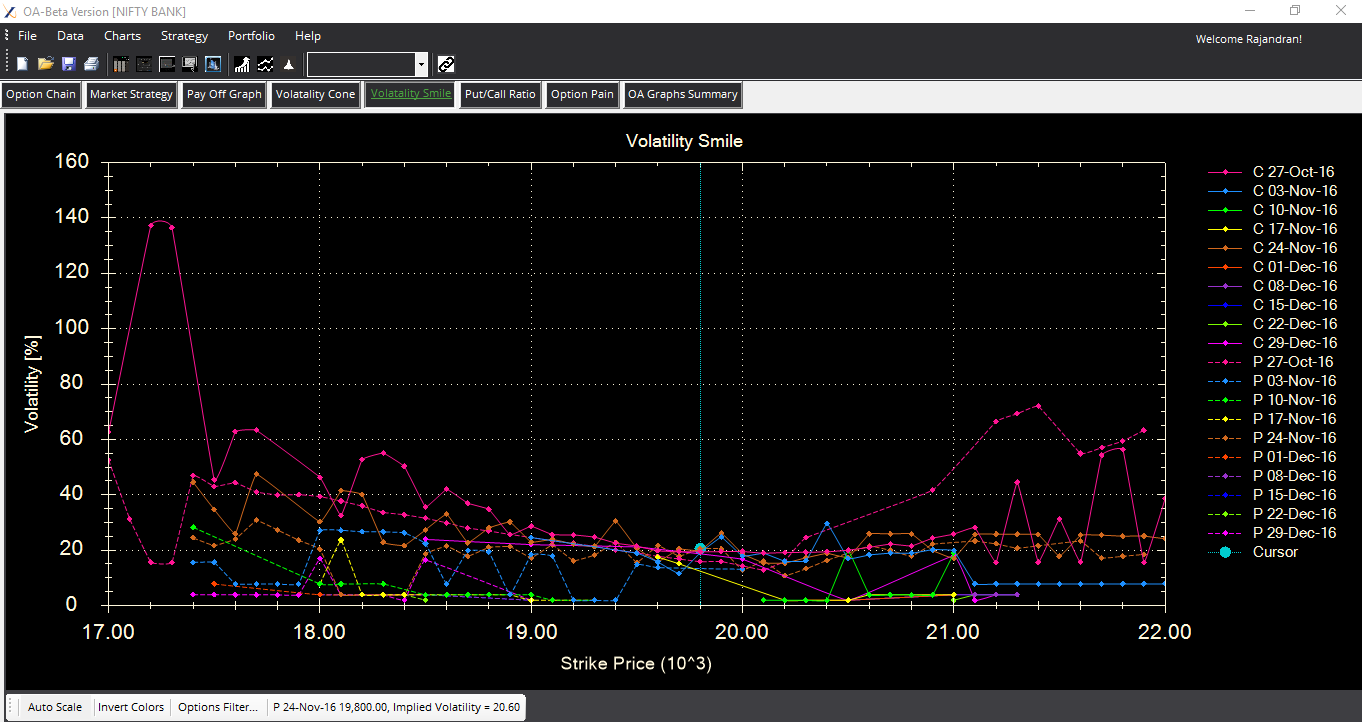
4)OptionAction comes with features like volatility cone, Volatility smile to understand which option strikes are cheaper/expensive when compared to the historical volatility

oa-volatility-cone

oa-volatility-smile

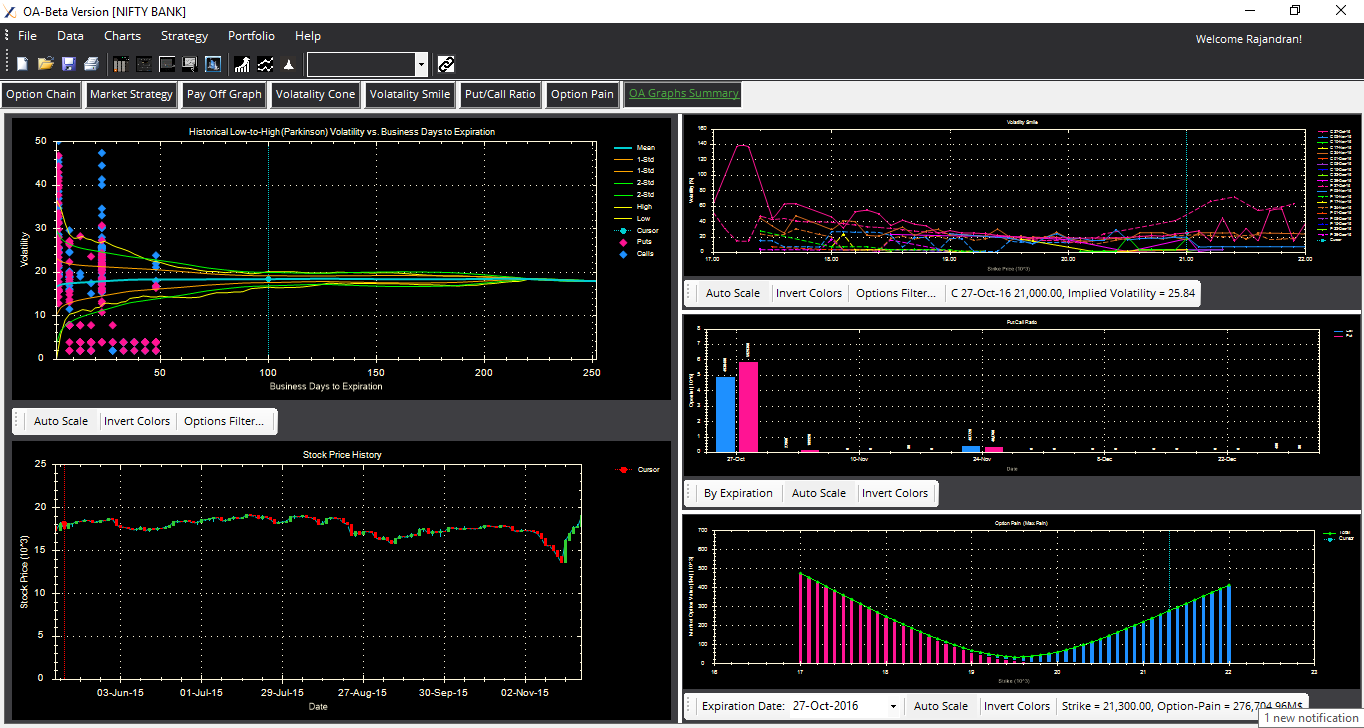
5)It also summarize the overall strategy with All in One Dashboard which gives you the bird eye view to the market condition and strategy overview.

oa-all-in-one-dashboard

For support or resolving bugs one can raise their queries at OA Desk forum.

Overall a good tool to try with. Hope the developers who engaged with OptionAction comes with lot more interesting features and analytical dataset.

The post Option Action – Options Analysis Tool for Indian Markets appeared first on Marketcalls.


What Happens When a Popular Executive Board Member Joins/Resigns ?

$
0
0

It is a interesting question from a sentimental point of view. Everyone gets excited especially the media channels and speculators when a popular chairman rejoins the board or a Resigns from the Board. Some how you need to understand that markets are crazy and illogical. So today I brought two case studies to understand how sentiment worked in the past especially when a popular Executive Board Member Joins/Resigns.

Mr.Narayanamurthy Chairman – Rejoins Board

infosys-chairman

On 1st June 2013 Mr. Narayanamurthy rejoins Infosys Board as Executive Chariman. Quite a positive sentiment revival for Infosys. People rejoiced before the stock market opens. On monday (3rd June 2013) market opened with a gap up along with 200 points price movement from the previous days close in just first 2 minutes of the market open. And then shorter term top is made for that week.

Infy Futures 1 Min Charts June 2013 Contract
infy-narayana-murthy

Jubilant CEO Ajay Kaul Resigns

jubilant-ceo

On 20th September 2016, Jubilant CEO – Ajay Kaul resigned after 11 years at the helm of the India franchise of Domino’s Pizza. Quite a serious negative sentiment for investors. Stock Price opened gap down and dropped almost 8% when the market opens and made the bottom in the first 15 minutes and that is the bottom made for the week.

Jubilant Food Futures 1min Charts – Sep 2016 Contract
jublfood-ceo-resigns

Moral of the Story : Markets Reacts to those momentary reactions it favors the crowd sentiment initially and it is a impulsive reaction which doesn’t last for a long time. Initial direction is always in the favor of the crowd thinking!

Now lets have a live study on 26th Oct 2016 how the markets reacts to the recent Cyrus Mistry Resignation and Ratan Tata takeover of Tata Group

//www.youtube.com/watch?v=EwgA3Y11djI

cyrus-mistry

May be market might have some ready made answer!

The post What Happens When a Popular Executive Board Member Joins/Resigns ? appeared first on Marketcalls.

Guest Webinar on Trading with Market Profile

$
0
0

We had already wrote couple of tutorials on Market Profile which could improve your understanding about Market Profile and helps you to organize the market generated information in a better way than any other trader. This time we are inviting Ninjatrader Ecosystem partner Vinod from BellTPO for a live discussion on the basic concepts of Market Profile and Trade Setups.

belltpo

What will be covered in the webinar?

– Understanding the Basic Building Blocks of Market Profile
– Market Profile Trading Setup
– How to analyze Market Profile Charts

Webinar Date & Time : 28th Oct 2016 7:30p.m – 8:15p.m

Who should attend the Webinar: Anyone who wants to kick-start with Market Profile studies.

The post Guest Webinar on Trading with Market Profile appeared first on Marketcalls.

Will Buyers in Nifty Futures hold 8580 zone?

$
0
0

In the last article we discussed about how the support and resistance zone created by nifty is a illusion as you are not the only one to watch those zones probably tonnes of all your trading competitors are watching this zones and placing their stops accordingly.

nifty-futures

If you are placing your stops where most of the people place their stops then a common phenomenon occurs frequently in the market to remove weaker hands from the market called stop hunting to eliminate the weaker players from the market.

If you closely look into the EOD charts of nifty futures you would noticed since August 2016 we had made almost 7 attempts to safeguard 8580 zone. Every time the price went below 8580 zone some buyers shown interest and pulled the price towards the upside. And todays nifty movement is the 7th failed attempt to close below 8580 zone. Clearly 8580 zone is a go or no go zone for bears. Any strong acceptance below 8580 could seriously drag the price lower further.

However at this point buyers are keen on holding on the 8580 level on EOD basis though intraday whips occurred around that zone. Any further pullback from this zone could extend towards 8800 zone.

The post Will Buyers in Nifty Futures hold 8580 zone? appeared first on Marketcalls.

Introduction to Market Profile : 42nd ATMA Bengaluru Educational Meeting

$
0
0

bell-tpo-color

I will be speaking at 42nd ATMA Bengaluru Educational Meeting on Introduction to Market Profile and will be sharing my trading experience on how to understand and apply in real life intraday/positional trading.

Event Date & Time : Saturday, 10 December 2016, 2.00P.M

The Education Meeting will focus on:

  •  Basic Building Blocks of Market Profile.
  •  Understanding Participants. Who is in control.
  •  Understanding the Complexity of the Markets with Market Profile.
  •  Top Down Approach, Excess and Balance.
  •  Market Internals, Volatility and Market Profile.

Meeting schedule:

  • 1:45pm – 2:00pm : Registrations open
  • 2:00pm – 2:30pm : Light refreshments and networking
  • 2:30pm – 4:30pm : Educational Session
  • 4:30pm – 5:30pm : Snacks and Networking

Venue: Sri Bhagawan Mahaveer Jain College Conference hall, 34, 1st Cross, Next to Bangalore Stock Exchange, J C Road, Bengaluru,Karnataka – 560027.

Registration fee: Non ATMA Members: Rs. 750/- plus taxes

Member Discount: 100% for ATMA members, Members kindly log-in to ATMA website & Register for the meeting to receive the Discount.

Kindly Note:

  • Registrations will open at 1.45pm and close at 2.00pm sharp to ensure the programme starts on time.
  • Only when someone has genuine difficulty in online payments may write to events@atma.ac requesting ATMA Bank details and deposit the fees at ATMA Bank account, scan the pay in slip and email the same back with the subject line stating 42nd ATMA Bengaluru Meeting Fees: First Name Last Name.
  • Since seats will be allocated ONLY on a first come first served basis on registering, please do drop back a line to us on events@atma.ac in case you choose later to not attend the venue so as we can at least give the seat to a wait listed person.

The post Introduction to Market Profile : 42nd ATMA Bengaluru Educational Meeting appeared first on Marketcalls.

Here’s What Makes Elliott Waves a Useful Forex Tool

$
0
0

Some Elliott wave forex traders do watch the news — but for different reasons

By Elliott Wave International

Last Friday, EURUSD rallied strongly. Said Reuters:

“The U.S. dollar tumbled against a basket of major currencies…on U.S. political uncertainty after the FBI said it would review more emails related to Democratic presidential candidate Hillary Clinton’s private email use.”

It’s true that the euro rallied after Friday’s news. But we pointed out in our October 21 story that Elliott wave patterns had already been calling for a bottom, if only a temporary one.

eurusd

EURUSD didn’t get there in a straight line — in fact, on October 25, it made a slight new low for the move at 1.0850. But from there, it surged strongly, and by the time the Clinton news hit the wires last Friday, the pair was well off the lows. In other words, the news came at the end of the rally, not the start of it.

Which brings up this question: What gives Elliott waves the ability to warn you about trend changes before the news? The answer begins with a conversation about what the markets’ true driver is.

Every single day, the mainstream finance makes the connection between the markets and the news. Even when the market move doesn’t fit the news, they still tie them together — by using the word “despite”:

  • “Despite strong earnings reports, stocks fell on Wall Street today,” or
  • “The dollar rose despite a weaker-than-expected jobs number.”

Sounds familiar, doesn’t it? News or no news, you still come away thinking that A caused B.

The problem with this approach is… well, there are several. One, as we’ve just discussed, the markets often defy logic. Two, you’re always left to play catch up: You wait for the news; you watch the market react; and only then do you try to jump on the moving train, so to speak.

Even if you take a guess and open a position before a scheduled new report, you’re still at the mercy of market’s reaction — which, again, is far from being logical 100% of the time. (Look at the U.S. stock market, for example: It’s now traded flat for two months, “despite” tons of news stories, good and bad.)

Here’s the reason why Elliott waves help you cut through this fog: Waves track market psychology, which goes where it goes before the news; regardless of the news. That’s why even those Elliott wave forex traders who watch the news do it for different reasons than everyone else:

  1. Elliott wavers often keep an eye on the schedule economic releases because often, they will mark turning points which Elliott wave price patterns already warned you about.
  2. The news often convey an extreme in market sentiment. For example, if you keep hearing over and over that “everyone hates the euro right now,” that tells you that the market’s collective psychology is reaching an extreme; everyone has already sold their euros. And if at the same time your Elliott wave analysis tells you that yes, the market is about to reverse, you can use those “extreme” news stores as a contrarian indicator.

Do Elliott waves always work? I wish; what does? But because prices often do follow the Elliott wave model, when you forget about the news for a day and watch price patterns instead, the results might surprise you.


Free 14-Page eBook
Trading Forex: How the Elliott Wave Principle Can Boost Your Forex Success

Learn how to put the power of the Wave Principle to work in your forex trading with this free, 14-page eBook. EWI Senior Currency Strategist Jim Martens shares actionable trading lessons and tips to help you find the best opportunities in the FX markets you trade.

Get instant, free, access

This article was syndicated by Elliott Wave International and was originally published under the headline Here’s What Makes Elliott Waves a Useful Forex Tool. EWI is the world’s largest market forecasting firm. Its staff of full-time analysts led by Chartered Market Technician Robert Prechter provides 24-hour-a-day market analysis to institutional and private investors around the world.

The post Here’s What Makes Elliott Waves a Useful Forex Tool appeared first on Marketcalls.

Indian Sectors Round Up and RRG Charts lookup before US Elections Results

$
0
0

8 November Tuesday, In New York time the voting (US Election) is expected to open between 6 am to 7 am and close at around 7 pm to 8 pm in most of the areas. It may continue till 9 pm in Iowa and North Dakota. The real clarity will emerge around midnight India time on Tuesday night and by Wednesday 8:30am India time, all the voting will be over. Usually we’ll know the winner by 2am IST on Wednesday And if it is a really hard fight then latest by 6am Mumbai time. As the US Elections and Election results are near and its time to lookup into the NSE sector performance.

Below Chart shows the sector performance year to date. Nifty Metals and Nifty Auto are the top performer for this year and gained 46.14% and 18.52% respectively and relatively outperformed the benchmark index Nifty 50(5.91% return).

sector-performance

RRG Charts

Relative Rotational Graph indicates that sectoral weakness visible in Pharma, IT, Commodities and Metal sector where the momentum is falling and also falls in the weakening and lagging quadrant. which underforming nifty currently and also likely to underperform in the near term. CNX Infra and Bank Nifty is showing a falling momentum but still circling around the leading quadrant.

rrg-chart-indian-sectors

The post Indian Sectors Round Up and RRG Charts lookup before US Elections Results appeared first on Marketcalls.

What to do When the Panic is Over?

$
0
0

Generally Panic events trigger strong emotional reactions that often results in ending up catching the trade at unfair price zones and makes too much cognitive bias which will not allow a trader to revise their trade decision. Lets analyze what happened on Nifty Futures.

On 10th Nov 2016 SGX Nifty was trading around sub 8200 levels at the pre-open and market opened with the strong tone of bearishness as the global markets are in panic, S&P futures overnight markets crashed, Asian market crashed and when our markets opened, a panic low of 8076 in Nifty Futures is established in the 2nd minute itself post market open with huge surge in Nifty Futures Volume.

Nifty Futures 1min charts

nifty-nov-futures

Did you ever wondered how a strong panic news got digested in the first few minute itself? Why haven’t the bad news is not a bad news anymore? Once you started believing that the bad news is going to bring more panic , more emotional decisions comes into ones mindset. The more we listen to market experts, tv channels , analyst more we subject to cognitive bias and that often lead not to revise your trade decision when panic event occurs.

A cognitive bias refers to a systematic pattern of deviation from norm or rationality in judgment, whereby inferences about other people and situations may be drawn in an illogical fashion. Individuals create their own “subjective social reality” from their perception of the input.Wikipedia

If you are a discretionary trading style practitioner its better not to react post to any panic events. Your Probability of winning on reacting to post such events are more likely to be a very low and vulnerable as well. Instead one should start listening to the market and wait for their trade setups to arrive. Trading the Charts and Trading the Emotions are two different thing and the latter involves faster wealth destruction.

Generally shorter term traders love fast moving markets and a fast moving markets with emotions and cognitive bias makes on to stay wrong when something different happens from a trading opinion or trade decision. Its wise to realize such traders earlier and cut down the trades faster.

Missing one good trade is still fine rather getting caught in a wrong trade and staying wrong! Once the panic is over its a better to revise trade setup otherwise you will be trading something which is often not part of your trade plan.

The post What to do When the Panic is Over? appeared first on Marketcalls.


CNX Metal in a Emotional Buyers Market

$
0
0

Nifty Metal Daily Charts
cnx-metal

If you frequently track gaps in Nifty Metal (Spot) you would understand that there are so far 10 unfaded gaps since the start of March 2016. Current leg of rally is almost 10 months old and during this leg we had hardly made only 5 gap downs, 23 gap ups and 10 unfaded gap ups. which indicates that we are in a emotional buyers market.

Also the Monthly trading sentimental charts are showing extreme readings which indicates that the reversal odds are high.

Nifty Metal Monthly Charts
cnx-metal-monthly

Why does that Matters?

It matters a lot from a short term or medium term investors perspective. An Emotional Buyers market is sort of overbought market where an short term/medium term investor rarely benefit in the given scenario. statistically, the odds of closing the gaps favor a lot. Chasing the trend at current junction might not be a wise decision though.

Previously we had spotted a emotional market behavior in CNX IT and the emotional market behavior in CNX NIFTY. As everyone know that IT sector under performs drastically compared to the benchmark index Nifty 50 and also made a negative returns YTD and CNX Nifty crashed from 8900+ levels to 8000 levels.

In any Emotional Market longer timeframe players are hungry enough to drive the market along with the mad crowd. This is not a healthy situation for a trending market.

The post CNX Metal in a Emotional Buyers Market appeared first on Marketcalls.

Commodities Crashed Post US Presidential Election Results

$
0
0

Commodities markets plunged last Friday along with emerging market sell-off with traders parsing the implications of a Donald Trump presidency for the world’s largest economy.

MCX Gold

MCX Gold surges to a high of Rs31326/Kg when Mr.Donald trump was leading the election results on 9th Nov 2016. Around 10.40p.m gold topped out and from there post the election announcement MCX Gold dropped to a low of Rs29269/Kg on last Friday (Nov 11,2016). The dollar rose to its strongest level since February. Bonds continued to get pounded, with losses exceeding $1 trillion this week.

In the International market gold down -3.32% and plunged from 1260 to 1225 USD and the crash resulted in lowest price since June 2016 as Dec rate hikes were jawboned more likely.

mcx-gold

MCX Silver

MCX Silver also made similar top on Nov 9th around 10.40a.m. Silver topped around Rs44,790/Kg and finally resulted in a Friday crash of -4.5%

mcx-silver

MCX Crude

MCX Crude on the other hand made a bottom on Nov 9th at Rs2,895/barrel around 10.30a.m and since then it is holding on to the lows. It is expected to hold on to the panic low which is made on nov 9th and could be a potential support zone.

mcx-crude

MCX Copper

MCX Copper had done a spectacular move from 310 levels to 405 levels. Since 24th october copper had breached June 2015 and later on the friday evening session copper crashed back to 374 levels with strong price rejection at the 400 levels thereby making a pin bar style setup on the daily charts. At this juncture sellers taken control and very much aggressive post the momentum rally. To be noted Copper is one-timeframing (i.e consecutively making higher high and lower high for the past 10 days).

mcx-copper

MCX Nickel

Momentum Rally in MCX Nickel which started from 673 on 24th Oct ended on last friday session toughed a intraday high of 812 levels before crashing to a intraday low of 744. Madness and momentum is witness in this counter on downside. It is to be noted that previously we had a long term buy view on Nickel with a destination target of 806 and 895.

mcx-nickel

MCX Zinc

MCX Zinc is a solid uptrend since the last 11 months and the fridays exhaustion move from the peak 178 to 168 levels indicate a potential trend reversal. Sellers are taking control and currently they are very much aggressive in driving the price down.
mcx-zinc

The post Commodities Crashed Post US Presidential Election Results appeared first on Marketcalls.

Impact of Demonetization on Rs 500 and Rs 1000 currency notes

$
0
0

Though Governments demonetization is a welcoming move to remove black money, fake currency, corruption and terror financing from the system, it is a bit early to make any accurate predictions on the full impact of government’s attempt to demonetize Rs.500 and Rs.1,000 currency notes . Demonetization is good for the medium to long term economy, however it will adversely impact India’s economic growth in the short run.

Also the cash conversion limit of Rs4000/day and ATM withdrawal of Rs2000/day would introduce short term cash crunch among the general public and could slow down the consumer spending drastically.Now more people will move towards non-cash options like credit / debit cards and online payments.

demonetization

The post Impact of Demonetization on Rs 500 and Rs 1000 currency notes appeared first on Marketcalls.

Divergence 2017 – Traders Annual Web Conference

$
0
0

 Asia’s Biggest and intensive ever traders online conference   Access to Webinar from Expert Traders, Daily Market Commentary, Live Trading Room Setup, Live Trading Journal, Recorded Webinar and more!    A Platform where quality traders, expert speakers, mentors share their observation and thoughts about markets!  Learn new trading skill set by participating anywhere from the world. Its high-time to upgrade your trading skillset!  


Divergence 2017 – Traders Annual Web Conference

//www.youtube.com/watch?v=ayHCRTOrViU

Register for Divergence 2017

Expert Traders & Mentors


divergence-2017

Key Takeaways

YOU CAN GET HIGH QUALITY  PERSONAL MENTORING  , GUIDANCE, AND
  LEARNING EXPERIENCE   FROM QUALITY TRADERS


6 elite trading experts, hands-on education, and timely strategies and trade
ideas for every market, sector, and financial instrument, makes this a trading
 

event unlike any other!– Access to 30+ Webinars from 10 expert traders & mentors (gotowebinar)
– 1 Year of Access to Recorded Webinars (Marketcalls Portal)
– 1 month of Access to Live Trading Journal (Slack Chat group)
– 1 month of Access to Live Trading Room Setup (gotowebinar)
– 1 month of Access to Live Daily Market Commentary before the market opens (gotowebinar)
– Offers from Our Event Sponsors

The post Divergence 2017 – Traders Annual Web Conference appeared first on Marketcalls.

A Quick Start Guide to Compute Correlation Matrix in Python using NSEpy & Pandas

$
0
0

Here is a quick tutorial in python to compute Correlation Matrix between multiple stock instruments using python packages like NSEpy & Pandas. Generally Correlation Coefficient is a statistical measure that reflects the correlation between two stocks/financial instruments. Determining the relationship between two securities is useful for analyzing intermarket relationships, sector/stock relationships and sector/market relationships.

stock-correlation-heatmap

Here are some of the essential python libraries required for Correlation Matrix Data Visualization

IPython (Interactive Python)
Pandas (Python Library to handle time series data )
NSEpy (Fetch Historical data from NSEindia – NSEpy 0.3 ver or higher)
Matplotlib (Python library to handle 2D plotting)

Import the required python modules

i)from nsepy.archives we need to import the get_price_history:-for fetching the stock pricing details
ii) from datetime import we need to import date object :- for giving the date limit for the required stocks
iii) import pandas :- for the creation of dataframe
iv)import matplotlib for plotting the correlation heatmap

Create a list of stocks

Fetch Historical Data
Now fetch the price history of each stocks based on a specific time limit and appending the last close value into an empty pandas dataframe

Compute and Plot Correlation Matrix
Now compute the percentage change and Pearson correlation using the pandas dataframe functions pct_change() , corr() and plot the correlation matrix using
matplotlib as shown below.

Note : %pylab inline is used as a display variable on ipython notebook.

Sample IPython Notebook to generate Stock Correlation Matrix Map as shown below :

The post A Quick Start Guide to Compute Correlation Matrix in Python using NSEpy & Pandas appeared first on Marketcalls.

Reduce your Transaction Cost using Synthetic Long/Short Future

$
0
0

If you are a professional future trader in the markets then transaction cost plays a major role while trading. Lower the transaction cost translates to better returns and also reduces the risk to greater extent in the long run. By constructing a Synthetic Futures (Long/Short) we can reduce the total transaction cost by two-third of the actual instead of trading the futures.

Synthetic Longs/Short future is nothing but artificially replicate a long/short futures pay off using same expiry options. Synthetic Long Futures is constructed by using Buying 1 At the money call and Selling 1 At the money put of same strike price . Similarly Synthetic Short Futures is constructed by using Buying 1 At the money put and Selling 1 At the money call of same strike price

Synthetic Long Futures = Buy 1 ATM Call + Sell 1 ATM Put
Synthetic Short Futures = Buy 1 ATM Put + Sell 1 ATM Call

Lets Assume that Mr Ravi is a professional trader on an average he trades 10 lots of nifty futures in a day and he trades with a discount broking firm at Rs20/Order. If Nifty is trading at 8100 then his average transaction cost (including Brokerage + Govt Charges) comes around Rs957/- per buy and sell transaction. Total Transaction Cost is shown below.

Long Futures – Transaction cost
futures-brokerage

Now lets construct a Synthetic Long Futures using 8100CE ATM Call Longs and Shorting 8100PE ATM Put Short (November Series) as shown below

synthetic-futures

Payoff Graph for Synthetic Long Futures is shown below.

payoff

In case of Synthetic Futures both the leg transaction cost come down to Rs 315/-. Ravi would have saved Rs642/ instead of trading futures which directly translates to two-third of brokerage savings. In a year if you assume there are 250 trading sessions then probably he would save 642 x 250 = Rs1,60,500/- annually (approx figures) which makes a huge difference in his trading system returns and thereby improved ROI.

Synthetic Futures – Transaction cost
synthetic-brokerage

Note : Synthetic Future is recommended to be used only for Nifty/Bank Nifty Trading because of high liquidity and lower impact cost

The post Reduce your Transaction Cost using Synthetic Long/Short Future appeared first on Marketcalls.

Interpreting Options Price and Open Interest Relationship

$
0
0

We know that Open Interest is nothing but the total number of outstanding contracts. And for Options we have Open Interest for every individual strike price. It is a myth that 90% of the option expire worthless. Textbooks, Internet & even most of the option experts preach that option writing is smarter than buying options . But is that true? However check out the real facts from Chicago Board Options Exchange (CBOE).

  • 10% of option contracts are exercised
  • 55%-60% of option contracts are squared off  prior to expiration
  • 30%-35% of option contracts expire worthless (out-of-the-money with no intrinsic value)

What is the Relationship Between Option Price and Open Interest

Below is the simple strike wise options interpretation from optionaction about the days option price change and Change in open interest compared to the previous day option price and open interest. This simple interpretation helps one to understand and get a bird eye view of whats happening across the strike price. Generally it tracks whether at a particular strike price Long buildup/Short Buildup/Short covering/Long Liquidation is happening.

For Example on 18th Nov 2016 most of the ATM calls and ATM Puts premium (Option Price Value) declined despite the underlying nifty spot price closed flat (Nifty was down by 5 points) and November expiry is nearby and almost 4 more trading days to go. If you notice that price value is going down however open interest is getting increased that indicates that option sellers are in control in both ATM/near to ATM calls & ATM puts option strikes.


options-open-interest-relationship

Here is the generalized table which list out the relationship between  Change in Option Price and Change in Open Interest

Change in Option PriceChange in Open InterestInterpretation
PositivePositiveLong Buildup
NegativePositiveShort Buildup
PositiveNegativeLong Liquidation
NegativeNegativeShort Liquidation

Note that for Every option buyers there is a option seller whenever the open interest count increases by 1. The above relationship only tracks which participants are more aggressive on that given day.

Steps to Get Open Interest Relationship in Option Action

1)Download Option Action

2)Register and Login to Option Action

3)Goto Option Chain Tab -> Enter the required Symbol and press update

4)Bingo! You are done.

Advantages of Interpreting Open Interest

1)Understand the dynamics of options marketplace
2)Track the behavior of participants before any major events, pre/post earnings announcements
3)Re-Adjust or Revise your trading strategy according to what is happening in the market
4)Bird Eye view about the market dynamics.

The post Interpreting Options Price and Open Interest Relationship appeared first on Marketcalls.


Bank Nifty Futures November Trend Overview

$
0
0

Bank Nifty Weekly Charts
bank-nifty-weekly

Too much of consolidation in Bank Nifty Futures weekly charts indicates the age of the trend is getting too old. Old trend doesn’t mean that it will be come an end but from the investing stand point it many not be worth taking a risky investment bet especially if you are a medium term investor.

Trading Longs in Bank Nifty are Absolutely Fine from Day trading or Short term trading perspective. In case if you have plans to trade the long side one has to reduce their position size. Strong price acceptance below 19000 and fail to bounce from here could be a change in trend reversal.

Bank Nifty Market Profile Charts

Bank Nifty Futures charts are one timeframing for the last 5 trading sessions and mid day sell-off is observed in last three trading sessions. Whereas on the friday trading session post the selloff, Point of control haven’t migrated lower though price migrated which indicates that short sellers are ending up catching lower prices below the value area and high possibilities of ending up trapped in the upcoming trading sessions.

low-confidence-selloff

Also three Rally high in a row indicates that short term short sellers inventory is getting from short to too short which indicates a possible short trend reversal towards 19200-19300 zone can be anticipated.

The post Bank Nifty Futures November Trend Overview appeared first on Marketcalls.

Why should you invest through Systematic Investment Plans (SIPs)?

$
0
0

systematic-investment-plan-sip

Everybody wants to become rich without taking a risk or incurring a loss. This is the human nature, and this is also the reason behind the popularity of systematic investment plans or SIPs which allow investing a specific amount at regular intervals of time in a systematic manner. Let’s have a look at some of the reasons behind investing through SIPs:


  1. It is a hassle-free option: It is possible to start SIPs online with a click of the mouse. Also, investors can review and update portfolios online and take corrective actions, if required. Further, to pay the SIP amount, you can issue a one-time standing instruction to your bank to facilitate auto-debits from your account. In this way, you don’t need to worry about missing out on the due date of your investment. Furthermore, you don’t need a huge corpus to get started as SIPs can be started with an amount as low as Rs 500- Rs 100/month.
  2. It minimizes the risk of equity fluctuations with rupee cost averaging: As you are a regular investor, your money fetches more units when the price is low and lesser units when the price is high. During volatility, you can get a lower average cost per unit. It evens out the market volatility if one is investing for a long duration.  Those people who don’t understand the market, SIP is a good option. There is always a chance that one stays out when the market is growing or enters when it is underperforming. However, SIPs take care of this concern. As you are investing regularly; you don’t need to ‘time’ your entry into the market, and you can easily ride through the ups and downs of equities with great ease.
  1. It gives the benefits of compounding: The power of compounding works magic over time, therefore, the sooner you start investing, the more your money grow. Even a delay of a few years can have a major impact on the wealth accumulated in the long run. For instance, if you start investing Rs 5000/month on your 30th birthday, you would have Rs 1.08 crores by the time you retire at 60, considering 10% rate of returns. However, if you start your investment at the age of 35, you would have Rs 64.90 lakhs, considering 10% rate of returns. Also, in the long-run, you can enjoy benefits from the power of compounding as one earns interest on the accumulated interest also.
  2. It makes you a disciplined investor: While investing, it is important to maintain a disciplined approach. However, maintaining discipline is easier said than done because many new expenses come unannounced in the way. Taking the SIP route is one step taken towards becoming a disciplined investor. As you have to invest a fixed amount periodically, you develop the habit of saving over a period. As a result, when you invest through SIP, you become more disciplined and committed towards your investment.
  3. It is flexible: While it is strongly recommended to stay invested for a longer duration of time, you can discontinue the plan as per your choice. Further, if there is an additional source of income or you want to increase your SIP amount, the same can be done by just requesting the fund house.
  4. It gives tax benefits: Your SIP investments in equity-linked saving schemes are eligible for tax benefits under Section 80C of the Income Tax Act. Further death benefits received by your nominee or maturity proceedings paid to you at the time of maturity are also tax-free.

To enjoy the above benefits, choose the right investment avenue and start investing in it through SIP which gives returns higher than the inflation rate.

The post Why should you invest through Systematic Investment Plans (SIPs)? appeared first on Marketcalls.

Trading Around the Psychological Round Numbers

$
0
0

Trading around the Psychological round numbers like 7000, 8000, 9000 are never been a easier task mentally. This is where many trading participants come up with weird forecasting stuff and this is the zone where frequent stop hunting happens and it is the process of removing weaker hands before market does its next move.

Nifty Futures 5min Charts

psycological-round-numbers

Weird Forecasting Around Round Numbers

For many people those who watches just the price or price based indicators try to defend round numbers as psychological support/resistance zone. This is where most of the players go wrong when markets constantly whipsawing around the psychological reference.

Totally it is a frustration game to trade around psychological reference zone. For Example any price dip below 8000 will invite dumb forecasting levels like 7500, 7200, 6800 kind of prediction and recovery above 8000 will again build assumptions like “Nifty Bottomed out” kind of stories and make players to place stops around 8000 – round number levels.

Frustration Game Around Round Numbers

A constant whipsaw around the psychological reference zone kills the patience of the players as the short term dips are sharp and the recoveries are even sharper. However this ongoing whipsaws for some time make players to loose faith in their market prediction levels. After a long frustration when the real rally occurs that brings even more discomforts among the participants, disbelief about the rally and that makes them to come and trade exactly against the trend.

Whenever market nears the psychological reference and if there is a constant whipsaw around the reference then one should recognize the game much better than the others thereby better focus on your charts, re-strategize and eliminating un-necessary mental strain.

The post Trading Around the Psychological Round Numbers appeared first on Marketcalls.

Nimble Mobile – Charting and Streaming Mobile App for Android and IOS Devices

$
0
0

Here is a light weight and userfriendly mobile app for traders , active investors & jewellers who wants to track markets on the go. Nimble Mobile App is realtime streaming and charting app for NSE, NSE FNO, NSE Currency & MCX markets from globaldatafeeds (authentic data vendor for NSE, NSE FNO, NSE FX, MCX). Currently app is available for Android and IOS devices. Access if completely free for active Globaldatafeeds users and limited trial is available for non globaldatafeed users.

nimblemobile

Chart Streaming is really fast and designed to work even with with low bandwidth 2G connectivity. Charting comes with a pre packed 80+ custom indicators and ability to draw studies over the charts.

App Features

1. Streaming, tick by tick data of NSE, NFO, CDS and MCX with low latency
2. Unlimited Symbols
3. Realtime data in MarketWatch, Mini Charts and Detailed Charts
5. Ready-made and Custom Watchlists
6. Compact and Detailed MarketWatch
7. 2 Color Themes (Dark or Light)

nimble-mobile-1 nimble-mobile-2 nimble-mobile-3

Charting Features :
A. 7 price styles (CandleStick, Bar, Line, Hollow Candlestick, Haikin Ashi, Kagi, Line Break),
B. 6 predefined timeframes (1,5,15,30,60 minutes and Daily)
C. 80+ indicators with full indicator customization,
D. 20+ Drawings
E. Drawings include all Fibonacci drawings like Retracements, Fan, Extensions, Circle, Timezone and Ellipse
F. Data window
G. Chart data with indicator settings is retained between different symbols and sessions for users convenience
H. Bandwidth Saver – Chart data is cached. Only incremental data is downloaded from server resulting in lower bandwidth

So what are you waiting for ? Download the App now. you can search ‘NimbleMobile’ on Google Play Store and give it a try.

apple-itunes-store google-play

The post Nimble Mobile – Charting and Streaming Mobile App for Android and IOS Devices appeared first on Marketcalls.

Silver Sentiment Looks Golden

$
0
0

silver-sentiment

Bullish sentiment among silver traders recently fell to 8 percent, the lowest reading since mid-2015. So, sentiment is in the right place for the next big leg in the price pattern.


FREE 12-Minute Video from Bob Prechter: Learn What REALLY Moves the Markets

In just 12 minutes, EWI’s founder, Bob Prechter, shows you eye-opening evidence proving that factors like interest rates, war or peace, oil prices, etc. do not impact stock prices.

Watch your free video, now

This article was syndicated by Elliott Wave International and was originally published under the headline Silver Sentiment Looks Golden. EWI is the world’s largest market forecasting firm. Its staff of full-time analysts led by Chartered Market Technician Robert Prechter provides 24-hour-a-day market analysis to institutional and private investors around the world.

The post Silver Sentiment Looks Golden appeared first on Marketcalls.

Viewing all 2070 articles
Browse latest View live