Quantcast
Channel: Market Calls
Viewing all 2070 articles
Browse latest View live

Prediction Cycle Plugin for Amibroker

$
0
0

Nifty Futures EOD chart – Prediction Cycle

Nifty Prediction Cycle

Prediction Cycle Plugin is a simple and free plugin for amibroker which separates the underlying cycle component from the price and helps you understand the ongoing cycle. Gives a better perspective about the cycles happening the larger timeframes (Daily, Weekly,Monthly) and thereby better decision making.

Indications are provided to understand the phase of cycle. Green Arrow indicates start of positive cycle phase and the red Arrow Indicates start of negative cycle phase.

Bank Nifty Futures EOD chart – Prediction Cycle
Bank Nifty futures

Installation Steps
1)Download Predict Cycle Plugin for Amibroker to your local machine and unzip it
2)Copy PredictCycle.dll plugin to Amibroker\plugins\ folder
3)Copy PredictCycle.afl code to Amibroker\formulas\basic charts\ folder
4)Now open the blank charts and apply PredictCycle.afl code. Change the default Period Settings to 7
5)You are done!

Note : Predict Cycle Plugin is currently available only for 32bit- Amibroker Version.

Predict Cycle Amibroker AFL Code

The post Prediction Cycle Plugin for Amibroker appeared first on Marketcalls.


How BRExit had done damage to major World Indices

$
0
0

Before stepping into Monday its better prepare yourself to face the music of volatility in the markets. Last Friday the outcome of BRExit vote on leaving the European union had made a huge shock wave across major financial markets including Stocks, commodities and currency markets. And Fridays price action had done a major structural damage on the time series charts.

SNP 500 EOD Charts
SPX 500

Dowjones EOD Charts
Dow Jones

CBOE VIX EOD Charts
India VIX

FTSE EOD Charts
FTSE

DAX EOD Charts
DAX

CAC EOD Charts
CAC

NIFTY EOD Charts
Nifty

BANKNIFTY EOD Charts
BANKNIFTY

HANG SENG EOD Charts
Hang Seng

NIKKEI Charts
Nikkei

WTI CRUDE EOD Charts
CRUDE

GOLD EOD Charts
GOLD

GBPINR EOD Charts
GBPINR

USDINR EOD Charts
EURUSD

The post How BRExit had done damage to major World Indices appeared first on Marketcalls.

Reviewing the Basics of the Elliott Wave Principle: The Triangle

$
0
0

Elliot Wave

Reviewing the Basics of the Elliott Wave Principle: The Triangle
Free Lesson from Jeffrey Kennedy’s Trader’s Classroom

By Elliott Wave International

The Wave Principle classifies price action as either motive or corrective. Corrective waves move opposite the direction of the primary trend and include the zigzag, flat, triangle and combinations of these patterns. They offer traders an opportunity to rejoin the larger trend. Today, you can watch a lesson from Jeffrey Kennedy’s Trader’s Classroom in which he teaches you the basics of the triangle, a sideways correction, and shows an example in the chart of Pfizer, Inc. (PFE).


10 Lessons that Will Change the Way You Invest Forever

Get your free Elliott Wave Tutorial now to learn the Elliott Wave Principle and how to apply it to your charts to improve your investing and trading. Take the entire online course, which is based on Frost & Prechter’s classic text, Elliott Wave Principle: Key to Market Behavior.

Start your free tutorial now

This article was syndicated by Elliott Wave International and was originally published under the headline Reviewing the Basics of the Elliott Wave Principle: The Triangle. EWI is the world’s largest market forecasting firm. Its staff of full-time analysts led by Chartered Market Technician Robert Prechter provides 24-hour-a-day market analysis to institutional and private investors around the world.

The post Reviewing the Basics of the Elliott Wave Principle: The Triangle appeared first on Marketcalls.

USDJPY Trend Analysis – July Overview

$
0
0

USDJPY Monthly Charts
USDJPY Monthly

USDJPY Monthly charts are in declining mode for the last 9 months and consecutively keep on making lower lows and lower highs. And from the 2015 high USDJPY had last around ~20% since the negative interest rate announcement came on January 29. And currently trading around above the psychological support zone of 100 levels. CM William VIX FIX levels indicates a possible oversold levels.

USDJPY Weekly Charts

USDJPY Weekly

USDJPY on the weekly charts are in consolidation phase post the BRExit panic moment. And currently wavering around 100-103 zone. Expecting few more consolidation daily ahead of any possible trend reversal.

USDJPY Daily Charts
USDJPY Daily

USDJPY Daily charts are currently in the downtrending mode continuously trending down for last 5 consecutive days but still above the 100 psychological support zone. Sentiment is still negative on the downside and expected to whipsaw the support zone 100 couple of times before any major trend reversal happens. On the trend reversal front once the consolidation phase is over we are expecting USDJPY to trade above 106 zone as shown in the weekly charts.

The post USDJPY Trend Analysis – July Overview appeared first on Marketcalls.

Nickel Long Term Cycle Analysis

$
0
0

Nickel Monthly Timeframe
Nickel

Is the long term trend in Nickel Started? To answer this question we can start with monthly nickel charts with predict cycle indicator. You can notice from the MCX nickel monthly charts that Predict cycle had turned positive – we are possibly in the long term uptrend. After 8 months of consolidation on the larger timeframe Nickel is currently trading above 8 month high.

Nickel Weekly Timeframe
Weekly Nickel Charts

On the weekly timeframe Predict Cycle is up for the last 4 weeks (Intermediate trend is up for last 1 month) and also trading above the previous consolidation zone. For the longer term and medium term trend to be intact Nickel maintaining above 630 zone is critical for the cycle to put the price in the next orbital zone 806 and 895.

Nickel Daily Timeframe
Nickel Daily

On the Daily timeframe Predict cycle is up for the last 1 month. Potential we could enter into a period of consolidation for few days or even minor corrections before further trend reversal to happen on the upper side.

The post Nickel Long Term Cycle Analysis appeared first on Marketcalls.

Market Profile Bangalore Workshop

$
0
0

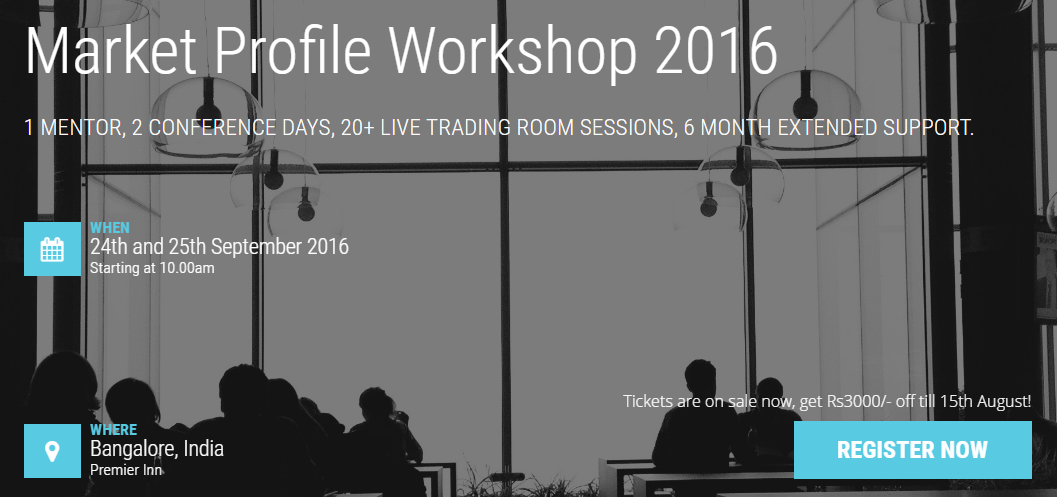
Market Profile Workshop (MP 2016) is a rigorous training program for traders, providing you with the clarity of thought for your trading journey through live lectures, case studies, assignments, guidance, feedback and insights.

Market Profile Workshop

Why this Course

Markets are complex to understand. We teach how to understand markets in a better way, will bring thinking ability in you to trade independently in dynamic complex trading environments. The Program will provide the right framework and concepts to equip you with clarity for your trading journey

Venue : Premier Inn, ,ITPL Main Road Seetharampalya,Whitefield, Bengaluru, Karnataka, India

Date : 24th and 25th, Sep 2016

Contact : 09738383344 (Mon – Sat 9a.m -6p.m)

About the Mentor

Rajandran is a Full time trader and founder of Marketcalls, hugely interested in building timing models, algos , discretionary trading concepts and Trading Sentimental analysis. He now instructs users all over the world, from experienced traders ,professional traders to individual traders.

Rajandran attended college in the Chennai where he earned a BE in Electronics and Communications. Rajandran has a broad understanding of trading softwares like Amibroker, Ninjatrader, Esignal, Metastock, Motivewave, Market Analyst(Optuma), Metatrader, Tradingivew,Python and understands individual needs of traders and investors utilizing a wide range of methodologies.

About the Mentor

Agenda

click here to view the agenda

Topics Covered

Day 1 – Morning Session

Why to trade using Market Profile.

Introduction to Auction Market Theory.

Understanding two way auction process.

Basic Building Blocks of Market Profile.

Understanding Market Participants.

Measuring Trading Participants confidence level.

Understanding Who is in control.

Trading Price Vs Trading Value

Market Profile and Market Internals.

Day 1 – Afternoon Session

Setting up Market Profile Charts for various instruments

Learn to do analyze stocks using Top Down Approach

How to Measure the Age of the Trend

Understanding Excess and Balance

Understanding POC and Value area concepts

Understanding Profile Structure, Subtle and Nuances

Understanding Key Reference Levels and its Significance

Day 2 – Morning Session

Composite Profile and Profile Settings

How to Identify intraday and positional trading setups

Trading Options using Market Profile

Market Profile Case studies

Introduction to Order flow Analysis

Day 2 – Afternoon Session

Why Sentimental Analysis in Trading.

Gathering and Evaluating the Crowd Sentiment.

How to trade Extreme Sentimental Factors.

Understand the Mindset of Emotional traders

How and When to Trade Against crowd sentiment

Best Trading Practices and Market Profile Trading Principles

Trading Room and Daily Market Commentary

Daily Market Commentary (Online – Gotowebinar)

Date : Oct 3rd – Oct 28th,2016 (All Market Days)

Timings : 8.30a.m – 9.00a.m

Market Profile Trading Room (Online – Gotowebinar)

Date : Oct 3rd – Oct 28th,2016 (All Market Days)

Timings : 9.15a.m – 4p.m


Key Takeaways

6 months access to Recorded Webinars (Marketcalls Portal)

1 month access to Live Trading Journal (Slack Chat group)

1 month access to Live Trading Room Setup (gotowebinar)

1 month access to Live Daily Market Commentary on market days 8.30a.m-9.00a.m (gotowebinar)

Access to our previous mentorship video archives. (100+ hours)

Live Case Studies, Personalized feedback

Network with like minded traders

Who Should Attend

-Anyone who is passionate to learn and trade in complex market environments.

-Aspiring full time traders/active investors

-Willing to have a flexible trading mindset.

Requirements

-Laptop with 3G/4G dongle

-Ninjatrader 7 installed

-Understanding about Futures and Options Concepts

-Min 1 Year of Trading Experience in Futures and Option Markets

The post Market Profile Bangalore Workshop appeared first on Marketcalls.

Will Nifty hit 9000 this August 2016?

$
0
0

Nifty View

Nifty Spot is currently trading around 8636 levels and so far nifty had traveled roughly 1800 points from Feb 2016 low of 6825. Intermediate Resistance is coming around 8635 and one can expect some consolidation around this zone for some times. Price could travel back and forth around this zone and could still remains in the range between 8450-8700 for the first week. However strong price push and close above 8700 suggests that we are more likely to test 9000 back again for this series.

Since FEB 2016 momentum traders are coming and buying every break which indicates that they could continue doing this for some more time. India VIX is just above 15 handle indicating that lower volatility in the markets where the fear is totally out of the market.

Open Interest Range

Open Interest Suggest that Expiry range is anywhere between 8500-9000. So far call writers are showing interest in writing 9000CE and put writers at 8500PE strike prices. However the numbers are so dynamic and could change with respect to time.

OI Range

Trend following longs in futures is one of the preferred strategy for this month.

The post Will Nifty hit 9000 this August 2016? appeared first on Marketcalls.

Now Access Gap Identifier Charts at Marketcalls

$
0
0

Gaps are always interesting reference when comes to discrete trading. Some gaps gets faded faster whereas some gaps take its own time to fade. Gaps represents emotions in the market and tracking gaps are critical for any futures trader. So we thought of making things easier for traders where you can track the unfaded gaps on the go.

Nifty Futures Gap Identifier – EOD Charts
Gap

If you are not sure how to use the gaps then the following tutorial will help you understand gaps in a better way.
Trading the Gap Up and Gap Down – Part 1
Trading the Gap Up and Gap Down – Part 2
Trading the Gap Up and Gap Down – Part 3

How the Read the Gap Identifier Charts
1)Gaps are represented with yellow color bars as shown above
2)We track only the gap with open above/below previous days high-low range
3)Unfaded Gaps (Gap High and Gap Low) are plotted over the charts with extended lines
4)Just with a visual look over the charts now one can access the unfaded gaps
5)Dotted blue color lines represents unfaded gap top and dotted red color lines represents unfaded gap bottom

For Example the above nifty future charts has unfaded gaps at the following zones
1) 8353-8422
2) 8214-8238
3) 7769-7802
4) 7240-7302
5) 6520-6532
6) 6436-6439
7) 5475-5545

The post Now Access Gap Identifier Charts at Marketcalls appeared first on Marketcalls.


RRG Study : World Indices and Indian Sectors Aug 2016 Outlook

$
0
0

Relative Study with respect to S&P 500 index
RRG World Market

Above charts shows the RRG charts of world indices w.r.t SPX 500. It is observed that Sensex is relatively having momentum build up and likely to enter from improving quadrant to leading quadrant which indicates possible out performance compared to the benchmark index S&P 500. Rest of the other markets relatively pose a falling momentum. Brazil Bovespa this week moved into the weakening quadrant indicating the possibilities of under performance. Shangai SSEC showing under performance so far with stable momentum.

Relative Study with respect to NIFTY 50 index
RRG Sector Update

Lets discuss about RRG charts of Indian Sectors w.r.t NIFTY 50. Increasing momentum observed in Nifty Realty, Nifty IT, Nifty Media & Nifty FMCG and outperforming Nifty 50 index as well whereas falling momentum in Nifty Metal, Bank Nifty CNX Energy, CNX Pharma & CNX PSU Bank.

CNX Auto, CNX Infra, CNX MNC are currently building momentum and also in the leading quadrant indicating short term out performance.

RRG Sector Update 2nd chart

The post RRG Study : World Indices and Indian Sectors Aug 2016 Outlook appeared first on Marketcalls.

Is MCX Zinc on the Verge of Short Term Reversal?

$
0
0

MCX Zinc had done a tremendous run so far in 2016. Bottomed out on 12th Jan 2016 and till to date moved from 96.65 to 153.35. i.e almost 58.66% gain over a span of 8 months. It is also nearing the long term reference zone 154.35 (May 2015). Till to date MCX Zinc had made 8 month of consecutive higher high and higher low.

MCX Zinc

It is almost a “V”-Shaped recovery from the May 2015 crash in Zinc Futures. Post the mid of July 2016, momentum in zinc had came down drastically. When the momentum declines buyers started getting frustrated with their long holdings. And when market conditions are not favoring those buyers naturally they turn to sell their contracts and there by triggering shorter term selling.

MCX Zinc – Rate of Change slowing down
ZINC ROC

The shorter term outlook is bearish and expected to trade in the range of 145-154 zone. Short only trend following is a preferred trading strategy to trade Zinc futures.

The post Is MCX Zinc on the Verge of Short Term Reversal? appeared first on Marketcalls.

NIFTY IT from Underperformance to Deep Underperformance?

$
0
0

CNX IT

In the last 3-4 months NIFTY IT index is a significant underperfomer with respect to nifty. We also had a overvalued rating in NIFTY IT due to the nature of open gaps in the index.

NIFTY IT RRG

NIFTY IT is currently in the consolidation phase between 10750-11800. RRG Charts suggests short term out-performance could continue for some time as NIFTY IT sector is currently falling under the leading quadrant. However momentum is falling down and preferred to short at rallys especially during the RRG chart from leading to weakening quadrant transition phase.

And the current consolidation phase indicates that the trend is tired and sooner or later it would correct towards 9254 in the medium term. And we expect NIFTY IT index to deeply underperform NIFTY 50.

The post NIFTY IT from Underperformance to Deep Underperformance? appeared first on Marketcalls.

Nifty Futures Trend Update for Aug 2016

$
0
0

NIFTY

Current Uptrend is almost 7 months old and you can see from the chart though market had done almost 1800+ points since Feb 2016 majority of the times markets are in consolidation phase as indicates. Too much consolidation indicates that trend is aging. Aging doesn’t mean that we are going to see a reversal. One need to understand that what phase of market we are in to take relevant trading decisions.

Aging trend indicates that trading longs has to be executed in a controlled fashion with better risk management. Also the current Jurik RSX sentiment is positive indicating that shorter term index view remains positive.

Intemediate Reference zone (Jun 2015 High) – 8667 has been continually whipsawed in the current series and so far we are in the consolidation zone 8500-8700.Breakout above 8700 could push us to the new territory possibly around 9000 zone. Where selling pressure is expected from the shorter timeframe traders

The post Nifty Futures Trend Update for Aug 2016 appeared first on Marketcalls.

Learn to Trade Any Markets Using Market Profile

$
0
0

Here are the collection of tutorials which help you to kickstart, understand the basic building blocks, improves your understanding about Market Profile and helps you to organize the market generated information in a better way than any other trader.

How to Read a Market Profile Chart?

Market Profile is not a trading system but a market generated information and a decision supportive system along with your existing trading systems. It provides you knowledge about who is in control in the market (Long Term Players, Short Term Players, Day Traders), directional conviction. Market Profile gives an idea to a day trader about where to take a trade and which trend to play for the day based on trend conviction

Market Profile - Nifty

Market Profile : Balanced and Imbalanced Markets

In this section we will cover different types of markets (Balanced Markets and Imbalanced Markets) and provide a fair idea when such days occur and who is in control for the day.

Market Profile : Different Types of Profile Days
In this tutorial we will be discussing about the different types of Market Profile Days. By analyzing the shape of profile one can easily identify who is in control in the market and the conviction among market participant.

How to Play 80 Percentage Rule
Market Profile – 80% rule which was first mentioned in The Profile Reports (Dalton Capital Management 1987 – 1991). It says if the market opens either above or below the value area and test the value area high/low within 2 consecutive 30 minutes

Market Profile Open Type and Confidence

Reading the profile right from the market day open gives more confidence to a day trader towards trade conviction. The confidence level of the Other timeframe trader (Long Term or Positonal trader) can be analysed through market opening.

Market Profile – Spike and Spike Rules

By observing Spike action in market and the next days follow through price action one can determine whether the previous days spike action is false move to confuse the traders or it is going to create a sustainable trend towards the spike direction.

Market Profile – Failed Auction

Failed Auction is a Market Profile Pattern brought to the world by Ray Barros of Trading Sucess. Failed Auction provides trader a great oppurtunity to trade with dynamic mindset and constructing his/her trading rules accordingly

Poor High and Poor Low Market Profile Structure Explained

Poor low and Poor High are market profile structure which generally indicates a market that is too long or too short and the shorter timeframe players in the market has low confidence about the current market direction

Market Profile – Excess (End of Auction)
Excess generally indicates end of auction and the start of another. Generally Excess is seen in the extremes of the profile with strong pullback as shown below. Excess occurs across various timeframes (Hourly, Daily, Weekly Charts)

The post Learn to Trade Any Markets Using Market Profile appeared first on Marketcalls.

Floor Traders and Hand Signals

$
0
0

During the non-electronic market era more than 10,000 people traded on the floors(US Markets). Later then electronic trading emerged and that made the floor traders to transform and adopt slowly to the Electronic Markets (Computer Based Trading).

equities-trading-floor

Open outcry is the name of a method of communication between professionals on a stock exchange or futures exchange typically on a trading floor. It involves shouting and the use of hand signals to transfer information primarily about buy and sell orders. The part of the trading floor where this takes place is called a pit.- Wikipedia
On the trading floor the buyers and sellers use hand signals to communicate Buy and Sell Futures & Option, to communicate quantity to buy and at what price to buy/sell in a open cry environment. The signals let traders and other floor employees know how much is being bid and asked, how many contracts are at stake, what the expiration months are, the types of orders and the status of the orders.

Hand signals are first adopted by Chicago Mercantile Exchange in the early 1970’s. Hand signals are better and faster than a verbal communication in a noisy trading floor environment. It also provides anonymity to big traders and also traders believed that this methodology is less prone to manipulation. Even though it looks chaotic to people, it’s actually very crystal clear what was going on to the people down on the floor.

Here is a simple video tutorial from CNN about how to use Hand Signals for Buy and Sell Transaction

//www.youtube.com/watch?v=M6mWd3EjtsQ

Floored – Documentary on Floor Traders

This Floored Documentary talks lot about the open outcry and how professional traders behave in the floors and how they taken advantage of the public outcry. As the floor trading era is over, many traders find difficult to adapt to computer based trading and even the floor traders feared of Computer based algorithms eating their edge.

//www.youtube.com/watch?v=Njoq3HDYwj0

It is a must watch video for any professional trader not only to understand the hand signals but also to understand how the public outcry functions.

The post Floor Traders and Hand Signals appeared first on Marketcalls.

How to Quickly Spot Common Fibonacci Ratios on a Chart

$
0
0

Each Elliott wave pattern has its own common Fibonacci relationships between waves. You can use them to set your price targets and determine where the trend should reverse.

In other words, Fibonacci ratios are excellent tools to help you decide where to enter and exit your trades.

Learn more in this clip from Jeffrey Kennedy’s service for aspiring traders, Trader’s Classroom.

Note: To watch the complete lesson — and more lessons like this, free — be sure to join Jeffrey for “The 4 Best Waves to Trade — and How to Trade Them,” a free week-long event filled with lessons that will help you recognize and act on trade setups in your charts.

Register today, free!


Learn “The 4 Best Elliott Waves to Trade — and How to Trade Them” — FREE.

Join Trader’s Classroom editor Jeffrey Kennedy August 17 – 23 for free daily video lessons that will teach you to find — and act on — trade setups in your own charts. Learn which waves offer the best trade setups, how to set price target with Fibonacci and more.

Register now, free — get instant access

This article was syndicated by Elliott Wave International and was originally published under the headline How to Quickly Spot Common Fibonacci Ratios on a Chart. EWI is the world’s largest market forecasting firm. Its staff of full-time analysts led by Chartered Market Technician Robert Prechter provides 24-hour-a-day market analysis to institutional and private investors around the world.

Elliot Wave Fibonacci Basics

The post How to Quickly Spot Common Fibonacci Ratios on a Chart appeared first on Marketcalls.


USDJPY Trend Analysis – Aug Overview

$
0
0

USDJPY Weekly Charts
USDJPY Weekly

In our previous analysis on USDJPY (Jul Overview) we expected USDJPY to trade at 106 and that came really fast. And this post is the follow up of previous overview.

USDJPY is in the downtrend for the last 10 months. Overall Volatility and downtrend momentum weakened in the last 4 weeks with the sideways movement in USDJPY. The Psychological trading zone – Pairs parity 100 got whipsawed couple of times followed by a minor pullback last week. As the panic in USDJPY is fading away one can expect USDJPY to continue in the large consolidation zone and expecting to test 108 in the medium term.

USDJPY Daily Charts
USDJPY

The post USDJPY Trend Analysis – Aug Overview appeared first on Marketcalls.

Nifty Futures September 2016 Overview

$
0
0

NIFTY16SEPFUT

Nifty Futures currently trading in a broader consolidation range for the entire august month and the September series contract is still trading in the broader range between 8575-8800. Overall Market mood is not so far benefiting the trend followers. Choppiness is again expected on Monday. However price trading and maintaining above 8600 indicates a possible continuation of the range 8575-8800.

This consolidation is so far dominated by shorter timeframe sellers and short covering against these sellers are so far missing in the markets.

Open Interest

Currently Open Interest Maintains the market range of 8500-9000.

OI Range

India VIX

India VIX

India VIX is currently trading at the lower edge. Low VIX indicates lack of fear about the downside in the market. Overall stock specific longs are preferred if nifty futures maintains below 8600.

The post Nifty Futures September 2016 Overview appeared first on Marketcalls.

Nifty Pharma – Bottomed Out Again?

$
0
0

CNX Pharma

Sometime back during Apr 2016 we have curiosity about pharma sector bottoming out. By that time sector has strong negative sentiment while hitting the panic bottom from there is had made a 2016 high of 12011. We believe that longer timeframe players are still interested in this sector though the presence of intermediate buyers.

CNX Pharma Support Zone

On the Daily Chart sellers failed to breach below the critical support zone 11340 indicates that shorter timeframe sellers are not serious about taking the price down at this point and buyers are responding to the move holding the price above 11340. So once again it is time to speculate on pharma sector for the arrival of strong buyers and taking the sectoral index towards the 2016 high zone.

RRG Charts – CNX Pharma

CNX Pharma RRG

RRG Charts suggests that currently Nifty Pharma in improving quadrant and rising momentum suggests that possiblly it could outperform Nifty in the short run from hereon.

The post Nifty Pharma – Bottomed Out Again? appeared first on Marketcalls.

What is Stop Hunting?

$
0
0

Probably if you are frequently trading any financial market, there are times you would have experienced fierce move against your trading positions and your stops would have taken out all in a sudden. Have you ever wondered why this happening again and again and again?

Stop Hunting

Stop Hunting is generally adopted by stronger players ( in matured stock/commodity markets it could be even driven by algorithms ) either to remove the weaker players from the market, to generate momentum, to seek liquidity or to generate volatility to benefit from it. Generally stop hunting happens during mid-day where the liquidity is dried up.

Here is what investopedia says,

A strategy that attempts to force some market participants out of their positions by driving the price of an asset to a level where many individuals have chosen to set their stop-loss orders. The triggering of many stop losses generally leads to high volatility and can present a unique opportunity for investors who seek to trade in this environment.Investopedia

So how do they know your stops?

Actually it is pretty simple. Here are some of the possible reasons

1)Most of the retail traders are bound to place their stoploss at round figures like 7800, 7900, 7950, 8000,9000 levels. Order Clustering effect around round numbers is well explained here

2)Most of the retail traders thinks like the majority of the crowd think especially during events, gap up or gap down situations, global markets reactions, political or economic events, earning results.

3)Most of the retail traders are highly leveraged. Eg trading two or even more lots of Nifty Futures with 1 lakh rupees to generate higher returns. Traders who are falling under this category are poised to trade with tight stoploss and so their trading behavior is predictable.

4)Most of the traders have a belief on their support and resistance system and that make them to place stoploss near to their belief zone. However in reality supports/resistance are meant to be tested and there are times you could even seen too many whipsaws around where the major crowd thinks the zone to be supports/resistance.

All traders watching same “movie” (Previous Swing High and Swing Lows ) #SwingTradingLinda Rashke

5)If you are emotionally driven with your trading decisions then possibly you end up catching wrong prices and thereby again poised for stop hunting. Especially when you are trading the following methodologies:

i) Previous day high low breakouts, Trading around Open Price
ii)Popular Moving Averages like 20,50,100,200
iii)Fibonacci Support/Resistance levels
iv)Pivot points
v)Trend lines
vi)any other strategies widely adapted by most of the traders.

Day Timeframe and Shorter time-frame players behave very mechanically. Jim Dalton

If you are system trader then you dont need to bother about stop hunting. However if you are discrete player you should care about stop hunting and more possibly try to have a better understanding about markets , market players and try to adopt efficient trading process. Else you will be no different from weak players in the markets.

The post What is Stop Hunting? appeared first on Marketcalls.

A Two-Bar Pattern that Points to Trade Setups

$
0
0

Some people like to get outside on the weekends, maybe playing tennis or working in the yard. Some people like to visit their friends or cook a big meal or go out to see a movie. And some people who are passionate about their work — such as Elliott Wave International’s futures analyst Jeffrey Kennedy — like to stare at hundreds of price charts on their computer screen to find patterns that point to trade setups. We used to worry for his health but not anymore, because he’s been doing it for years and he comes up with some neat stuff. A case in point is his discovery of a two-bar pattern that he named the Popgun. Find out more in this excerpt from the Club EWI eBook, How to Use Bar Patterns to Spot Trade Setups.


The Popgun

I’m no doubt dating myself, but when I was a kid, I had a popgun — the old-fashioned kind with a cork and string (no fake Star Wars light saber for me). You pulled the trigger, and the cork popped out of the barrel attached to a string. If you were like me, you immediately attached a longer string to improve the popgun’s reach. Why the reminiscing? Because “Popgun” is the name of a bar pattern I would like to share with you this month. And it’s the path of the cork (out and back) that made me think of the name for this pattern.

Pop Gun Pattern

The Popgun is a two-bar pattern composed of an outside bar preceded by an inside bar. (Quick refresher course: An outside bar occurs when the range of a bar encompasses the previous bar and an inside bar is a price bar whose range is encompassed by the previous bar.) In Chart 1 (Coffee), I have circled two Popguns.

two-bar-patterns-02

So what’s so special about the Popgun? It introduces swift, tradable moves in price. More importantly, once the moves end, they are significantly retraced, just like the popgun cork going out and back. As you can see in Chart 2 [not shown], prices advance sharply following the Popgun, and then the move is significantly retraced. In Chart 3 [not shown], we see the same thing again but to the downside: prices fall dramatically after the Popgun, and then a sizable correction develops.

How can we incorporate this bar pattern into our Elliott wave analysis? The best way is to understand where Popguns show up in the wave patterns. I have noticed that Popguns tend to occur prior to impulse waves — waves one, three and five. But, remember, waves A and C of corrective wave patterns are also technically impulse waves. So Popguns can occur prior to those moves as well.

As with all my work, I rely on a pattern only if it applies across all time frames and markets. To illustrate, I have included two charts of Sirius Satellite Radio (SIRI) that show this pattern works equally well on 60-minute and weekly charts. Notice that the Popgun on the 60-minute chart [not shown] preceded a small third wave advance. Now look at the weekly chart [not shown] to see what three Popguns introduced (from left to right), wave C of a flat correction, wave 5 of (3) and wave C of (4).


Find out How to Use Bar Patterns to Spot Trade Setups

In this comprehensive 15-page eBook, Jeffrey provides each pattern with a definition, illustrations of its form, lessons on its application and how to incorporate it into Elliott wave analysis, historical examples of its occurrence in major commodity markets, and ultimately — compelling proof of how it identified swift and sizable moves.

Download the free, 15-page eBook today

This article was syndicated by Elliott Wave International and was originally published under the headline A Two-Bar Pattern that Points to Trade Setups. EWI is the world’s largest market forecasting firm. Its staff of full-time analysts led by Chartered Market Technician Robert Prechter provides 24-hour-a-day market analysis to institutional and private investors around the world.

The post A Two-Bar Pattern that Points to Trade Setups appeared first on Marketcalls.

Viewing all 2070 articles
Browse latest View live