Quantcast
Channel: Market Calls
Viewing all 2070 articles
Browse latest View live

Nifty Futures and Bank Nifty Futures September Expiry Overview

$
0
0

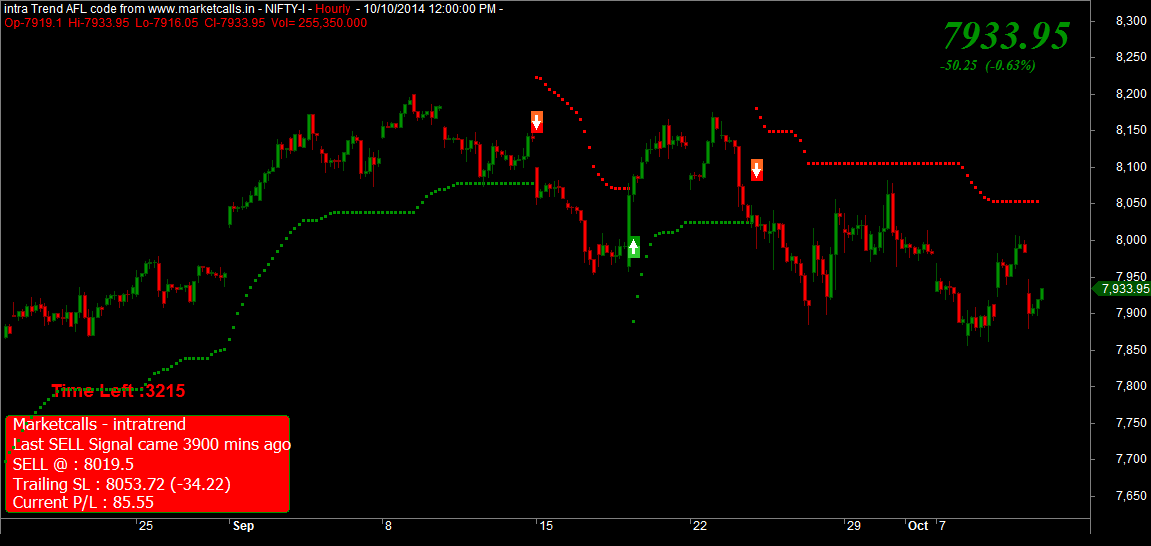
Nifty futures reverse from its low of 7952.5 after US Federal Reserve at the end of a two-day policy meeting on last Wednesday, 17th Sep 2014, maintained a commitment to keep US interest rates near zero for a considerable time.

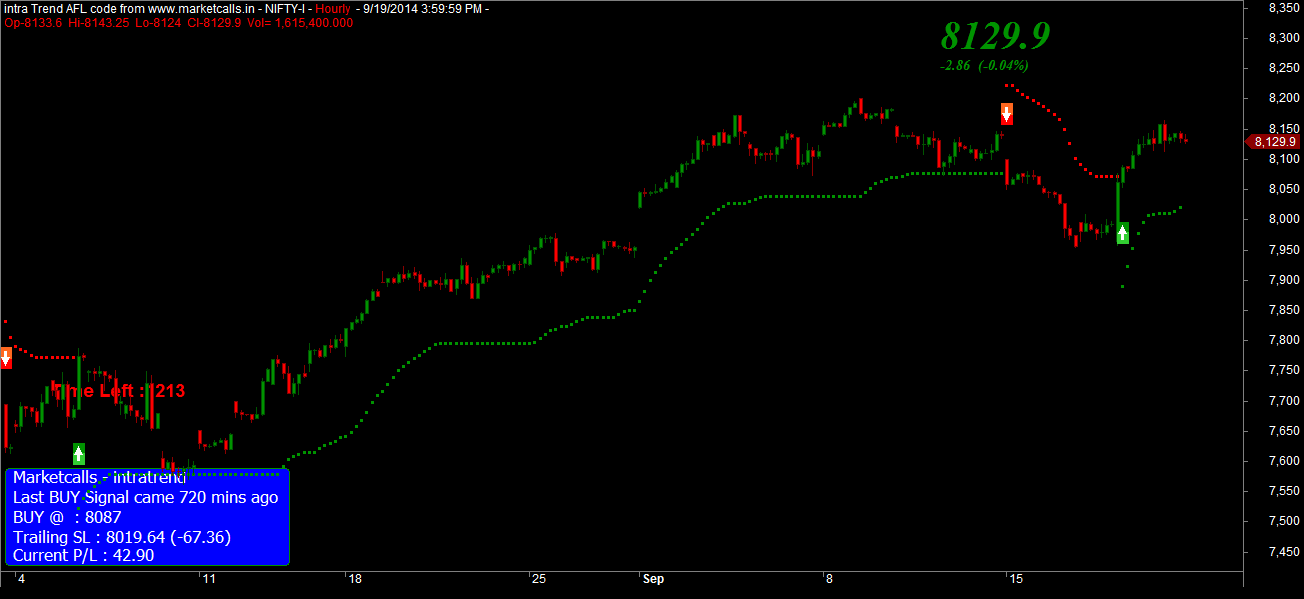
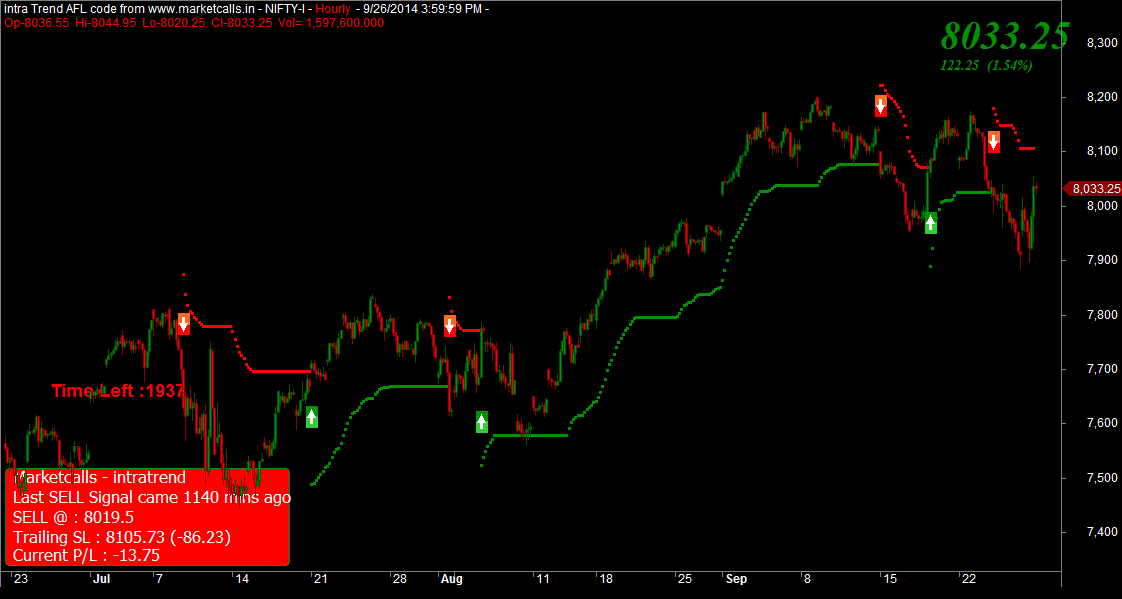
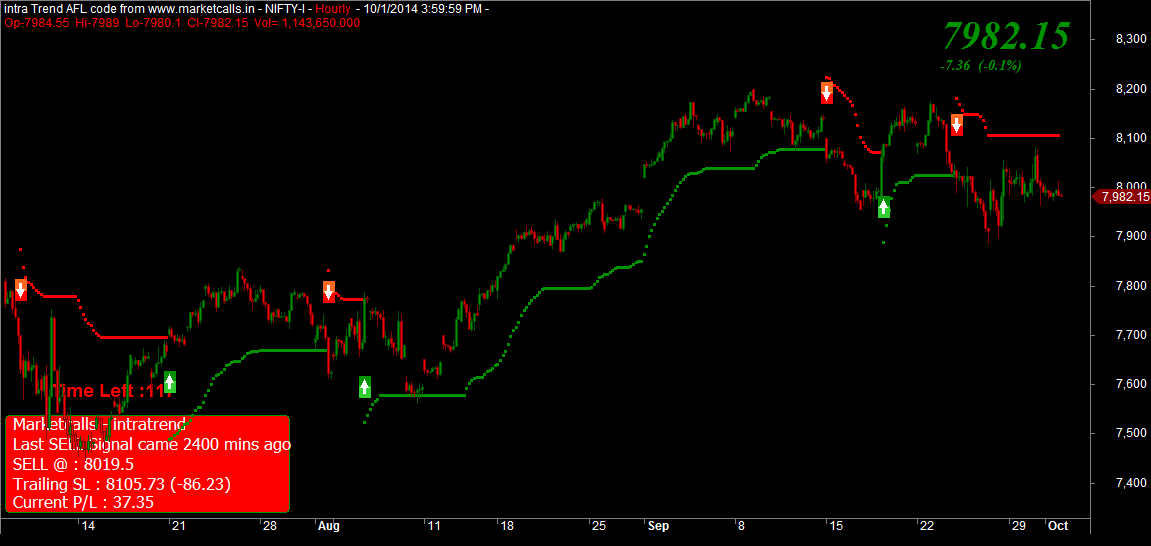
Nifty Futures Hourly Chart
Nifty Futures

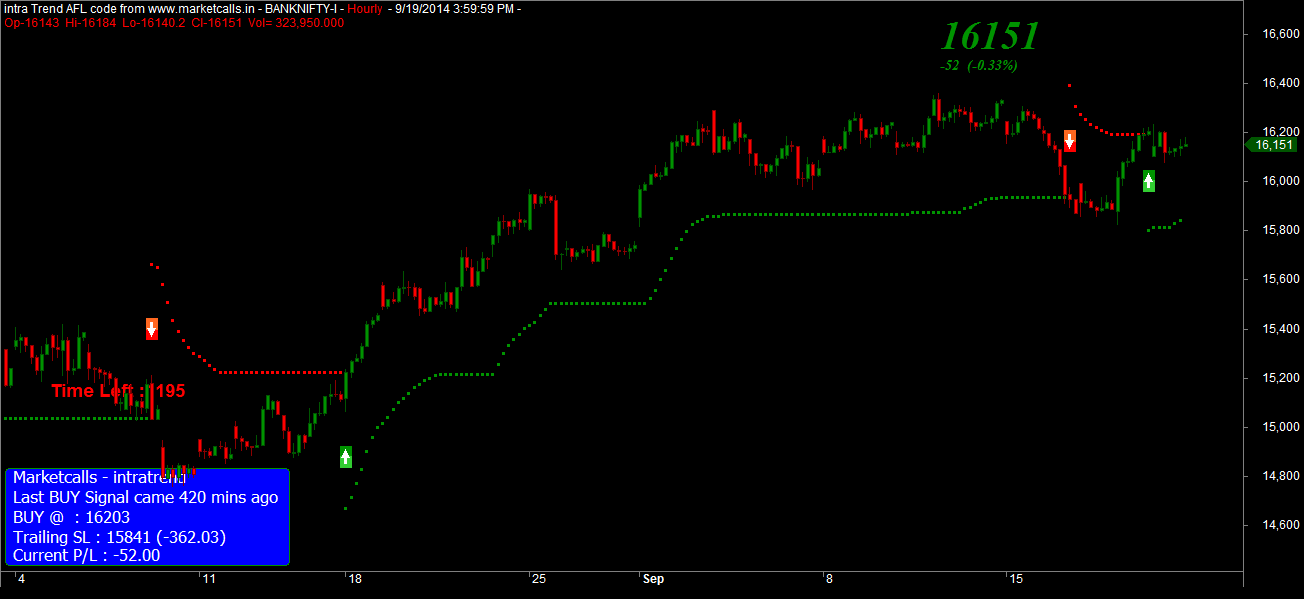
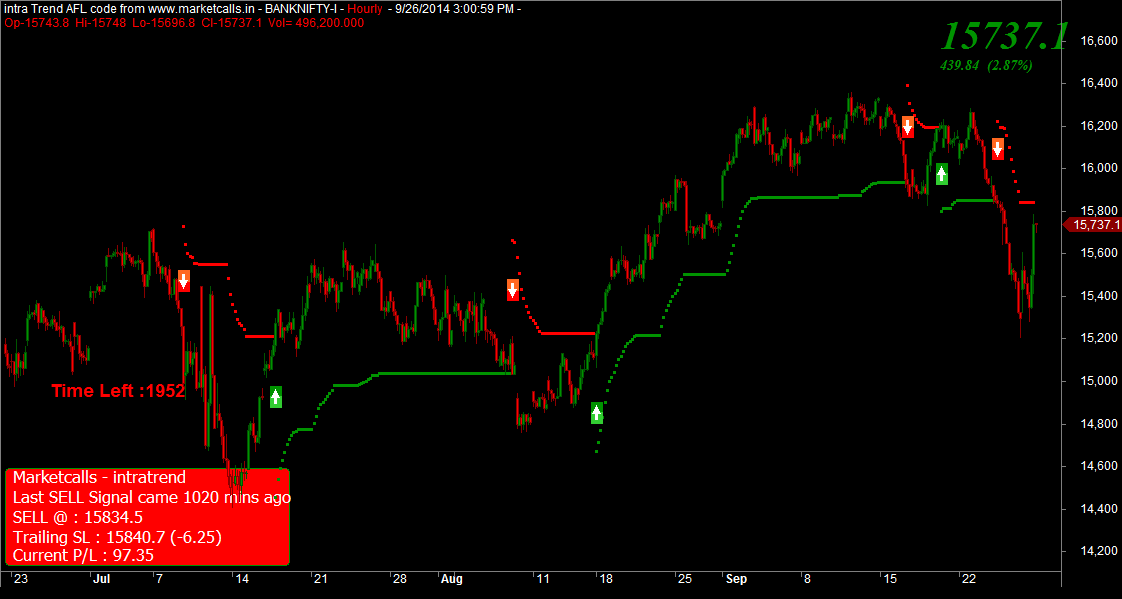
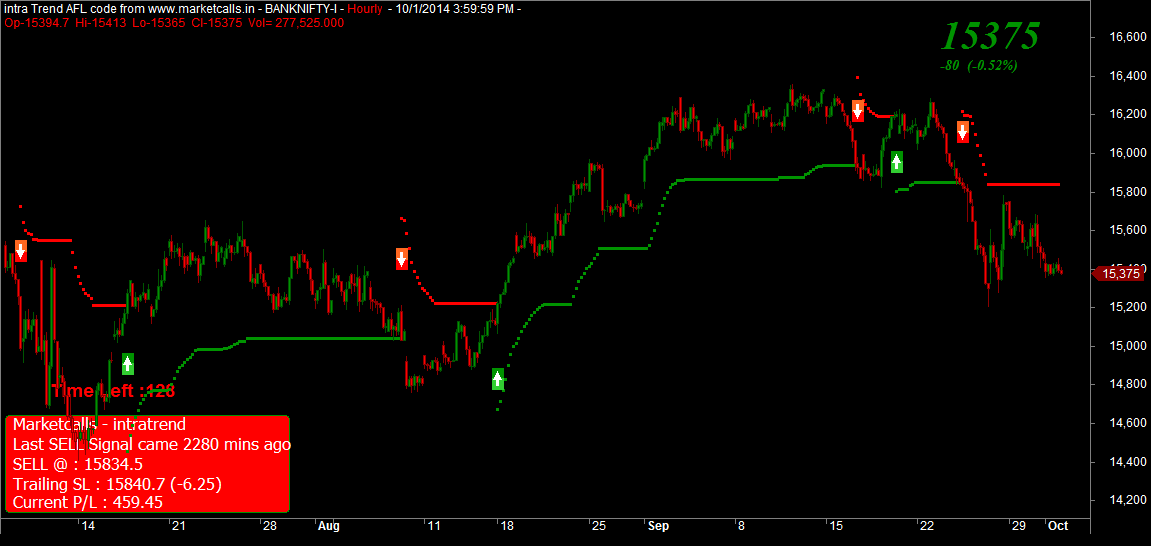
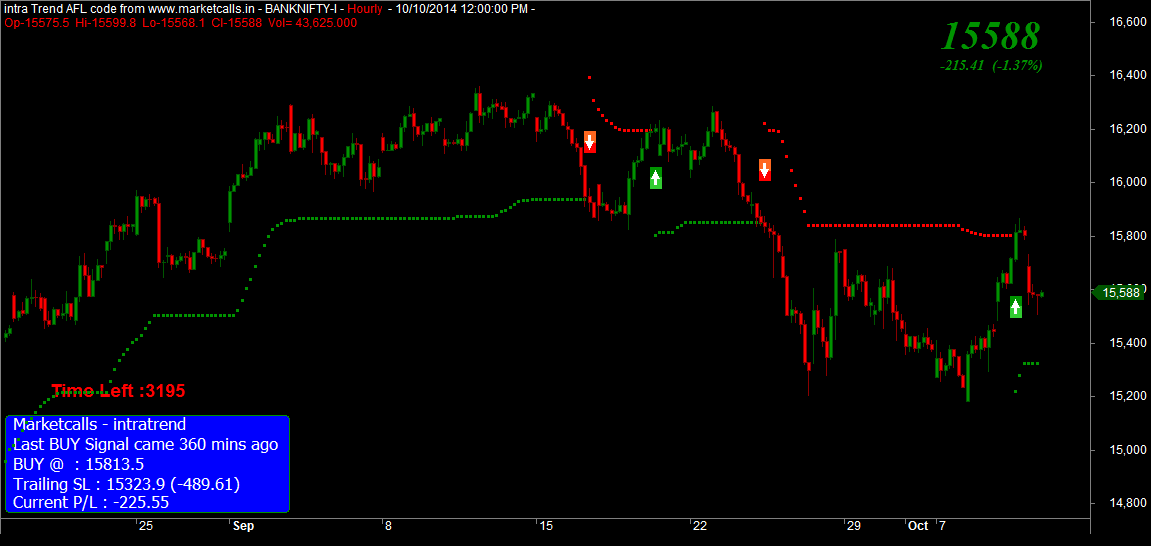
Nifty and Bank Nifty Hourly charts are in positional buy mode and bank nifty very recently turned to positional buy mode on last trading session. Currently the support zone comes around 8019 and 15841 respectively. Reverse you position to positional sell mode if the support zone breaks on the hourly charts(on closing basis).

Bank Nifty Hourly Chart
Bank Nifty

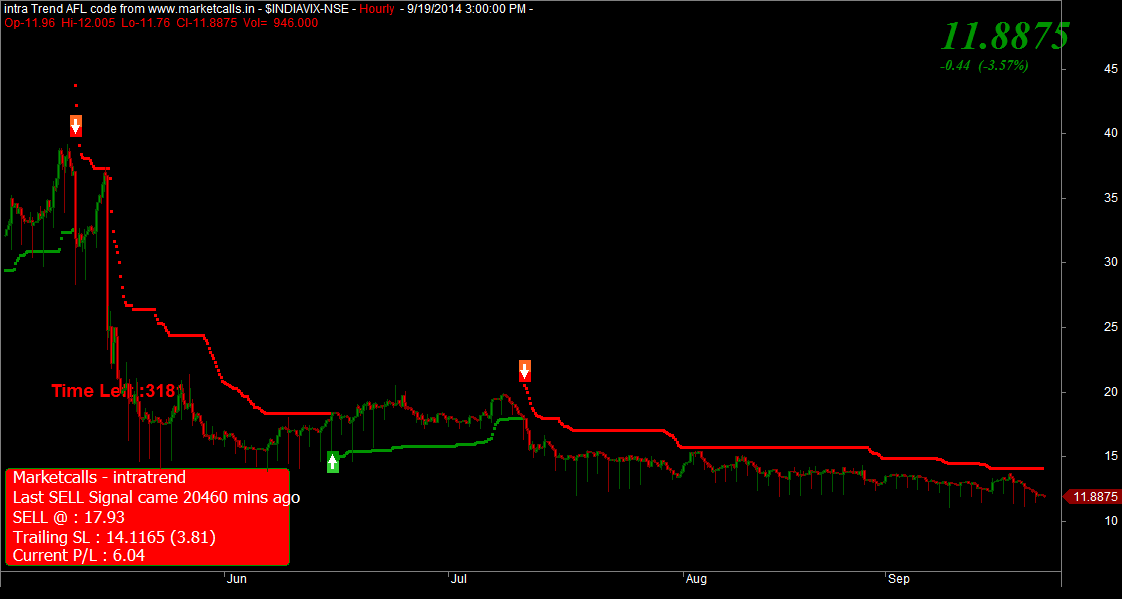
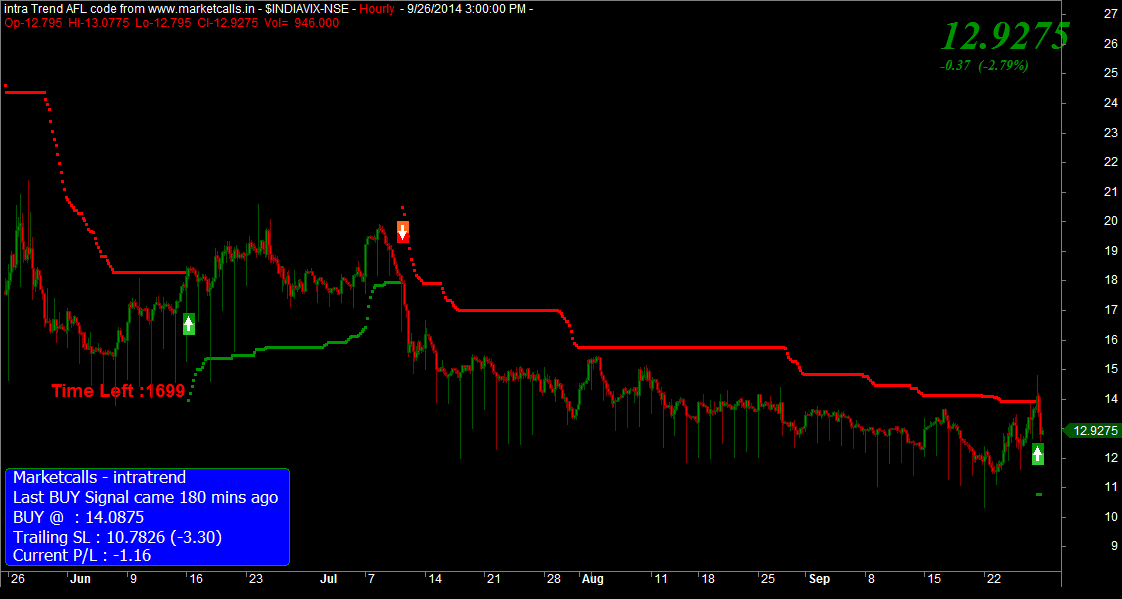
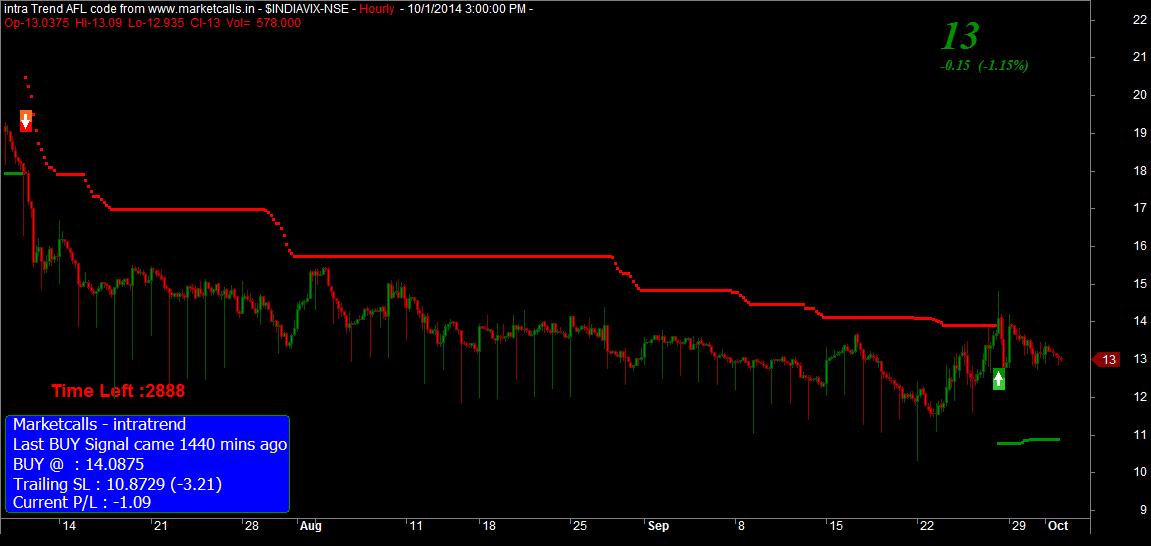
India VIX Hourly Chart

India VIX on the hourly charts is in positional sell mode for a very long time since mid of july 2014 and currently the resistance zone comes around 14.11. And also it should be noted that INDIAVIX is trading below sub 12 level. Do you think INDIAVIX will mode to signle digit from here?

India VIX

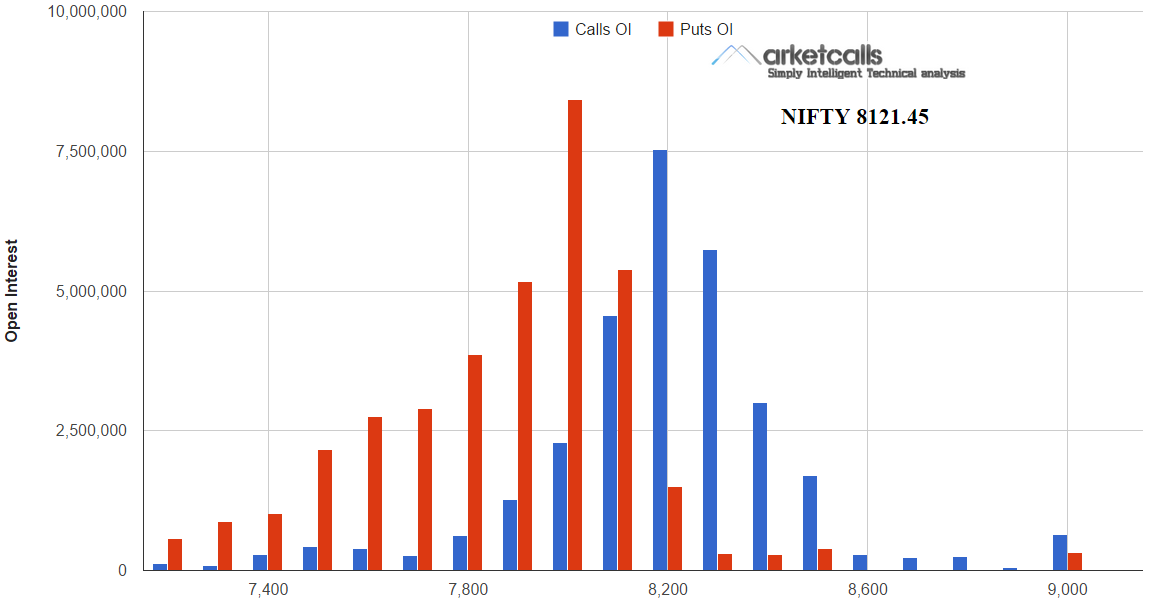
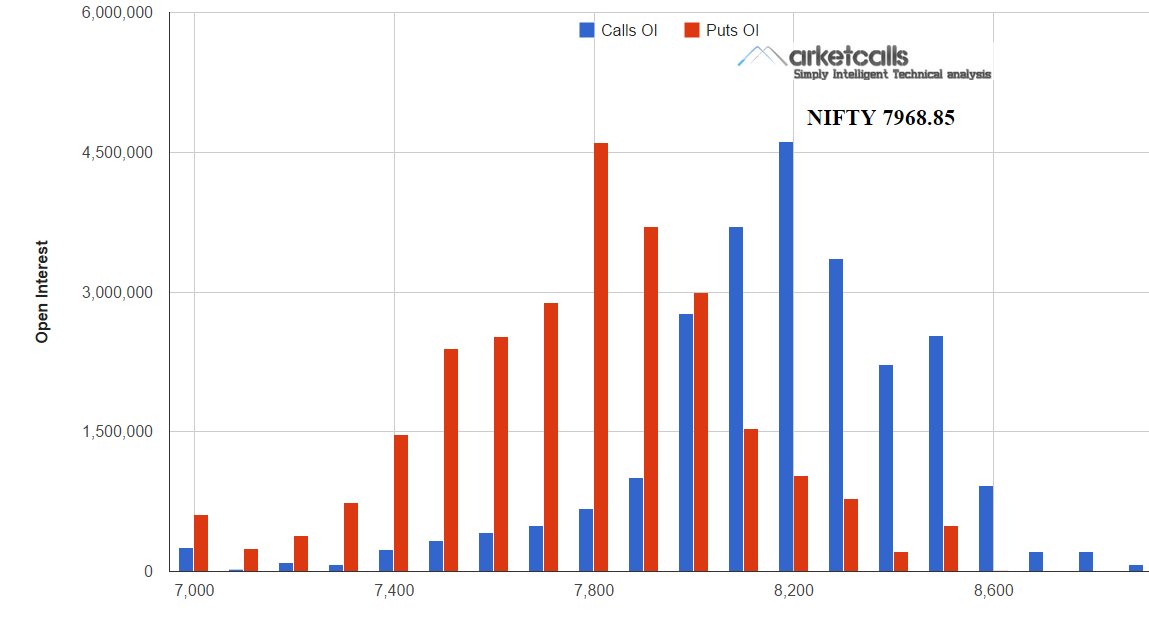
Nifty Open Interest Lookup

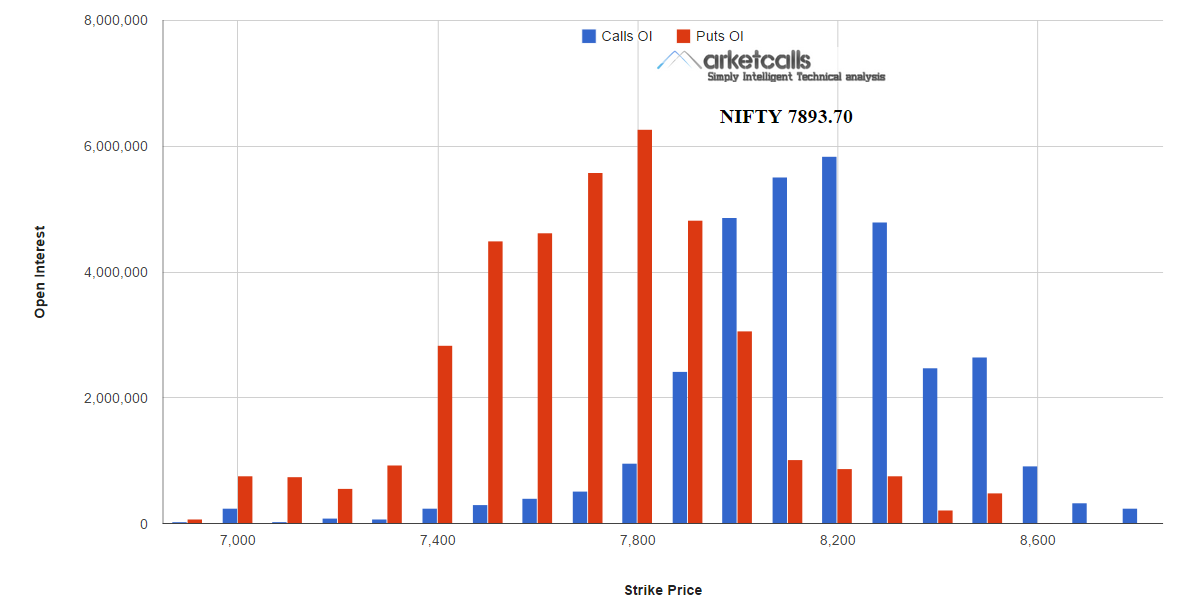
when nifty futures dips below sub 8000 level 8200CE writers started building open interest on reversal back after the FED meeting 8000PE writers are back again with building huge open interest positions over there and the declining volatility will favor the 8000PE writers in eating up the premiums as expiry is nearing.

Open Interest

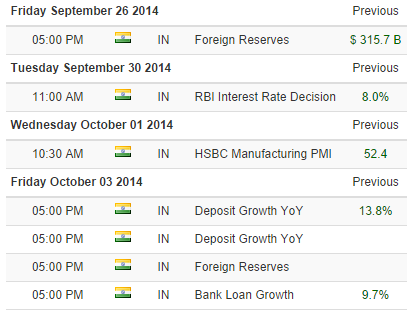
Upcoming Economic Events

Evenomic Events
[data source : Trading Economics]

Related Readings and Observations

The post Nifty Futures and Bank Nifty Futures September Expiry Overview appeared first on Marketcalls.


De-Addiction Therapy For Kerala From The UDF Government Proves Expensive

$
0
0

Cigrattte Kerala Taxes higher The State Government in Kerala seems to be on the warpath. It seeks to eradicate all forms of vices from the state. The new liquor policy made people sit up and take notice. They made such a radical move by closing down all alcohol outlets, barring the five-star variety. It is indeed a revolutionary one. The fact is quite astounding when one considers that the highest revenue for the exchequer comes from the sale of alcohol. By taking a stand against a valuable source of income, almost Rs.8000 crores annually, the Government seems to indicate a willingness to be a strong policy maker.
Revolutionary or repressive

The government took this radical decision to ban alcohol in the state in August 2014. The move was so sudden, one wonders if the Chief Minister himself had any idea of such set of consequences. The move came on the insistence of the new President of the party, V.M. Sudheeran. He has been opposed to the sale and consumption of alcohol in the state and as a whole. The decision to not renew the licenses of the 418 bars was the first phase. The next thing everyone hears is the declaration of Mr. Oommen Chandy to close the whole trade by the beginning of next financial year.

Hard hitting the trade

Apart from the 418 bars already closed, 312 bars currently operational will get closed by next year. Their licenses won’t get renewed, and the trade will close by itself. Meanwhile, the storekeeper of the Indian Made Foreign Liquor (IMFL) in the state, the Beverages Corporation will find itself closed by the end of ten years. The government has decided to allow only five-star hotels to serve alcohol. Some clubs that serve alcohol to its patrons will need special perusal. The military quota alcohol distributions are beyond the control of the government, so they are left alone.

Some expensive changes

The state needs to recoup some of the expected losses, and the lawmakers are hitting hard. Duty on IMFL has increased by 20% to become 135%. Beer and wine will have an additional tax of 10% and the expected revenue from this is about Rs.1130 crores. The tax on cigarettes has increased by 8% taking it to 30%. The additional cess of 5% will serve to rehabilitate the employees of the state-owned bars, outlets and hotels. The drinking water has had the highest hike of 50% more. For every kiloliter of water consumed, the users will have to pay Rs.6 as opposed to the earlier Rs.4. Service charges have increased by 50% as well. Between Rs.1000-2000 worth it is 25% and beyond Rs.10000 it is 15% more.

Decisions for common good

The Union Health Ministry has applauded the move. In fact, the Chief Minister justified his actions stating that the damages caused due to alcoholism are far greater than the revenue from it. Although, it needs clarification about five-star hotels are allowed to sell alcohol as an exemption. Industry experts state that tourism will get severely affected. Most of the foreigners and out-of-state tourists will desist and decide to move to a different and more amenable locale is what they fear. The move of the government needs careful watching, although the action to tax drinking water was a move generating fear of future policies.

Related Readings and Observations

The post De-Addiction Therapy For Kerala From The UDF Government Proves Expensive appeared first on Marketcalls.

Strong Greenback Weakens Gold Prices

$
0
0

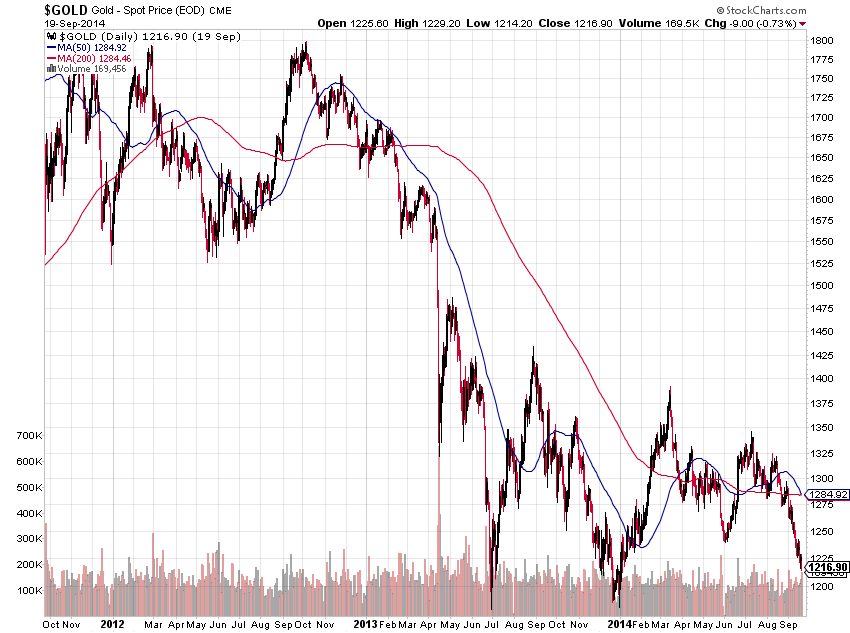
Last year, investors were really bearish on gold, what with the foreseen interest hike that would be imposed by the U.S. Fed. In 2013, economists were sure that gold’s bull run would end in 2014, as the precious yellow metal would most likely be pressured from a stronger greenback and higher interest rates. Those predictions are slowly becoming a reality today.

Gold EOD Charts
Gold Daily Chart

Gold prices have settled at the lowest levels in 8 months during the second week of September, as the dollar continued to gain confidence from investors. Gold lost 2.7% against the dollar and ended in the second week of September with their lowest since December 2013. Gold prices skyrocketed to 70% from 2008 – 2011 when the Fed bought bonds in order to stimulate the U.S. economy. Silver, on the other hand, fared much better than its yellow metal cousin last week. In a report by BullionVault, silver’s prices remained unchanged at $18.56 per ounce last Monday.

“The precious metals complex is just completely falling apart, and a lot of it is attributable to the stronger dollar and that interest rates will be higher in the coming months,” said senior market analyst John Payne who works for Chicago-based Daniels Trading.

Investors predict the U.S. Fed will set the interests even higher in 2015. In addition, the European Central Bank’s decision to cut interest rates even lower sent the dollar to a 14-month high against other tradable currencies.

The U.S. fed is expected to put a complete stop to its stimulus package in October, and raise interest rates in 2015. The turmoil that’s happening in Ukraine won’t be helping gold prices either, as recent data shows that the precious yellow metal’s prices didn’t increase as much as it was predicted to during the peak of the discord in Ukraine. Gold will have to find a better base if it wants to keep its investors happy.

Related Readings and Observations

  • USDINR and GOLD Spot Price Medium Term Outlook Currently both USDINR and Gold maintains a medium term buy mode. And the support zone comes around 59.55/Dollar and 1260.6 respectively. Outlook will turn bearish if the support zone […]
  • Triangle Breakout in Gold Daily Charts Now gold is trading around $1301 & we can see on charts, gold was able to provide a triangle breakout. This breakout was very much awaited after gold placed a bullish candlestick pattern […]
  • Gold Vs Bitcoin Comparison : Infographic Which one will be consider as the alternative currency Gold or Bitcoin in the future? Will a physical gold will be the future currency or the virtual currecy like bitcoins. The following […]
  • Will Gold Resume Downtrend Move Again Now gold is trading around $1271 mark & as we can see on charts, gold retested the upper tradeline of minor descending channel & placing a bearish candlestick pattern once again […]

The post Strong Greenback Weakens Gold Prices appeared first on Marketcalls.

China Commodities Market Unleashed.

$
0
0

 stock-trader

China commodities market Unleashed.


  • Yes any non Chinese can access SHFE .. There are Two Ways of Accessing China Market.
  • To setup Company at China need 1.5 to 2 months Time with 25K – 35K USD or you can do via offshore way.
  • Transaction costs are on Lower side.
  • Precious & Non Precious Metal lots are Very much liquid.
  • Currency already packed.
  • Excellent parity CME & SHFE.
  • There are various Software’s those have CME & SHFE active.
  • We provide demo account if you want.
  • No Capital Gain taxes.
  • Right now Third most liquid Exchange in commodities world seems to be SHFE.


 Price Discovery

Bullion (Gold and Silver)
Right now COMEX seems to be more dominant then other world Commodities Exchanges. So Discovery of price for Bullion comes from COMEX.

Metal (Aluminum, Copper and Zinc)
For metals LME seems to play the dominant role, followed by Other Commodities Exchanges.

Energy (Crude & Natural gas)
For Crude : We Found that ICE is the most dominant platform followed by NYMEX.

For Natural gas : We Found that NYMX is the most dominant platform.

INTRODUCTION

Shanghai Futures Exchange (SHFE) is organized under relevant rules and regulations. A self-regulated entity, it performs functions that are specified in its bylaws and state laws and regulations. It is regulated by the China Securities Regulatory Commission (CSRC). At present, futures contracts’ underlying commodities, i.e., gold, silver, copper, aluminum, lead, steel rebar, steel wire rod, natural rubber, fuel oil and zinc, are listed for trading.

Guided by the Concept of Scientific Development, Shanghai Futures Exchange commits itself to promoting the opening-up and continued progress of the capital market and construction of a harmonious market environment. SHFE adheres to the guidelines that are generalized as “legislation, supervision, self-regulation and standardization”, with stability, development and innovation as a priority. The exchange organizes trading activities strictly according to the laws and rules, and fulfills its functions as a front-line regulator. SHFE endeavors to develop itself into a regulated, efficient, transparent and product-inclusive internationalized futures exchange that focuses on the metal, energy and chemical-related industrial products and the corresponding derivatives. In order to realize the functions of the futures market as price discovery and risk hedging, and serve the development of the national economy, Shanghai Futures Exchange is establishing a secure, orderly, efficient market mechanism and an open, fair, equitable and transparent market environment.

For copper , silver & zinc it stand in top 20 exchanges as per volumes are concern in Year 2011 till 2014.

If want to start your Trading Desk at China & want to trade SHFE?.

Major Points to understand.

As a non China Resident is it possible to Trade at china exchange. Any non Chinese can not open account right now directly. But there are two ways to do trading at China.

Two Ways of Accessing China Market

Major part – Open your own company here or make one partner here & trade.

1. Cross-border Cooperation with a Chinese CompanyManaged Account
2. Set up a Company in China.

1) Wholly Foreign Owned Entity (WFOE) is a company invested by foreigners.

It takes about 1-1.5 months to finish all the procedures to register a WFOE. We could help find relevant legal consultant to do that for overseas clients.

Cost: 20-25 thousands USD.

2) Capital injected into the WFOE could not be directly used to trade futures.

So the WFOE should do some physical trading to generate CNY(onshore RMB) revenue. These revenues could be used to trade futures.

And in Shanghai Free Trade Zone, you don’t even need to rent an actual office to register a company. They will give you a post box address. So the operation cost is actually low.

Broker could help finding reliable physical trading counterparties, which are also our clients.

Actually broker helped several big overseas trading firm to enter China market through this way.

All the revenues could be paid to overseas shareholder through paying dividend each year.

Advantage:

-Potential chance to gain profits from doing physical trading.
-Chance to gain interest spread in China.

(Official deposit rate in China is 3.5%, which is higher than overseas market.)

Disadvantage: Take more time, efforts and cost to set up.

3) When you have a WFOE, you could use the WFOE to open bank account in China, Some Hongkong financial companies provide services to transfer offshore USD into China.

These financial companies have both onshore and offshore assets. Client give USD to offshore account of these financial companies. And they will give onshore RMB to client’s WFOE bank account.

The transfer could be done in 10-20 minutes. Of course the financial companies earn some profit through exchange rate. Basically this is very convenient. But if client choose this way, we suggest them transfer money several times in small amount, which could protect them from counterparty risk.

Future commodities products – Precious Metals / Non Precious metal / Energy Products – Contract Details – complete details size / Months available / In which currency it run / Margin requirements per contract.

How anyone can hedge china currency with USD.

Currency Trading is not allowed at china. For that u can use NDF from bank .Important part is that gap between USD & RMB is packed so no big movement.

But you can find

CME has CNH futures, but it is offshore RMB

Market Data Providers

Yes you can get market data from world top data providers i.e Thomson Reuters, Bloomberg, Interactive Data many other. For analysis you can get the data from Exchange website – Delayed data , Day data , Weekly data , Monthly data & annual statistics.

Trading Hours.
9:00-11:30 am, 13:30- 3:00 pm Beijing time

Any minimum requirements to open account Funds with broker & minimum volume required.
50000 USD no minimum limit for volume

What all software available here to trade at SHFE.
Most of brokers have their own applications – Free of cost. Third party software’s i.e CQG/RTS are there

If some one have its own set of Order management system then how he can connect with Exchange.

FIX API Broker provides & its utilization is free of cost.

Do SHFE provide Paper test environment for their clients?
Paper test available & free of cost. No need to open account. Your broker can help u in that.

SHFE offer: Colocation or proximity colocation

-Yes they have Data Centre
-Racks are available you have to provide your own servers. They provide on 1U    space basis.

 How you connect us with that server

Currently SHFE is not connected through Leased lines to other exchanges so not offer leased line access yes you can access using Internet VPN.
SHFE is located at Shanghai

Brokerage Charges. Depend upon Volume you create..

Taxes – No capital gain taxes.

Lokesh Madan

For Complete details : visit http://algotradingindia.blogspot.in/2014/08/china-new-future-commodities-trading.html

Related Readings and Observations

The post China Commodities Market Unleashed. appeared first on Marketcalls.

Gold Technical Analysis – Reversal or Corrective Bounce.

$
0
0
Gold (24.9.2014) fall sharply in last couple of weeks & reaching very close to the major support zone.
Now gold is trading around $1221 & as we can see on charts , gold proving some upside momentum from last 2 days with some very obvious reasons. The downside rally in gold filled a gap on charts which was created on 1st week of January 2014. At the same time this area also representing 261.8%% Fibonacci retracement. A long term support trendline is staying very close around $1196 mark & indicator are over sold now. The current formation of candlestick pattern suggesting for a possible bounce or a corrective rally as of now. Now very sure about the bottom is created or not.
On fundamental side , US counter on global issue & some weaker economic data might support price in coming trading session.
XAUUSDDaily
Based on above studies , it is possible for gold to move upwards towards possible targets around $1240 & then $1258 in coming trading session.
Note – Above technical analysis is not a buy/sell recommendation. For recommendations Contact Us 
MCX  levels ->    S2(26290)         S1(26445)        cmp(26620)       R1(26870)        R2(27280)

Related Readings and Observations

  • Strong Greenback Weakens Gold Prices Last year, investors were really bearish on gold, what with the foreseen interest hike that would be imposed by the U.S. Fed. In 2013, economists were sure that gold’s bull run would end […]
  • USDINR and GOLD Spot Price Medium Term Outlook Currently both USDINR and Gold maintains a medium term buy mode. And the support zone comes around 59.55/Dollar and 1260.6 respectively. Outlook will turn bearish if the support zone […]
  • Triangle Breakout in Gold Daily Charts Now gold is trading around $1301 & we can see on charts, gold was able to provide a triangle breakout. This breakout was very much awaited after gold placed a bullish candlestick pattern […]
  • Gold Vs Bitcoin Comparison : Infographic Which one will be consider as the alternative currency Gold or Bitcoin in the future? Will a physical gold will be the future currency or the virtual currecy like bitcoins. The following […]

The post Gold Technical Analysis – Reversal or Corrective Bounce. appeared first on Marketcalls.

Nifty and Bank Nifty Futures October Overview

$
0
0

The steep fall in Nifty and Bank Nifty futures got arrested after S&P revises India’s sovereign credit outlook from ‘negative’ to ‘stable’. The global rating agency added that India could possibly see upward revision of its ratings from BBB-/A-3, provided it reverts to real per capita GDP growth of 5.5%, and its fiscal, external, and inflation metrics improve. However FIIs have sold equities worth more than Rs 3,150 crore in the last four consecutive trading sessions.

The Reserve Bank of India’s (RBI) monetary policy review on 30th September would be the key trigger for market movement. Indian Stock Exchanges will remain closed on Thursday and Friday for Mahatma Gandhi Jayanthi and Dussehra respectively.

Nifty Hourly Charts
Nifty Futures

Nifty and Bank Nifty futures turned to positional sell mode on 23rd of September and currently the resistance zone comes around 8105.73 and 15840 respectively reverse your position to positional buy mode if the resistance zone breaks on the hourly charts.

Bank Nifty hourly Charts
Bank Nifty Futures

India VIX Hourly Charts

After a prolong sell mode in India VIX finally there is some volatility on cards and turned to positional buy mode and currently the support zone for India VIX comes around 10.78 and we can expect a little descent increase in volatility in the upcoming sessions.

India VIX

Nifty Open Interest Build Up
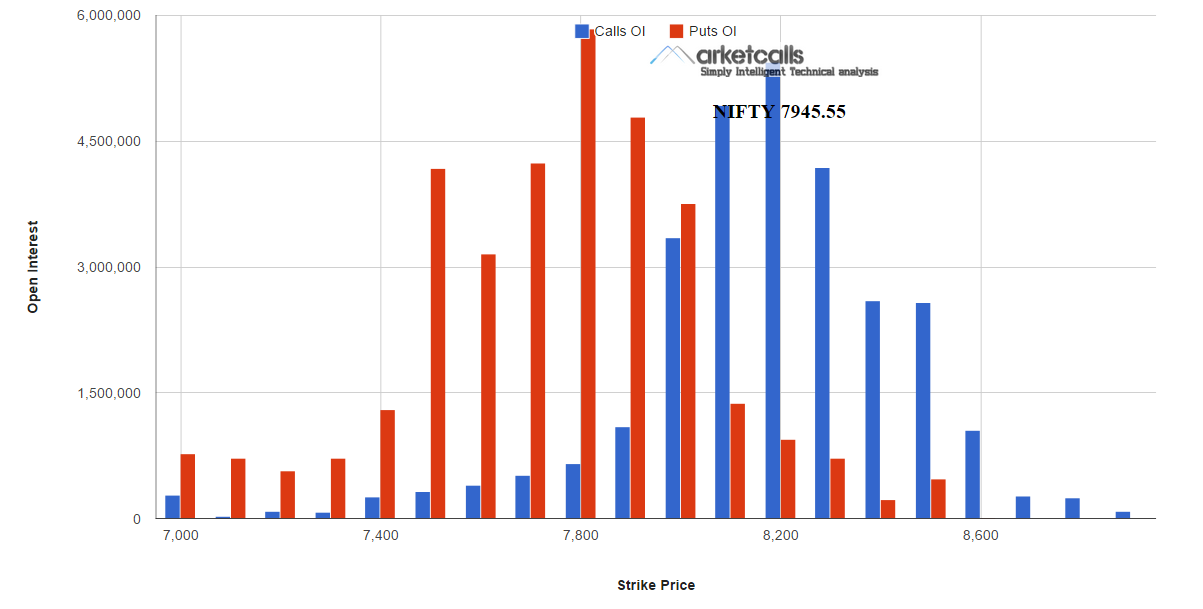
The Higher open interest build up is seen in 7800PE and 8200CE and the expected market range as of now is between 7800-8200 for this expiry however as the october expiry is very young it is good to observe the development of open interest positions to get further cues from it.
Nifty Open Interest

Upcoming Economic Events
Economic Calendar - upcoming

Related Readings and Observations

The post Nifty and Bank Nifty Futures October Overview appeared first on Marketcalls.

WealthCreator : Nifty Future Weekly Research Report

$
0
0

Nifty Future Hurdle Area 8080-8120
A sharp correction and a rally has been seen the past week in FNO September Expiry. After making the high of 8176+ for the week the market plunged back down to 7884 testing its 50 day moving average on Thursday’s trading session. Bulls were in panik and bear’s after such a long time had a small share of the joy.

Nifty Future

The Decline was accompanied by heavy volume and there was a long unwinding in most stocks and sectors. The Sept Future expired @ 7902+.

Friday session witnessed a dramatic turn around in index future, after opening decent and making a high of 8018 for the day market saw a correction and tested the new intraday lows of 7897 (around 50 DMA) and there was a sharp recover in the later half of the day. The markets covered and all round buying seen in banks and nifty stocks the market made an intraday high of 8057+ and closed the week at 8031.90

For week starting Monday 29th September 2014 the Nifty Future will face still resistance at 8080-8120 range if manage to close above this level the Bulls will become active again and expect a buying frenzy in stocks. The index shall run for 8200 and there after 8500.

On downside the supports for nifty future are at 8000 & 7960 Major TREND will reverse below 7900 only now ! For specific nifty future trades u can mail me at mohitjhanji@gmail.com

Related Readings and Observations

  • Nifty Future Weekly Outlook 14th September 2014 Nifty Futures closes the week at 8137.85 after making the high of 8200 for the week. The Friday session however was a positive day. On daily chart the Nifty broken down from a Rising wedge […]
  • Nifty Future Research Report 18th Aug 2014 Nifty future closed the week on a positive note on weekly chart. Nifty future closed Friday’s trading session at 7803.70. Nifty future has been consolidating in a sideways horizontal range […]
  • Nifty and Bank Nifty Futures October Overview Nifty and Bank Nifty futures turned to positional sell mode on 23rd of September and currently the resistance zone comes around 8105.73 and 15840 respectively reverse your position to […]
  • Will Nifty Sustain above 8000 till September Expiry? Surprisingly Mutual funds are the Net buyers consecutively for the last four months and had pumped a net inflow of closely 15464.5 crores right from May 2014 month onwards. It seems mutual […]

The post WealthCreator : Nifty Future Weekly Research Report appeared first on Marketcalls.

Oxigen Wallet – RBI Approved First Virtual Mobile wallet

$
0
0

Does anyone heard about money transfer via social networks? Is it possible practically? Yes . It is now possible with the Oxigen Wallet introduced by Oxigen Services India.

oxygen wallet logo

What is Oxigen Wallet?

Oxigen Wallet ,India’s first social mobile wallet service comforts people to share money with their friends & family over their preferred social networks and messaging platforms like Facebook,WhatsApp, Google+ and Twitter. Moreover Oxigen Wallet is India’s first RBI approved non-bank wallet to be integrated with NPCI allowing instant money transfer from the Wallet to 60+ banks and vice versa using the Immediate Payment Service (IMPS).

Oxigen-Apps

The Service extends to recharge mobile phones, TV recharges, pay bills, travel bookings, purchasing mobile videos, music,games and shop across a large number of online merchants. In other words, a single mobile application will meet all payment needs and set money free, in its true senses.

Start using Oxygen Wallet services in 3 simple steps

Step 1 : Register
Create a virtual Wallet

By clicking on New User on this Website.
Or
SMS – Oxigen Agree DateofBirth (DDMMYY)FullName to 9870888888
For e.g. Oxigen Agree 201092 Amit Kumar

img_register

On sending the above sms you will receive a confirmatory sms on your registred mobile number mentioning your initial system generated 6 digit password

  • Your 10 digit mobile number is your User ID.
  • You are advised to change your initial 6 digits password to ensure wallet security

Step 2 : Load Money

By paying cash at an Oxigen outlet
or
Load your wallet using IMPS (Net Banking) on Oxigen website

img_loadmoney

Your wallet gets topped up and now you’re ready to buy products and services available on Oxigen

Step 3 : Make Payment

img_makepayment

  • Do Money Transfer, Online Recharges,Bill Payments through Oxigen Wallet website (e-commerce transactions).
  • You can also access Oxigen Wallet through mobile using GPRS or any other access technology.

Unique Features of Oxigen Wallet

  • Oxigen Wallet is your Prepaid Stored Value Virtual Wallet.
  • Our Unique payment solution is completely secure.
  • It can be used on the web as well as on GPRS Enabled/Active handsets – Unified Payment Solution.
  • Compatible with any access technology (GSM/CDMA/WiFi/DSL Connection/Dial-up connection).
  • Compatible with all wireless data access technologies (GPRS/Edge/3G/Wimax).
  • Central Oxigen data server is maintained in a safe and secure environment with SSL encrypted transaction.
  • Load your wallet with cash and get full value for usage. There are no hidden charges or deductions.
  • Use Oxigen Wallet for instant money transfers, online recharges and bill payments and experience a faster checkout as you need not provide details of your financial instruments everytime you pay through your Oxigen Wallet
  • You can schedule your recharge (mobile/DTH/Data card), Bill payment (mobile/landline/data card/electricity) or money transfer using Oxigen Wallet in just a few minutes to save your time and get your recharge/bill payment done before the expiry of the validity period
  • You can even send money to somebody who is not in your social networks also.
  • Free of cost for sending money through social media and also for attaching video/audio/photo.
  • Earn through referral schemes & Oxigen points.
  • We have a widespread distribution network where you can load your wallet offline.
  • Reliable and faster checkout experience

Related Readings and Observations

The post Oxigen Wallet – RBI Approved First Virtual Mobile wallet appeared first on Marketcalls.


Nifty Weekly wrap up and Global Sentiment

$
0
0

Global News Impact
– ECB rates on hold and to Start Bond Buys This Month.
– RBI keeps interest rate unchanged at 8 per cent
– European Markets Trading below 5 months low.
– Crude Oil drops below 88 dollar per barrel
– Japanese Stocks Have Crashed Over 1000 Points Since Friday
– Argentina Crashed 7% today
SGX Nifty trading below 7800 levels.
– PIMCO clients withdraw $23.5 billion after ‘Bond King Bill Gross exit from PIMCO

Nifty Futures Hourly Charts
Nifty Hourly

Nifty and Bank Nifty futures turned to positional sell mode on 23rd of September and currently the resistance zone comes around 8105.73 and 15840 respectively reverse your position to positional buy mode if the resistance zone breaks on the hourly charts.

Bank Futures Nifty Hourly Charts
Bank Nifty Hourly

India VIX Hourly Charts
After a prolong sell mode in India VIX finally there is some volatility on cards and turned to positional buy mode and currently the support zone for India VIX comes around 10.87 and we can expect a little descent increase in volatility in the upcoming sessions.
India VIX

Nifty Open Interest Build Up
The Higher open interest build up is seen in 7800PE and 7800PE writers believe market might take 7800 for october month expiry. As nifty is expected to open gap down on coming monday it is good to monitor the 7800PE open interest at close. unwinding of open interest in 7800PE could be a sign of further downtrend on contrary maintaining the open interest built up could take 7800 as EOD support for current month expiry.

Open Intest

Case Shiller Index
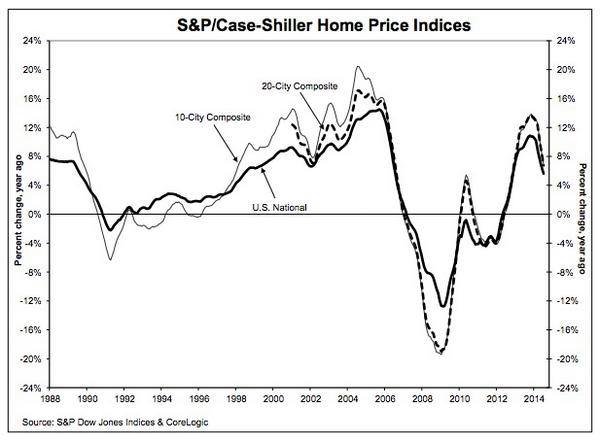
For the 3rd month in a row, S&P Case-Shiller home prices fell MoM with July’s 0.5% drop the biggest since November 2011. This dragged the YoY growth to 6.75% (missing expectations of 7.4%) and its slowest rate of increase since November 2012.
case shiller

Exchange Related News
NSE revises Nifty Futures and Options lot size from 50 to 25 and Nifty Midcap 50 Futures from 150 to 75 with minimum value of INR 200,000 as per SEBI. India VIX futures got revised from 550 to 800 with minimum contract size of Rs. 10 lakhs for India VIX* futures. Lot size revision will be effective from 31st Oct 2014 onwards. The Impact is Margin get back to normal for single lot as nifty almost doubled. Invites small players. People Trading in Per Lot based Brokerage houses have to pay double brokerage for same level of current exposure in Nifty.

Related Readings and Observations

The post Nifty Weekly wrap up and Global Sentiment appeared first on Marketcalls.

Supertrend High-Low Breakout Strategy – Amibroker AFL code

$
0
0

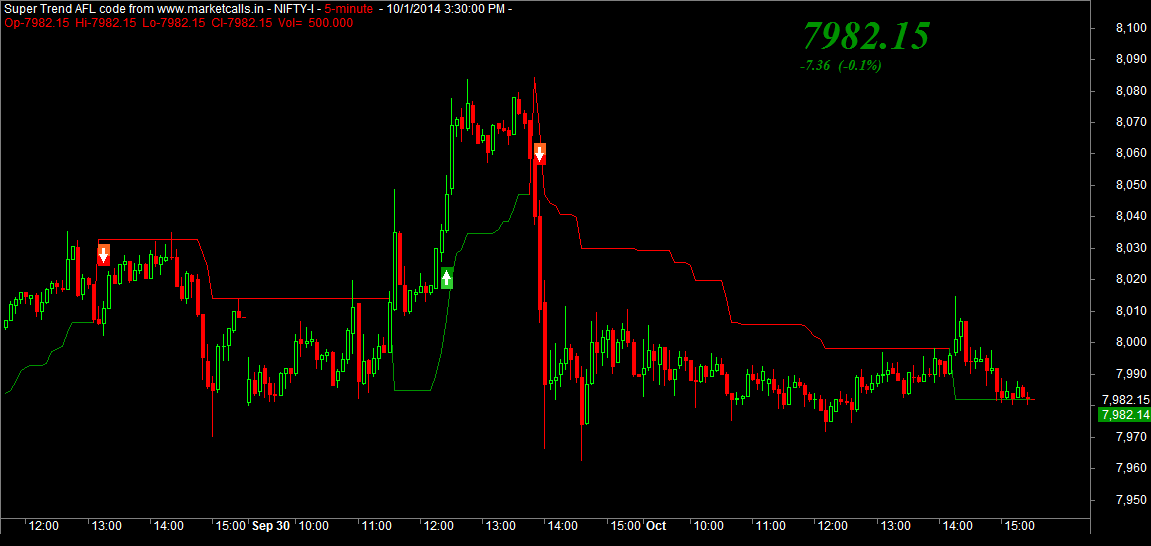
The Traditional Supertrend strategy is buy whenever the trailing stoploss breaks on the higher side and reverse to shorts when it breaks on the lower side. And the Buy or Sell Decision is taken on the close of the candle.

Supertrend High Low Breakout

Now how to create a strategy where when the supertrend turns to buy mode and the reference high is marked at the time of supertrend turning to buy mode. But still the actual buy will come only if the high is taken out on the upper side. Similarly when the supertrend turns to sell mode and the reference low is marked at the time of supertrend turning to sell mode. But still the actual buy will come only if the low is taken out on the lower side. When the Reference High or Low is not broken yet then the old position(Long or Short) continues.

It is just a prototype strategy to demonstrate how such logical conditions can be incorporate in your strategy to bend the system the way you required.

Why Such a Strategy?
When there is a high volatility in the market and when your supertrend signals comes at huge spike then probably some of the cases you will end up catching the signal at the peak. Most of the Big Gapup and Gap down and then a sharp reversal without taking a newer high or newer lows in such a scenario you will be end up saving a few bucks in your strategy. However it has it own disadvantages too as it delays your trading position to take at a little higher price every time as it waits for reference high or low breakout.

Steps to Install

Download Supertrend High-Low Breakout – Amibroker AFL code
2)Unzip Supertrend High-Low Breakout.zip to local folder
3)Copy Supertrend High-Low Breakout.afl file to \\program files\\amibroker\\formula\\basic folder
5)Open Amibroker and Open a New Blank Chart
6)Goto Charts->Basic Charts and apply/drag-and-drop the Supertrend High-Low Breakout code into the blank chart
7)Bingo you are done. Now you will be able to see the Supertrend High-Low Breakout system with Buy and Sell signals.

Related Readings and Observations

The post Supertrend High-Low Breakout Strategy – Amibroker AFL code appeared first on Marketcalls.

Let Your Child Open a Bank Account and Operate Independently

$
0
0

The opening of accounts for the minors was in practice for many years. However, previously the accounts were started with mother as the guardian. The operation of the accounts was handled by guardian. The savings, deposit and Recurring Deposits each account type was permitted. However, there was no scope for individual account for the kids. With the new ruling from Reserve Bank of India (RBI) that restriction is withdrawn. The new directive from the RBI is allowing the children above ten years to open account in different national and private sector banks across the country. The process of operating of the Bank account is conducted independently without indulgence of their parent.

Child Bank Account

The reason of the change

The chairperson of an acclaimed nationalized bank stated that present generation of children is quite apt in using the varied technologies developed. They are user-friendly with technologies of computer and internet. Moreover, many of them are having accounts under guardianship. The smart generation is capable of handling their money. Thus, this new initiative is taken by RBI. It is directed that the accounts will be free of penalty in case of non-operative mode. However, overdrafts cannot be taken from this account type. Furthermore, there will be a limit on withdrawal for each month. The withdrawal amount will depend on individual banks.

The services designed for the minors

The account opening is not the only service that will be presented by the banks. There are other services included in the list. The aspect of internet banking will be activated for minor accounts. The cheque books will be issued and the children will even receive the facility of ATM or Debit card. However, there safety rules depicted to protect the interest of the accounts. The facility of involving a guardian in handling of the account is kept active. The same account can be used by the customer after attaining majority. However, she or he has to resubmit the KYC or Know Your Customer Form to keep the account active.

The aspect of safety

The main frame of safety measure is the KYC forms. The banks are quite strict about submission of this form. It ensures the legal validity of the customer to open and operate an account. The banks take in-depth measures in ensuring that each account is valid. Moreover, the depositing amount in the account is restricted. However, no fine can be levied for non-maintenance of the minimal amount in the account of a minor. Many banks are considering this as a positive step. However, some are worried about the non-chargeable aspect for the non-operative accounts. The bank personnel stated that this will increase the cost of the other services that are presented to the customers.

The other aspects

Many banks have already started their minor account services. This new directive will make the younger generation more inclined towards the banking sector. It also induces the aspects of saving and investment in the young ones. Moreover, it is a nice way to introduce children to the necessity of responsible spending. Many pare

Related Readings and Observations

The post Let Your Child Open a Bank Account and Operate Independently appeared first on Marketcalls.

Things you need to know about PF Portability and Universal Account Number (UAN)

$
0
0

The Benefits Of PF Portable Account Along With Universal Account Number (UAN)

It is a necessity for every organization to present the employees with the PF account. Each time someone changes their job, they have to change the PF account number. Now, this is a daunting task and involves lots of paperwork. Thus, to ease the hassle a new format of Universal Account Number or UAN will be launched this year. With the help of UAN, there will be no need for the employees to initiate a new account each time they change their job. Now, they will be able to manage the funds under a single account. This format is developed following the core banking pattern.

Universal Account Number

Knowing in details

This portable feature of the PF account will give rise to smooth money transfer for the employees. There is a new website launched for this purpose. The process is digitalized to help the employees with easy operation process. The account holders can easily apply and view their status with the help of the website. Furthermore, they can also update their details after joining a new job. This initiative is taken by Retirement Fund Body Employees Provident Fund Organization or EPFO. This facility will be available for about 4 Crore account holders of this organization. This account numbers will be valid for the entire active employment life for a person.

The allocation of the number

The UNA will be given once to the employee in the entire employment career. While changing the jobs, the account holders will not be provided with a new number. They will be given a member Identification number. The ID will be linked directly with their UAN number. The employees can present the new ID number to the organization upon joining. However, in case the member ID is not available, then they can visit the official website to create new ID. They can also take the help of the HR department of the new organization to get the ID. It will prove to be extremely helpful for the employees while changing jobs.

The process of checking status

In this new process, the UAN numbers are provided directly to the employers. You can get your account number from your present organization of employment. However, if they are unable to present you with the status of account, then you can take the help of the official website. The process of checking the status for the UAN is hassle-free and easy. To know the account status, the employees have to present their PF number of the present working organization. They will have to present establishment code. The number will be shown to you if it is generated or else required message will be given.

Exploring the details

The progress of EPRO is taking place at a rapid rate. It has already captured the details of the account for about 1.80 Crore employees. Within few months, the entire system will be operational for its complete employee strength. The basic information each employee needs to submit are the documents for PAN, Aadhar and KYC. The entire data will be uploaded in the official website.

Related Readings and Observations

The post Things you need to know about PF Portability and Universal Account Number (UAN) appeared first on Marketcalls.

How to find the Right Price of any Stock – Value Investing Unleashed – Part I

$
0
0

value investing

VALUE INVESTING in Stocks UNLEASHED.( In today condition you are going to buy MARUTI @4000 per Share – YES/NO).

Which is a better value – a stock selling at 500 Rs/- per share or a stock selling at 1300 Rs/- per share? (Same sector) If your answer hasn’t already sprung to mind, be aware. The correct response is not the 500 stock. Nor is it the 1300 stock.

The correct answer is that you can’t tell. You can tell which is a lower priced stock. But “lower price” isn’t always synonymous with “better value.” With the limited information I provided about these two stocks, you cannot make an informed decision about which is the better value. Share price is an important consideration when investing in stocks, but it’s only one of two important factors to evaluate. The other vital factor is underlying business value.

If I went to the grocery store and purchased two items—one for 500 and one for 1300 —and asked you which was the better value, you would say, “Well, that depends. What did you buy?”

If I told you that I bought One KG onion for 500 and a 10 Kg box of Olive Oil for 1300 Rs/-, you’d quickly recognize that I probably paid far too much for the onion, but got a great bargain on the Olive Oil.

The price you pay for something—whether onions or Olive Oil or stocks—is only relevant as it relates to its underlying value. This is the essence of value investing, that is, purchasing shares of a company at a price that is substantially lower than the company’s underlying value.

Some people believe there is no difference between share price and business worth. They believe that if you buy shares of stock in a company for 1800 Rs/- a share, they must be worth 1800 Rs/- a share. I disagree. I believe price is what you pay; value is what you get. As cited earlier, it’s the same concept when bargain hunting at the grocery store.

In practice, applying the value-investing philosophy is straightforward.

Find companies with measurable worth. When their stock is selling at a price below that worth, buy it. In time, as others recognize these values, the stock’s price likely will rise. When that happens, sell it and redeploy the proceeds to other undervalued companies.

Adherence to this approach has produced solid results for many long term investors.

THE MARGIN OF SAFETY


For value investors, the margin of safety represents the difference between a company’s stock price and the value of the underlying business of that company, often called its intrinsic value. Generally, value investors are not interested in stocks that trade at a slight discount to their underlying value. Rather, they seek a substantial discrepancy. Why? They are looking for solid companies whose stock prices are selling at “pennies on the Rupees” compared with the intrinsic values of the businesses they represent. Value investors believe that a large margin of safety provides greater return potential as well as a greater degree of protection over the long term.

Most of Experts believed that purchasing stocks at sizable discounts would protect investors against permanent loss and allow them to dispense with the need for making accurate estimates of the future.

Important Point – (Fundamentals of company Must be consider i.e FT in 2013)

That a company’s intrinsic value does not change that often and certainly not as frequently as its stock price, which may change from day to day and moment to moment.

In addition to the company’s intrinsic value, a value investor’s required discount to that intrinsic value. In other words, this is the gap between the intrinsic value and the price at which shares of the company would be purchased. Keep in mind that when

purchasing shares, I seek a significant discount to intrinsic value, otherwise known as a large margin of safety.

Real time Observations: You’ll notice the stock price rises above and falls below the company’s intrinsic value. These price fluctuations create opportunities for value investors. When the stock price of the company falls sufficiently below the intrinsic value, it creates a buying opportunity. The shaded area between the company’s stock price and its discount to intrinsic value present when value investors should consider purchasing the stock.

Value investors expect that over time, as others recognize the true value of the company, its share price will climb toward its intrinsic value. As this happens, the margin of safety shrinks. When the share price equals or exceeds the company’s intrinsic value, the margin of safety has disappeared and the shares should be sold.

The logic of this approach may appear obvious: buy stocks at a bargain price and sell them after the price has gone up. However, investment decisions are not made in theory.

They are made in an ever-changing environment where logic can be overshadowed by emotion. I’ll address this point in greater detail throughout the article and offer guidance on how investors can help protect themselves by maintaining strict adherence to this value-investment principle.

Often, it takes a great deal of conviction to stick to value-investment disciplines, especially when a company’s stock price declines after you purchase its shares. For those who focus only on price, share price declines can be devastating emotionally. Even worse, this can lead to bad decisions, such as selling just because the price is down. Some market participants only focus on how much a stock’s price has declined in the short term. However, for long-term investors who evaluate share price in relation to business value, price declines can represent tremendous opportunity.

To me, investors are those who have the confidence and patience to back their judgment by buying stocks that they are prepared to hold for 2 – 5 years or more if needed. If you are looking for a quick way to turn a profit in the stock market, this Article is not for you. Value investors do not focus on day-to-day oscillations in share price. They adopt and maintain a disciplined approach for evaluating business value.

They are confident of their research and analysis and patient in implementing their strategy.

VALUE AND GROWTH INVESTING

In recent years, it’s become more popular to classify investors’ approaches as being either “value” or “growth.” These have become accepted as being polar opposites,almost like taking sides in a sports event: do you support “value” or “growth”? You may not be surprised that I reject this popular approach to classifying investment styles. Value and growth are not enemies, nor are they based on incompatible beliefs. For investors (in contrast with speculators, whom I’ll address below), company fundamentals support either a value or a growth approach to selecting stocks. I believe that value investing is the more profitable discipline in the long term, but there are many successful, fundamental growth investors. However, most speculators consider themselves “growth investors,” and it’s among this group that I expect to see a high failure rate.

Even at the stock level, let’s be clear. I do not believe in classifying stocks as value or growth. Often, such generalizations reflect guidelines imposed by index sponsors and have little or nothing to do with fundamental analysis at the individual company level. During my 10+ years of practical investment experience, I have investigated companies all over the world in every sector and industry. With the goal of uncovering investment opportunities that offer the greatest margin of safety, the search has led me to undervalued businesses in what many may perceive to be growth industries such as technology or pharmaceuticals.

I encourage you to discard any preconceptions you may have regarding value investing. It’s not a purely defensive tactic that should be applied only in bear markets. It does not focus exclusively on backward-looking businesses in dying industries. And values investors do not buy stock only in companies that “make things that rust,” as I once heard someone say. The diligent value investor searches for promising investments offering a large margin of safety—in whatever country or industry they may be.

Many times, I see promising businesses behind what many people call growth stocks: solid, well-established companies that offer quality products or services. But I will not consider them for purchase if their stock prices far exceed their underlying business worth—in other words, if they offer no margin of safety.

Near the peak of the Internet stock mania in early 2000, share prices for various dot-com or “New Economy” companies (many of which were not solid or established and offered unproven products or services) were leaping to successive record highs. At the same time, share prices languished for “Old Economy” companies in industries such as insurance, utilities, and manufacturing. At that point, some market participants mistakenly believed that New Economy growth stocks were stocks that went up, while Old Economy value stocks were those that went down.

Returns for value and growth stock indices appeared to support this notion. By the end of March 2000—even as technology stocks began their retreat—the Nasdaq 100, a measure of returns for the 100 largest companies in the technology-heavy Nasdaq Composite, had gained 108.7 percent in the prior 12 months versus only 13.3 percent for the venerable Dow Jones Industrial Average (DJIA). The DJIA measures returns for 30 major U.S. companies. Technology stocks, spurred by shares of start-up Internet firms, were soaring while it seemed the rest of the market was being left behind, some said “for good.”

In fact, many of the best-performing stocks at the time were initial public offerings or IPOs—companies that had never issued stock before. Of the 486 IPOs in 1999, about half were Internet-related companies that gained, on average, 147 percent their first day of trading

At that time, I believed this divergence between growth and value stocks represented the biggest two-tiered market bubble that I had seen since starting my career in 1998. I didn’t believe the gains were sustainable because the prices for so many stocks climbed to ridiculous heights—levels that were well beyond the intrinsic values of the underlying companies.

While I was scratching my head over the market’s ridiculous excesses, various firms was taking advantage of that environment by adding to their portfolios solid businesses trading at extremely attractive prices. Where as Expert Investors are more excited about the opportunities available for value investors, especially in the United States.

When the bubble burst in March 2000, the majority of dot-com stocks offered no margin of safety. In the wake of huge losses, market participants returned their attention to fundamental strengths and the “out-of-favor” stocks Most of firms had purchased during the Internet-stock run-up were once again attracting attention.

Their share prices generally rose while many of the highly touted New Economy stocks declined. I’ll share more insights on the Internet stock bubble throughout next Part of this series.

The Internet bubble illustrated one important difference between growth stocks and value stocks: Growth stocks tend to be accompanied by expectations for future earnings that are far greater than the average shown in the past. Such stocks are often in exciting new industries, about which there is a great deal of promise and optimism. During the Internet-stock heyday, you may recall all the articles that claimed, “this time it’s different” a statement I’d rank for reliability right up there with “the check’s in the mail.”

However, when it comes to future earnings growth, it is extremely difficult to project it with a high degree of confidence. Additionally, the farther out the prediction, the more likely it’s going to be off target. It is particularly questionable to build long-term forecasts of well-above-average growth in earnings for companies, as unforeseen competition will almost certainly arise to wrest away some of these hyper profits, making such predictions very unreliable. Value investors believe that the best approach is to focus on the current state of the business: what it would be worth now to someone who wanted to buy the whole company. This is a more conservative approach, recognizing the limitations of trying to out forecast other investors.

Off Season Sell

When comparing the value- and growth-investment styles, here’s a down to- earth example that simplifies the difference between these philosophies.

Go to a department store on a winter day and walk through the clothing section. You’ll see scores of shoppers looking at heavy coats, sweaters, and wool hats.

Since these items are in season, demand for them—and, therefore, the prices—will be high. Think of these shoppers as growth investors.

Meanwhile, over in a corner of the store will be a clearance rack full of swimsuits, tank tops, and straw hats. It’s winter, of course, and few people are interested in buying lightweight apparel. But every once in a while, someone will walk over and buy an item for pennies on the rupees. That shopper is a value investor.

The “buying straw hats in winter” analogy neatly captures two hallmarks of value investing: evaluating the true worth of an item (whether a hat or a stock) and purchasing it when it’s out of favor and its price is below its true value. As mentioned earlier, the soul of value investing is to buy company shares at a discount. The heart of the concept is simple. At any given time there are excellent businesses that attract a good deal of attention.

Meanwhile, other segments are overlooked by investors. These wall flower segments contain a wide variety of businesses in which investments could be made—if the price were right.

That is a common place observation. What is not so common place, however, is this: While many businesses are not worth what they sell for in the stock market, some businesses are almost given away. Like those straw hats in winter for the farsighted shopper, these are the types of companies, those with a significantly large margin of safety, that cause a glint in the eyes of value investors. Or they should. The way to find them is by looking internally, that is, at the performance of the underlying business and also at its resources.

The value investor pays little heed to factors that have no impact on business value: market or interest-rate forecasts, or day-to-day stock price fluctuations. By maintaining a strict focus on the relationship between business value and stock price at the company-specific level and largely ignoring the broader market’s fascination with short-term developments, value investors can exploit market behavior for long term gains.

SHORT-TERM THINKING

I once heard a comedian say, “Instant gratification takes too long.” No wonder there is no end to the parade of get-rich-quick investment schemes that surface on Dalal Street.

Back in the 1960s, visions of boundless wealth floated before investors with the advent of a new magic formula: synergy. Synergy meant that combining companies enabled management to make more profits, as the combined companies would work together increasing revenue while cutting shared costs. It became the driving force behind the craze to create conglomerates— large companies composed of a variety of often-unrelated smaller companies. In theory, synergy meant that under astute corporate management, 2 plus 2 could indeed equal 5. It worked for a while, at least in terms of the stock price, and at least until it became apparent to investors that the eventual total might not have been 5, and might even be closer to 3 Synergy was neither the first—nor the last—of such gimmicks. Indeed, as with most fashions, it comes back periodically. There were go-go stocks, the high-turnover performance game, market timing, and momentum investing. The popularity of momentum investing—the notion of buying stocks simply because they were going up—contributed to the Internet stock craze previously cited. The epitome of this was the “day trader,” hailed as a new profession in the late 1990s and, to my mind, the exact opposite of everything that investment means. What all of these schemes have in common are an obsession with short-term results, a complete disregard for fundamental business values, and the ability to cause major losses to speculators who jump on the bandwagon.

Sophisticated investors responsible for investing billions of dollars on behalf of others as well as individual investors managing their own portfolios have proved equally susceptible to these bandwagons. Both are prone to short-term thinking.

Many pension funds, for example, hire professional money managers and measure their performance on a quarterly basis, leading to short-term “hire and fire” decisions.

Inevitably, this encourages managers to chase what’s hot and disregard sound investment principles. In fact, the IPO bubble of the late 1990s was as much a product of institutional excesses as of the mistakes of individual investors.

Some pension funds, insurance companies, and other institutional investors have abandoned the practice of making an in-depth analysis of the companies they buy. Almost uniformly, a variety of strategies have been adopted that may differ in some respects but have one horrendous defect in common: they all reject the need or feasibility of making company-by company judgments about price and value or the need to examine time horizons or other factors that relate to the basic fundamentals necessary for long-term investing.

The combination of the age-old desire to get rich quick, plus the speed of today’s TV and Internet communication, means we are increasingly preoccupied with short-term events and short-term results. To borrow a few words from Sir John Templeton, a global money manager, “There is too much emphasis now on everything yesterday.” I think we are no longer as thrifty as we should be, and this is leading to more speculation, more danger, more risk. We are bombarded by data from an escalating

number of sources, such as 24-hour-a-day financial news on cable television, Internet Web sites, radio, newspapers, and magazines. As our appetites for information and expectations have increased, our ability to wait and anticipate has decreased.

Most people recognize that stocks are a good long-term investment, yet most people don’t hold them for long. Why? Part of the reason may lie in the mixed messages investors receive from professionals and the financial media. In one breath, investors are advised to stay the course and to hang on for the long haul. In the next breath, they are given a road map to short term riches and reasonable-sounding guides to switch paths and chase the latest fad.

I read one case study – The study suggests that mutual fund investors do not have a long-term perspective, which adversely affects their results. First, the average fund retention—or how long someone stayed invested with a particular fund— was only 2.6 years in 2000 (down from 2.8 in 1999, but up from 1.7 after the stock market crash in 1987). Second, when compared to corresponding indices, the lack of adherence to a buy-and-hold strategy appears to have hurt returns:

– The average fixed-income investor realized an annualized return of only 6.08 percent, compared to 11.83 percent for the long-term Government Bond Index.

– The average equity fund investor realized an annualized return of only 5.32 percent, compared to 16.29 percent for the S&P 500 Index.

If investors are to make money consistently, what is required is a return to farsighted, long-term investing. In my opinion, that is the kind of investing that promises rational investors the greatest potential for rewards over the long haul.

INVESTING VERSUS SPECULATION

What’s the difference between investing and speculation? What do I mean when I use each term? Why is this important?

“An investment operation is one which, upon thorough analysis, promises safety of principal and an adequate return. “Based on this definition, there are three components to investing: thorough analysis, safety of principal, and adequate return., “Operations not meeting these requirements are speculative.”

To this, I would add:

(1) Any contemplated holding period shorter than a normal business cycle (typically 2 to 5 years) is speculation, and

(2) any purchase based on anticipated market movements or forecasting is also

speculation.

Given what I’ve already addressed regarding value investing in this article (its focus on individual company analysis to determine intrinsic value, the margin of safety concept, and its success over the long term), it certainly meets expert definition of investing.

“. . . in the easy language of Wall Street, everyone who buys or sells a security has become an investor, regardless of what he buys, or for what purpose, or at what price. . . .”The financial media often refers to “investors” taking profits, bargain hunting, or driving prices higher or lower on a particular day. When I hear about such actions, I attribute them to speculators, not investors.

Investors and speculators approach their tasks differently. Investors want to know what a business is worth and imagine themselves as owning the business as a whole. Unlike speculators, investors maintain a long-term perspective—at least 2 to 5 years. They look at a company from the perspective of owners. This means they’re interested in factors such as corporate governance, structure, and succession issues

that may affect a company’s future and its ability to create wealth for years to come. Investors may use their voting rights to assist in enhancing company value over the long term. Speculators, on the other hand, are less interested in what a business is actually worth and more concerned with what a third party will pay to own shares on a given day. They may be concerned only with short-term changes in a stock’s price, not in the underlying value of the company itself.

The problem with speculation is simple: Who can predict what a third party will pay for your shares today, tomorrow, or any day? Stock market prices typically swing between extremes, stoked by the irrational emotions of fear and greed. These market swings became more pronounced in the late 1990s. In fact, there were 9 days in 1998 when prices for the S&P 500 Index advanced or fell more than 3 percent—after only 8 such days in the years 1990 through 1997 combined.

Volatility tended to be even higher in subsequent years, with the number of up-or-down-3-percent days coming in at 17 in 2002.

Such dramatic price fluctuation on a day-to-day basis can test long term investors’ mettle in maintaining their focus on business value.

Day-to-day price changes should hold little interest for the long-term investor, unless a price has fallen to the “buying level” that represents a sizable margin of safety. But that’s often difficult to remember when newspaper headlines, TV news anchors, friends, and coworkers are lamenting or lauding the market’s most recent lurch forward or back.

Wait for next VALUE INVESTING UNLEASHED Part-II series.

This article first appeared in Algotradingindia This post has been reposted with the permission of orignal author Mr Lokesh Madan

Related Readings and Observations

  • Shopper Stop : Long Term Outlook Shopper stop limited made an technical bullish breakout from triangle formation past week. The stock made its life time high at 572+ and closed the week at 547.25. The last candle is […]
  • Flow of Funds in Indian Financial markets Introduction During the post-independence period until the early 1990s, the financial system in India was characterized by a heavily regulated framework such as interest rate […]
  • Layman’s Guide To The World Of Insider Trading In the world of investment, the term of insider trading has created quite a buzz. It is a word that can be commonly heard from the investors. Well, this is such a term which means selling […]
  • Indepth Study On Exit Strategies For Traders By Lokesh Madan Trade Exit strategies are more complex in nature as compared to Trade In Strategies. It involves different types of analysis i.e Technical Based, Fundamental based& Quantitative based.

The post How to find the Right Price of any Stock – Value Investing Unleashed – Part I appeared first on Marketcalls.

How to Build a Portfolio – Your Trading Game Plan

$
0
0

Successful investment involves professional approach or systemic approach to save time ,ensure disciplined approach and avoid unnecessary repetition and  to prevents us from discretion  trading .Following steps are just example of my approach to building a portfolio.Any one can have his choice of contents under sequence of broad framework outlined below.

Frame work consist of

1.Trading Rules

2.Trading Method

3.Trading Strategy

4.Trading Plan

5.Risk Management

6.Psychology

This is simple template and adequate for systemic approach for small portfolio.

assessment-gameplan

What is Game Plan?

Every game has a rule ,so also the game of trading. Be cricket or football, every game have their set of rules which all players have to follow and rules are enforced by umpires or referee. In trading however ,the trader himself combines the dual role of player as well as referee and it is terrible most of times.Nonetheless a trader have to stick to rules once into the game, whatever may be emotional cost.Tested method then follow .Method such as offensive or defensive ,balling or batting depending on pitch and weather condition , no of overs or game format etc like in cricket .Then Planning after winning toss, fielding arrangement ,batting and balling order etc for structuring of game and players for optimal results.Strategy follows planning.

Once in the game ,unexpected do happen.Diferent conditions demand differing strategies.Fast ballers may have to be replaced with slow r spin ballers or line-length may have to adjusted or batting order is tweaked and so on

Yes risk management.fielding arrangement is changed when there is flood of boundaries or ballers are changed to control the average run rate.Finally Psychology.It involves overcoming fear when chips are down.Key is to handle pressure when the opponent is firing with all cylinders and your team being at receiving end has low morale ,motivation and in despair.Yes, to WIN, you have to stick to discipline of your plan.

TRADING RULES

  • Nothing new ever occurs in the business of speculating or investing in securities and commodities.
  • Money cannot consistently be made trading every day or every week during the year.
  • Don’t trust your own opinion and back your judgment until the action of the market itself confirms your opinion.
  • Markets are never wrong – opinions often are.
  • The real money made in speculating has been in commitments showing in profit right from the start.
  • At long as a stock is acting right, and the market is right, do not be in a hurry to take profits.
  • One should never permit speculative ventures to run into investments.
  • The money lost by speculation alone is small compared with the gigantic sums lost by so-called investors who have let their investments ride.
  • Never buy a stock because it has had a big decline from its previous high.
  • Never sell a stock because it seems high-priced.
  • I become a buyer as soon as a stock makes a new high on its movement after having had a normal reaction.
  • Never average losses.
  • The human side of every person is the greatest enemy of the average investor or speculator.
  • Wishful thinking must be banished.
  • Big movements take time to develop.
  • It is not good to be too curious about all the reasons behind price movements.
  • It is much easier to watch a few than many.
  • If you cannot make money out of the leading active issues, you are not going to make money out of the stock market as a whole.
  • The leaders of today may not be the leaders of two years from now.
  • Do not become completely bearish or bullish on the whole market because one stock in some particular group has plainly reversed its course from the general trend.
  • Few people ever make money on tips. Beware of inside information. If there was easy money lying around, no one would be forcing it into your pocket

METHOD

90% of the people in the stock market, professionals and amateurs alike, simply haven’t done enough homework.

The first step in learning to pick big stock market winners is for you to examine leading big winners of the past to learn all the characteristics of the most successful stocks. You will learn from this observation what type of price patterns these stocks developed just before their spectacular price advances.

It seldom pays to invest in laggard stocks, even if they look tantalizingly cheap. Look for, and confine your purchases to, market leaders.

What seems too high and risky to the majority generally goes higher and what seems low and cheap generally goes lower.

Investors cash in small, easy-to-take profits and hold their losers. This tactic is exactly the opposite of correct investment procedure. Investors will sell a stock with profit before they will sell one with a loss.

Out of the ways a company can achieve enormous success, thereby enjoying large gains in its stock price, is by introducing new products into the marketplace. We’re not talking about a new formula for dish soap. These products and companies have to revolutionize the way we live.

Cardinal Rule #1 is to sell short only during what you believe is a developing bear market, not a bull market.

The best way to measure a stock’s supply and demand is by watching its daily trading volume. When a stock pulls back in price, you want to see volume dry up, indicating no significant selling pressure. When it rallies up in price, you want to see volume rise, which usually represents institutional buying.

Those who ignore what the market says usually pay a heavy price. Those who listen and who learn the difference between normal and abnormal action are said to have a “good feel for the market”.

The number one market leader is not the largest company or the one with the most recognized brand name; it’s the one with the best quarterly and annual earnings growth, return on equity, profit margins, sales growth, and price action.

Scaling into a trade means to enter more than once, either at a better or worse price, and scaling out means to exit the trade in pieces. They are taking a casino approach, making a big number of small trades, each with a small edge, and this can result in tens or even hundreds of millions of dollars in profits each year

TRADING PLAN

When trading there is a lot of decisions to make: when to buy, when to sell, when to take profit, when to take a loss etc. If using your own judgment this might be tiresome and sometimes very difficult to execute. And for most traders highly unlikely to bring any success. Why? With so much decision making it requires a great intellect to beat the market. You have to fight the market, but also fight yourself. It’s so easy to do the wrong thing if you don’t have objective rules. These rules need to be backtested, of course

Elements of Plan which are to be laid down in advance

Entry level

Exit /Target level

Stop loss

Risk /Reward ratio

Execution should strictly follow the plan.Equity or finally profitability is function balancing between Win percentage and RR

TYPICAL TRADING STRATEGY

imagesCACBM5OB

It is just an example ,not exactly recommended.There are number of strategies available to chose from.You only have to back test and optimize as per your objective and plan.Strategy consists of as below.

Entry Strategy

The strategy trades daily breakouts away from the next friction level.

Buy if…

Today’s close price is higher than yesterday’s high

The distance to the next resistance is higher than the distance to the next support.

Sell if…

Today’s close price is lower than yesterday’s low

The distance to the next support is higher than the distance to the next resistance.

You can get creative picking an entry trigger, as long as the support and resistance rule is met. For example, candlestick patterns or price action patterns are also valid entry triggers.
Exit Strategy at a loss

Exit long trades at a loss when the price breaks below the closest support level

Exit short trades at a loss when the price breaks above the closest resistance level

Exit Strategy at a profit

Close the deal when you are 1/2 ATR in profit.

RISK MANAGEMENT

I make it a rule to never lose more than 7 percent on any stock I buy. If a stock drops 7 percent below my purchase price, I will automatically sell it at the market – no second-guessing, no hesitation.This is crucial for success of your portfolio.

Some people say, “I can’t sell that stock because I’d be taking a loss.” If the stock is below the price you paid for it, selling doesn’t give you a loss; you already have it.

Letting losses run is the most serious mistake made by most investors.

The whole secret to winning in the stock market is to lose the least amount possible when you’re not right.

PSYCHOLOGY

Excess fear does not allow one to give some room to rallying stock.We have to have staying power-The ability to hang on thru ups and downs during the life of the move as they never go straight up.Instead of being fearful ,one has to consult chart to know if this movement is normal or abnormal.A lot of pull backs or shakeouts are normal behavior of stocks.More aggressive the stock ,the more aggressive is pull back. Many investors caught in these pull backs as they are fearful.When you conquer fear and control emotions, you will see investment results change dramatically

Related Readings and Observations

  • Study Of Common Investment Habits The core challenge as an investor is setting aside instinctive physiological and emotional responses at the root of our brain’s decision-making processes. Though they are perfectly suited […]
  • Difference Between Trading Account and Demat Account Demat accounts are electronic account forms where you can store all the fund, equities and shares you have purchased from the stock market. Therefore, you need not keep all the share […]
  • When Day Trading Turn into Boxing My good friend Mr Murthy asked me one day to advise him what to do with 3000 Tata power stocks he purchased at Rs 90 and now that it fell to 79/-.Dilema and confusion have paralyzing […]
  • 3 Essential Benefits of Having Multiple Trading Accounts If you are a stock market enthusiast, then you have evolved with the trends of the stock market. Having strategies to fall back on when the stock market is volatile, is one of the […]

The post How to Build a Portfolio – Your Trading Game Plan appeared first on Marketcalls.

What High Frequency Traders Do – BAD or GOOD for Markets?

$
0
0

stock-trader

What High Frequency Traders Do – BAD or GOOD?

Over the past few Year’s, there has been a quick shift towards algo / Quant HFT based trading, Where as Asset managers make 24% return in market & HFT traders make 300% Return. Both among long-term investors using execution algorithms to lower trading costs and short- term investors automating market making and statistical arbitrage strategies. These short-term investors, popularly known as high-frequency traders (HFTs), account for a substantial fraction of total equity market trading volume. However, there is fairly little known about how their trading effects liquidity. To the extent that HFTs act simply as market makers, they will tend to improve liquidity. But HFTs also search trade and order data for clues about where prices will go in the future, and when they trade on this information, they may compete with long-term investors for liquidity, thereby increasing those investors’ trading costs.

In this article we also try to examines the extent to which HFTs profit from traditional asset managers’ trading by anticipating their future order flow & Weather HFT traders provide liquidity real time or fake way. Traditional asset managers, such as mutual fund and pension fund managers, typically split their large trades into a series of orders executed over the course of one or more trading days. They split their trades, because a series of small trades move prices less than a single large one. But in splitting their trades, traditional asset managers may reveal their trading intentions to other Trading Technology Experts investors who may end up trading ahead of or alongside the traditional asset manager.

To examine these issues, I examine return and trade patterns around periods of aggressive buying and selling by HFTs using trade data from the NSE Stock Market. Specifically, I focus on HFTs’ aggressive trades, that is, trades where an HFT initiates the transaction by submitting a marketable ( IOC or bidding process) buy or sell order, which are functionally equivalent to market orders, because it is a simple way to screen out liquidity providing trades ( Limit Order traders). I test whether HFTs’ aggressive share purchases predict future aggressive buying by non-HFTs, and whether HFTs’ aggressive sales predict future aggressive selling by non-HFTs.

HFT user react more fastly as compared to non HFT users.

I find evidence consistent with HFTs being able to anticipate order flow from other investors. In tests where Stock Futures are sorted by HFT net marketable buying at the some micro second horizon, the Stock Futures bought most aggressively by HFTs have cumulative standardized non-HFT net marketable buying of 0:66 over the following thirty micro seconds,) and stocks that are sold most aggressively have cumulative standardized non-HFT net marketable buying of 0:68 over the next thirty micro seconds. Moreover, the stocks Futures HFTs buy aggressively have positive future returns, and the stocks Futures they sell aggressively have negative future returns.( By using scalping Calculation various Time series based methods – HFT traders do so).

Taken together, these two results suggest HFTs’ aggressive trades forecast price pressure from other investors.( Actually HFT trades use CEP to analysis per Micro second Market Future prediction method by using various methods).

I consider and reject the most likely alternative explanations for these results.

To rule out the possibility the results are driven by HFTs responding to news faster than other investors, I rerun the sort tests excluding periods within few second of the publication of intra-day corporate news by Bloomberg Terminal. The results excluding periods around intra-day news are nearly identical to those for the full sample.

A second explanation is that HFT and non-HFT trading are driven by the same underlying serially correlated process (i.e., same trading signals), so HFT trading predicts non-HFT order flow only because it is a proxy for lagged non-HFT trading. A final alternative is that if non-HFTs chase price trends, HFTs might actually cause future trading by non-HFTs through their trading’s effect on returns. However, the lead-lag relationship between HFT and non-HFT trading is robust to controls for lagged non-HFT trading and lagged returns, which is inconsistent with the second and third alternative explanations.

I also examine whether there are cross-sectional differences in how well different HFTs’ trades forecast future order flow. Perhaps some HFTs are more skilled or focus more on strategies that anticipate order flow, while others focus on market making or index arbitrage. My evidence indicates that there are indeed differences among HFTs. Trades from HFTs that were the most highly correlated with future order flow in a given month have trades that also exhibit stronger than average correlation with future non-HFT order flow in future months.

DARK POOL and HFT Traders.

There are two types of market’s for trading one is displayed order book type & second one is non- displayed order book type. In 2009, NASDAQ’s market share was roughly 35% in NASDAQ-listed securities, and 20% in securities listed on the NYSE. The remainder of U.S. equity trading is spread among trading venues with displayed order books, such as the NYSE and BATS, and trading venues with non-displayed order books, such as ITG’s POSIT Marketplace, Credit Suisse’s Cross finder, and Knight Capital. Much of U.S. trading occurs on non-displayed trading venues. This part is not valid for Indian Exchanges – it also have both market type’s but large or most volumes are with displayed only order book where as some bulk deals are not visible to Order book in some cases. As you know dark pools are not allowed at India.

There was once a large difference between the market structures of different displayed markets such as the NYSE and NASDAQ. Trading on the NYSE was conducted in an open outcry trading pit, and while NASDAQ had an electronic order book with market maker quotes, brokers had to call the market maker on the phone to execute a trade. Now, displayed markets are all structured as electronic automatic execution limit- order books, and they largely compete on price. Though the NYSE still has specialists, now known as Designated Market Makers (DMM), they are for the most part the same electronic trading firms that make markets on other exchanges. For example, GETCO LLC, a large electronic market maker, became a DMM for 350 NYSE stocks in early 2010 (Kisling 2010) and is also a registered market maker on NASDAQ, BATS, NYSE ARCA, and the CBOE (McCarthy 2010).

Executions in displayed markets predominately come from professional traders. Few retail orders reach the displayed markets directly. Most retail brokerages have contracts with market making firms who pay for the right to fill retail orders. For example, in the third quarter of 2009, Charles Schwab routed more than 90% of its customers’ orders in NYSE-listed and NASDAQ-listed stocks to UBS’s market making arm for execution. Similarly, E*Trade routed nearly all its customers’ market orders and over half its customers’ limit orders to either Citadel or E*Trade’s market making arms. However, when there is a large imbalance between retail buy and sell orders in a stock, market making firms likely offload the imbalance by trading in displayed markets, so there is some interaction between retail trading demand and the displayed markets.

High-frequency traders account for a substantial fraction of equity market trading

volume. High-frequency traders are proprietary trading firms using high-turnover auto-mated trading strategies. Examples of such trade ring firms include Edelweiss Capital, Way2Wealth, Motilal Oswal Financial Services, Ltd. Angel Broking, India Infoline (IIFL), SMC Global Securities, Anandrathi Financial Advisor & many more. Such firms likely engage in some combination of market making and statistical arbitrage.

Data used By HFT Traders

Primarily HFT Traders Use High Speed TBT data at Colocation & for testing purpose they used Level 2 historical data.

How we Identify high-frequency traders ( Or HFT Trading Firms )

Mostly Prop shops with Colocations Setup with better low latency hardware’s / Low latency networking / Ultra Low latency OMS engines & more Interactive & TBT Links from exchange ( 400 messages links ) are fall under this category.

Or Trade records on exchanges include a Market Participant Identifier (MPID) indicating the broker/dealer making the trade. A broker/dealer may have multiple MPIDs that are used by different business lines or customers. A typical reason for a customer to have their own MPID is that they have sponsored access ( Colocation ID with Market making expertise). In a typical sponsored access arrangement, the customer handles connectivity with an exchange and has limited interaction with the broker/dealer’s trading system. Sponsored access arrangements are motivated by exchanges’ tiered pricing schedules that give better pricing to higher-volume broker/dealers.

Customers accessing exchanges through sponsored access agreements get direct market access and the lower fees of the larger sponsoring broker/dealer. These sponsored access customers tend to be large, active traders or smaller broker/dealers. One consequence of these arrangements is that it is possible to observe activity of sponsored access customers directly rather than at the aggregated broker level.

The data from NSE classifies market participants as either a HFT or a non-HFT.

Firms were classified as HFT firms using a variety of qualitative and quantitative criteria.

The firms ( Prop Shops with Colocation setup ) classified as HFTs typically use low-latency connections and trade more actively than other investors. Their orders have shorter durations than other investors, and they show a greater tendency to ip between long and short positions in a Market during a day. They are Volume driver’s.

How HFT Traders find the Asset class for its working.

A reasonable definition of the set of Asset classes traditional HFT Traders invest in is those in either most liquid products i.e Nifty 50 or bank Nifty or products those are not touch by most come Traders i.e Or Shares fall under those Index’s or they do Trading based Corporate news.

Or they do trading depends upon the Volatility on Asset classes – Small-cap stocks are slightly more volatile than mid and large-cap stocks. The standard deviation of small-cap stocks’ daily returns is 4.5%, compared to 3.5% for mid-cap stocks and 2.5% for large-cap stocks.

HFTs are relatively more active in large-cap Futures Stock & Index’s. Their median share of total volume is 14:8% in small-cap stocks, 29:2% in mid-cap stocks, and 40:9% in large-cap stocks. It is conceivable that since HFTs’ comparative advantage is reacting quickly to market events, they find more profit opportunities in Futures & Options for which quoted prices and depths update frequently.

How HFT Trades Take advantages of Trade imbalances.

There are two types of trade imbalances: marketable imbalances and buy- sell imbalances. The marketable imbalance is a common measure of buying and selling pressure .The buy-sell imbalance is simply shares bought minus shares sold and has been used to measure position changes of different investor groups

The simplest explanation of marketable imbalances is that they are essentially the number of shares bought with market orders minus the number of shares sold with market orders. There is actually no such thing as a market order in the NSE system, but any order to buy with a limit price at least as high as the best ask or order to sell with a limit price at least as low as the best bid is essentially the same thing as a market order. The party submitting such an order is said to have submitted a marketable order, and the trade executes immediately. If the marketable order was a purchase, the trade can be said to be buyer-initiated, and if it is a sale, the trade can be said to be seller-initiated. Subtracting shares sold with marketable orders from shares bought with marketable orders gives the marketable imbalance measure. If investors with resting limit orders in the order book are passive liquidity suppliers, then the marketable imbalance is an intuitive measure of trading demand.

Intra-day returns for HFT traders

Intra-day returns are calculated using bid-ask midpoints from two sources. The primary source for quotes is the National Best Bid and Best Offer (NBBO). The NBBO aggregates quotes from all displayed order books.This is the best definition of a market price, but one disadvantage is that due to latency between exchanges and data feeds, the time stamp on the NBBO feed is not guaranteed to be synchronized with the time stamp for NSE trade data. To ensure results are robust to misalignment of timestamps between the quote and trade data, I redo some results using the NSE best bid and best offer, or NSE BBO. The timestamp of quotes in the NSE BBO is precisely aligned with the timestamp of trade data. Creating the NSE BBO is computationally intensive, so I replicate only a subset of the results using the NSE BBO.

The quote feeds occasionally contain absurd price data. Every once in awhile, for a fraction of a second, the bid might be above the ask, or for a stock that typically trades at 125 Rs/, the best bid might be 0.25 Rs Tick . Returns calculated from such quotes do not accurately react changes in firm value. I use filters to screen out these prices. I remove quote updates where the bid is greater than the ask or where the bid-ask spread is more than 20% greater than the bid-ask midpoint. To fix an issue with bad pre-market quotes on the NSE, the last of which is used as a proxy for the opening price, I throw out the last price before the open if there is more than a 20% difference between the last pre-open bid-ask midpoint and the first post-open bid-ask midpoint. After the application of these filters at the tick level, the global minimum and maximum one-second returns across all stock days, reported as -37% and 70%. While extreme, given the number of one-second observations in the sample, they do not seem like they would meaningfully affect the results. One could apply a stricter filter, such as requiring that the magnitude of one-second returns be less than 20%, but I do not think this would meaningfully affect results.( Data Used 16 august 2013 for 5 NSE Stocks)

HFT Traders are Liquidity provider – Yes/No ..

HFT can play an important role as market makers, for example, generating trading volume on new electronic exchanges .Trade volume, however, is not liquidity but all too often mistaken for it. Liquidity means “there is a bid/offer on the other side when I need it, for the amount I need it (market depth) at a reasonable level (market breadth). Volume is not the same as liquidity, since volume is approximately like the product of liquidity x velocity, and a large volume does not necessarily imply a large liquidity. This is illustrated by the May 6 flash crash when a fundamental trader’s algorithm started selling based on previous trade volume, creating a positive feedback between its own selling and the trading activity of other market participants.

The same event also demonstrated that HF Traders can turn into significant liquidity takers; while they are liquidity providers when it suits them (they have no obligation to make quotes). This is also described as “flow toxicity”, when market makers provide liquidity at their own loss or when informed traders take liquidity from uninformed traders. In fact it seems HFT provides liquidity in good times when it is perhaps least needed and takes liquidity away when it is most needed, thereby contributing rather than mitigating instability.

A recent report showed that the frantic development of HFT has slowed down in developed markets, and there is a transfer of activity to emerging markets such as Russia, India, Brazil and Mexico where exchanges are beginning to revamp their systems to attract such players. Low market volumes and stiff competition have led to a sharp fall in “high-frequency”. This illustrates the fact that, as HFT market participants flock into a given market, the opportunities shrink, dispelling the possibility for further growth.

It is also conceivable that HFT liquidity is provided at the expense of other market participants. Short term traders may be specifically prone to herd to the same information, driving the price further away from its fundamentals .The more momentum traders there are in a market and the higher the diversion from fundamentals, the fewer fundamental traders survive, further strengthening momentum traders. Various equilibrium are possible between short and long-term investors. The question is what is the right mix of investment strategies and horizons that best serves the well-functioning of financial markets and ultimately social welfare?

by Lokesh Madan

Add me skype – lokesh.madan3

Related Readings and Observations

The post What High Frequency Traders Do – BAD or GOOD for Markets? appeared first on Marketcalls.


Nifty and Bank Nifty Hourly Charts Overview and Infosys Result

$
0
0

Infosys Q2 2014 Result – Key Highlights

  • Post Results Infosys up 6%. Watch the live Infosys future charts here to track price movements.
  • Infosys Q2 standalone net profit comes in at Rs 3365 crore against Rs 2326 cr in the same period last year
  • Infosys Board approves a bonus issue of 1:1 Bonus applicable to ADR shareholders also
  • Declares interim divided of Rs 30/share
  • Continue to hold guidance of 7-9% $ revenue growth in FY15
  • Gross addition of 14,255 employees during the quarter. 165,411 employees as on September 30, 2014 for Infosys & its subsidiaries.
  • Earnings: Q2 North America growth at 3.1%, Europe growth at 4.2% Earnings: Q2 attrition at 20.1%
  • Earnings: Revenues from India – which account for less than 3% of the company’s total revenues – declined 5.1%
  • has pledged Rs 254 crore for FY15 towards CSR through the Infosys Foundation.
  • attrition rate crosses 20% in second quarter
  • added 49 new clients during the period as against 61 clients in April-June period, taking the total number of active clients to 912
  • margin improved by 100 basis points to 26.1% as against 25.1% at the end of first quarter
  • Vishal Sikka : Signed 6 large deals with a cumulative value of $600 mn

Infosys Futures 5min Charts
Infosys Futures

Nifty Hourly Charts
Nifty Hourly

Nifty futures turned to positional sell mode on 23rd of September and currently the resistance zone comes around 8053 reverse your position to positional buy mode if the resistance zone breaks on the hourly charts. On Contrary Bank Nifty futures turned to positional buy mode yesterday during the second half of the trading session and currently the support zone comes around 15323. Reverse your position to positional sell mode if the support zone breaks on the hourly charts.

Bank Nifty Hourly Charts
Bank Nifty Hourly

India VIX Hourly Charts
After a prolong sell mode in India VIX finally there is some volatility on cards and turned to positional buy mode and currently the support zone for India VIX comes around 12.67 and we can expect a little descent increase in volatility in the upcoming sessions.
Indiavix hourly

Open Interest
The Higher open interest build up is seen in 7800PE. unwinding of open interest in 7800PE could be a sign of further downtrend on contrary maintaining the open interest built up could take 7800 as EOD support for current month expiry.
Open Interest

Related Readings and Observations

  • Will Nifty Sustain above 8000 till September Expiry? Surprisingly Mutual funds are the Net buyers consecutively for the last four months and had pumped a net inflow of closely 15464.5 crores right from May 2014 month onwards. It seems mutual […]
  • Nifty and Bank Nifty futures September Overview Nifty and Bank Nifty futures hourly charts is in positional buy mode and currently the support zone comes around 8034 and 15784 respectively. Reverse your position to positional sell mode […]
  • Nifty and Bank Nifty August Expiry Trend Update Nifty still holds the Positional Buy mode with the support coming around 7824. However Bank Nifty in the second session of of tuesday's trading turned to positional sell mode and the […]
  • Will Nifty Keep The Uptrend Intact? This week is expiry for derivative markets with dried up volatility and Nifty spot managed to close above 7900 on weekly basis for the very first time .India’s Q2 GDP data and Fiscal […]

The post Nifty and Bank Nifty Hourly Charts Overview and Infosys Result appeared first on Marketcalls.

Capture Profits by Fixing the Puzzle of Inter-market relationships

$
0
0

The Market is big and confusing.With Multiple stocks and sectors it can be overwhelming for an average retail Investor But by understanding how the different financial markets interact with each other, the bigger picture can become much clearer. Observing the relationship between stock market as whole comparing with bonds, commodities and currencies gives an absolute advantage for a Market player which will lead to a much smarter trade opportunities compared to single market/Asset analysis .One of the main reason why an average Indian investor loses is because a lack of understanding on what’s behind the market movements. Majority of the time as I noticed, Indian retail player is engaged with single asset analysis or failing to grasp what is the main mover behind the major trends, what’s worse in some cases are blindly sticking to their bias even when the market turns around it back

What is Inter-market analysis ?


There is a general order in which markets are linked together due to various factors like global economic policies,Interest rate cycles etc. By watching the country’s financial market as a whole (means currency,commodity,stock market and bond prices), we are better able to assess the direction in which a market is shifting. All four markets work together. Sometimes move with each other, and sometimes against.The reason to look the market in this way is to understand or grasp which is the major theme causing the market prices fluctuate with or against each other. By absorbing the main theme,we can make good trading decisions and capture better profits

Application- simple and easy


Oh! I got it – reading my former two paragraphs some might have already confused or thinking this is tough and complex rather some of you might be saying “this guy is creating a complicated way to analyse the market” No worries- Applying Inter-market analysis is very simple and easy.Once you start looking the markets this way, You really gonna love it and understand major reasons behind the price movements. The only  requirement you should have is some basic knowledge of how to look at the price chart

Let’s begin by looking at how commodities, bonds, stocks and currencies interact. As commodity prices rise, the cost of goods is pushed up. This increasing price action is inflationary and interest rates also rise to reflect the inflation. Since the relationship between interest rates and bond prices is inverse, bond prices fall as interest rates rise.Bond prices and stocks are generally correlated. When bond prices begin to fall, stocks will eventually follow suit and head down as well. As borrowing becomes more expensive and the cost of doing business rises due to inflation, it is reasonable to assume that companies (stocks) will not do as well Once again, we will see a lag between bond prices falling and the resulting stock market decline

Take a Look at US stock Dividend yields and Bond Yields How the correlation is unfolding(1954-2008)


dividend-yields-bond-yields-US

The currency markets have an impact on all markets, but the main one to focus on is commodity prices  Commodity prices affect bonds and, subsequently, stocks. The USD and commodity prices generally trend in opposite directions. As the dollar declines relative to other currencies, the reaction can be seen in commodity prices

Indian stock market have different tendency to the fluctuation in USD/INR which is visible in the following chart (Till 2008)

clip_image004

Inter-market analysis is not a method that will give you specific buy or sell signals. However, it does provide an excellent confirmation tool for trends, and will warn of potential profit opportunities

Inter-market analysis is a valuable tool when investors understand how to use it. However, we must be aware of the type of economic environment we are in over the long term, and adjust the relationships we will see accordingly. Inter-market analysis should be used as a tool to judge when a certain market is likely to reverse, or whether a trend is likely to continue Just go ahead pop the different market charts together and see how the relationship holds and let me know in comments what do you guys think about the recent market situations from an Inter-market view

Still not a profitable trader? Take up our professional course and turn around your performance, Learn ultimate and profitable trading strategies from an Institutional perspective, To know more contact arulbalaji184@yahoo.com

Related Readings and Observations

The post Capture Profits by Fixing the Puzzle of Inter-market relationships appeared first on Marketcalls.

Wealthcreator – Nifty Future Trend Analysis Lookup

$
0
0

Nifty

Markets playing seesaw one day 100 point up and another day 100 point down, it gets frustrating as a trader sometimes if you get such moves and on the contrary it gets rewarding for the newbie’s who rely purely on luck of buying or shorting as they get an escape out of there positions or even profits sometimes. Nevertheless this is not how professional trader’s will  trade.

THE TREND IS YOUR FRIEND & Trend is Short term down

The short term trend for Nifty Future is down the reversal point is above 8010 close till then the rally’s are for entering shorts with protective stops above 8010.

Friday’s trading session opened with a gap down and continued its downward journey after consolidating in tight range for the day. Nifty Future closed the week at 7886.8 after making the intraday high of 7948. Now ahead on 13/oct/2014 below 7870 the gates open for 7820-7800 once these levels are broken with volume the bulls will have to run for safety as it will be a bear’s frenzy and market could correct to 7650-7600 in coming sessions. major resistance at 8010 only above this bulls will be back.

Trading Strategy : Option traders can buy 7800 Puts with 8010 stop loss, FNO traders short Nifty future below 7870 sl 8010 tgt 7650
For more details you can write me at mohitjhanji@gmail.com or use comment section below

Related Readings and Observations

  • WealthCreator : Nifty Future Weekly Research Report A sharp correction and a rally has been seen the past week in FNO September Expiry. After making the high of 8176+ for the week the market plunged back down to 7884 testing its 50 day […]
  • Nifty Future Weekly Outlook 14th September 2014 Nifty Futures closes the week at 8137.85 after making the high of 8200 for the week. The Friday session however was a positive day. On daily chart the Nifty broken down from a Rising wedge […]
  • Nifty Future Research Report 18th Aug 2014 Nifty future closed the week on a positive note on weekly chart. Nifty future closed Friday’s trading session at 7803.70. Nifty future has been consolidating in a sideways horizontal range […]
  • Nifty Future Report Weekly View 4th Aug 2014   Technical Update : Nifty Future has been facing stiff resistance at 7830 levels.  As updated in previous nifty future report weekly view 7745 below bear's got active and market […]

The post Wealthcreator – Nifty Future Trend Analysis Lookup appeared first on Marketcalls.

Why To Check For Personal Loan Eligibility Conditions?

$
0
0

Rita Ghosh was short of INR 50,000/- to complete her purchases for her wedding trousseau. Yet, she had exhausted her existing financial resources and reached well over her credit limit to fulfil her wishes. That’s when someone suggested a personal loan to make her a happy bride. Upon considering various loan options, she decided to go with her bank where she receives her monthly salary. Yet, to her surprise she had been refused a loan by her bank. Rita was considered ineligible for a personal loan as she was only 22 years old and her bank offered personal loans to only those above 23 years of age. Should such a circumstance ever occur to you or your loved ones, it’s always advisable to compare personal loan eligibility conditions.

Loans

Comparing personal loan eligibility conditions

Rita faced the embarrassment and the disappointment of an incomplete wedding trousseau. Wedding plans can be overcome but other situations such as medical emergencies can be difficult to overcome, in case one is refused a personal loan.

Yes, life can be very uncertain until you read the fine print. One of the most critical factors that can impact your life is that very fine print, you chose to ignore. Banks go out of their way to attract consumers with their personal loan interest rates or attractive repayment facilities, yet they do not provide loan eligibility conditions. Here’s a look at what you should compare while browsing through the personal loan eligibility conditions:

  1. Compare the age criteria: Not all banks have the same age criteria. In the case of Rita, she missed the age criteria limit by a year which meant that she would be unable to complete her wedding trousseau as she wished. Such a catastrophe can be avoided, if she went with another bank who considered her eligible for the personal loan.
  2. Compare the minimum monthly salary: Take heed of the minimum monthly salary required to be eligible for the personal loan. This is a vital aspect that can make or break your financial plans.
  3. Compare other eligibility conditions: Check the requisite employment record, if you need to produce any. Compare these across banks, along with other vital components such as showing educational qualifications and residential proofs.


Rita chose to go with another bank that considered her as an eligible candidate for a loan. Remember to compare each and every aspect before you make a decision to consider a certain bank as ideal for a personal loan. This is particularly required while considering a specific loan option. Apart from comparing interest rates and repayment options, take personal loan eligibility conditions as a vital aspect for comparison.

Related Readings and Observations

The post Why To Check For Personal Loan Eligibility Conditions? appeared first on Marketcalls.

Silver Technical Analysis – Buying Opportunity Ahead

$
0
0

Silver (14.10.2014) lost more than 15% from july 2014 & probably looking for some relief now.

Now silver is trading around $17.46 area & as we can see on charts, silver probably building support from 161.8% Fibonacci retracement of the last upside move. This level could be consider as neckline for silver future movement & well supported by the candlestick pattern & oversold indicators.
 
On fundamental side, improving economic data as well as possible supportive move in gold boost the silver price.

silver

Based on above studies, silver possibly move to $18.50 & then $19.50 in coming weeks but need a stability above $17.60 before that while a day close below $16.65 will delay the forecast.

Note – Above technical analysis is not a buy/sell recommendation. For recommendations Contact Us 

MCX  levels ->    S2(7700)         S1(38230)        cmp(38800)       R1(39450)        R2(40700)

Related Readings and Observations

  • Silver Preparing For Upside Move – Technical Outlook Now silver is trading around $19.78 & as we can see on charts silver fall sharply with gold in last weeks, even little more compare to gold. Meanwhile it touched the 161.8% feb […]
  • GOLD & SILVER COMEX Weekly Outlook GOLD COMEX has stiff resistance @1355-1360$ levels. Markets Looks to be in Favor of Bulls and it Seems that Gold will breach its Immediate resistance Levels. Next Minor Resistance Level […]
  • Silver under trouble Chart shown is ichimoku weekly chart of silver. Immediately you can recognise that silver is very closely trading below the ichimoku resistance zone. Traders can initate shorts in silver […]
  • Capture Profits by Fixing the Puzzle of Inter-market relationships There is a general order in which markets are linked together due to various factors like global economic policies,Interest rate cycles etc. By watching the country's financial market as a […]

The post Silver Technical Analysis – Buying Opportunity Ahead appeared first on Marketcalls.

Viewing all 2070 articles
Browse latest View live