Quantcast
Channel: Market Calls
Viewing all 2070 articles
Browse latest View live

Flow of Funds in Indian Financial markets

$
0
0

Exchange

Introduction

During the post-independence period until the early 1990s, the financial system in India was characterized by a heavily regulated framework such as interest rate controls, a directed credit programme and strict entry rules to the financial markets.

In addition, money and capital markets were underdeveloped, and the budget deficit of the central government was automatically monetised by the Reserve Bank of India (RBI). Against this background, a macroeconomic crisis arose in the early 1990s. Due to a deficiency in the tax system and a significant proportion of unplanned expenditure in the fiscal sector, the budget deficit became persistent.

Furthermore, India had to rely on foreign debt in order to fill the saving-investment gap in the faceof a declining trend of external assistance flows in the 1970s.

The accelerating fiscal deficits led to a higher rate of inflation and a balance of payments crisis occurred in 1991. Since then, the government has launched a gradual financial reform programme as an integral part of its stabilization policies.

We starts with a brief overview of the current main regulations imposed on commercial banks. Then, the development of the financial markets in the pre and post-financial reform periods will be discussed, including the government securities market, the credit market, the money market, the stock market and the foreign exchange market. The impact of the liberalisation in the financial sector on the conduct and effectiveness of monetary policy will then be investigated.

Concluding remarks summarize the major effects of the financial reforms on the real and financial sectors.

Main regulations in the banking sector

All banks have been subject to a range of regulations and controls administered by the RBI. These include the following (RBI 2000b):

Cash Reserve Ratio (CRR): Each bank must keep a certain proportion of its deposit liabilities as cash reserves with the RBI. The CRR has been actively used as a policy instrument and has varied between 3% and 15% over the period 1951–94.

http://www.rbi.org.in/scripts/WSSViewDetail.aspx?TYPE=Section&PARAM1=4%0A

Statutory Liquidity Ratio (SLR): Banks are required to invest a certain proportion of their deposit liabilities in government securities or government-approved securities of public sector financial institutions. The SLR was set at 20% until 1963. Since then it has been varied within a range of 20% to 38.5%.

http://www.rbi.org.in/scripts/BS_ViewMasCirculardetails.aspx?id=6508

Priority Sector Lending Requirements: Following the1969 nationalisations, the government stipulated a group of priority sectors for bank lending, including agriculture, small industry and business and small transport operations. A mandatory minimum proportion of assets to be allocated to priority sectors was not specified, but in practice, about 40% of bank funds (net of cash and liquid assets) has been allocated to these sectors.

http://rbidocs.rbi.org.in/rdocs/PublicationReport/Pdfs/73748.pdf

Capital to Risk-weighted Assets Ratio (CRAR): In 1992 the CRAR was fixed at 8% to comply with international standards on bank capital adequacy under the Basel agreement. Prior to this, banks were often grossly undercapitalised because of the constraints on their balance sheets and on profitability which were imposed by the various controls.

http://rbidocs.rbi.org.in/rdocs/notification/PDFs/62CB300611FL.pdf

 Government securities market

There has been a structural weakness in central government finance, in that revenue generation has been lower than expenditure required. This led to a significant volume of government debt during the 1980s. The RBI automatically monetised the component of the deficit which was financed by the ad-hoc issue of 91-dayTreasury Bills, increasing the amount of reserve money. In order partially to neutralise the effect of deficit financing on the level of the money supply, CRR was frequently raised (it gradually reached11%in 1988, from6%in 1979), and also to facilitate the expanding government debt, an involuntary credit ratio by commercial banks under the provision of SLR was increased. Further, in order to keep the cost of borrowing from the market low, interest rates on government securities were suppressed: the Indian government manipulated government securities yields down by quoting the security prices below face value, besides captive market in credit allocation and the tax concession on the return of government securities supported the low level of theyie lds.

Fiscal reforms have taken place following the recommendation of the Chakravarty Committee 1985: the government was to finance its deficit directly from the market at market-related rates rather than through automatic monetization by the RBI. See the main reforms in the government securities market as follows:

1991 The maximum coupon rate on central government securities was raised to near-market rates.

1992–93 The system of selling 91-days Treasury Bills through weekly auctions was introduced.

The new instruments of 364-day Treasury Bills and dated government securities2 emerged at market-determined rates on an auction basis.

1994 The automatic monetisation of the Central government budget deficit through ad-hoc Treasury Bills came to an end. In 1997, the government’s temporary shortfalls in finance were replaced byways and Means Advances (WMA).

Although the reform started with the objectives of activating an internal debt management policy and for more effective monetary policy, it brought unintended results. The market-determined interest rates have led to an increase in interest payments, adding to the debt accumulation process during the last decade.Furthermore, the market-related interest rates of the risk-free government securities attracted banks to invest in them, reducing other financial investments. It appears that the unbalanced budget position in the Central government and the corresponding

policies form a vicious cycle and have adversely affected the credit market in India.

Credit market and banking sector

Credit in the banking sector was characterized as being a captive market in the sense that banks were forced to provide credits to the government sector or the government-owned financial institutions under SLR and the priority sector lending requirements. Combined with a high ratio of CRR, the usage of bank deposit resources at their own discretion was extremely restricted. For example, during the fiscal crisis in early 1990s with CRR and SLR being raised to the statutory maxima of 15% and 38.5% respectively, they had only about 45% of the resources and even out of this, 40% was allocated as loans to the priority sectors. Only the residual was allocated to the industrial sectors, despite the fact that bank financing was a prime external source of funds for the commercial sector due to a less-developed capital market.

Another disturbing feature was the structure of interest rates, which was complicated with about 50 lending categories and a large number of stipulated interest rates depending on the loan size, usage and types of borrowers. There was, therefore, a significant cross-subsidy between sectors: pre-emption5 of resources was at concessionary rates of interest; on the other hand much higher lending rates were imposed on medium and large industries. Interest rate differentials between assets and deposit liabilities in the banking sector may give an insight into the scale of the cross-subsidy. The mean annual interest rate differential between the government securities’ yields and deposit rates over the period 1951 to 1993 is 0.45%, whereas that between lending rates and deposit rates over the same period is 4.31%; (the 4.31% amounts to about a third of the mean lending rates). There is a relatively larges pre ad in the case of lending rates in comparison with the case of government securities’ yields. Yet, in general, there were ceilings on bank lending rates and credit flows were quantitatively restricted. Because of the low level of government securities’yields coupled with the ceiling rate system, the cost of funds (i.e. deposit rate) was repressed.

The nature of pre-emption coupled with administered interest rates, represented financial repression in the credit market and prevented sound banking practice;  (i) banks were unable to satisfy the credit requirements of the productive economic sectors, (ii) the restrictions on banks’use of funds affected their profitability, (iii) the reduced role of the interest rate as an equilibrium mechanism led to inefficient allocation of credit. In addition, restrictions on entry norms and the dominance of PSBs (public sector banks) constrained market forces in the banking sector.

The major financial sector reforms were undertaken with a view to encouraging competitive efficiency in the banking sector following the recommendation of the Narasimham Committee 1991. Themajor reforms involved: i) there duction of statutory pre-emption levels, ii) dismantling the complex administered interest rate structure, iii) laying down of capital adequacy requirements and iv) liberalization of entry norms for domestic and foreign banks. See the salient reforms in the credit market and banking sector set out below:

1992–93 The structure of lending rates for the commercial banks was simplified; the six categories of interest rates were reduced to four in 1992 and to three in 1993.

1994 Banks were allowed total freedom to set their own lending rates on bank advance over Rs. 2 lakhs in 1994 (1 lakh = 100,000).The interest rates on loans up to Rs.2 lakh were deregulated later in

1998 subject to small-scale borrowers being charged at not exceeding prime lending rate (PLR).

1997 The SLR gradually decreased to 25% from its peak of 38.5% of Net Demand and Time Liabilities in 1990–92 and concessional rates were replaced by market-related rates.

1999 TheCRR gradually falls to 9.0% from a peak of 15% in 1989–93.

1999–2000 TheBank ratew as lowered to 8.0% gradually from 12.0% in 1997, leading PLR to fall.

The financial sector reforms have had a significant impact on the banking sector.

A general scaling down of pre-emption by lowering the level of CRR and SLR has encouraged banks to manage their asset portfolio in a more market-oriented fashion. The deregulation of lending rates contributed to the banks’ profitability and so deposit rates were raised to attract investors. This also initiated interest rates as an equilibrium mechanism allocating resources in a more efficient manner in the credit market.

Along with the liberalisation, there was a movement towards a regulatory mechanism that would ensure the safety and solvency of the banking sector. In the last decade, an increased perception of risk was prevalent in the banking sector, especially after the South-East Asian and the Barings Bank crises. This was reflected in a shift of funds in favour of zero-risk investments; investments in government securities voluntarily exceeded the SLR during the 1990s, whereas the share of loans and advances in total assets showed a consistent decline over the same period.

The banks’ behaviour is consistent with prudent measures. By the end of March 1996, all public sector banks attained a CRAR of 8%.

 Other financial markets

The main reforms in other financial markets are listed below followed by commentary:

May 1989 Call money rates were effectively freed from the regulated rate and the grant of entry was given to all participants in the bills re-discounting market as lenders, also in 1993, the other financial institutions (OFIs) are permitted to join in the call market as borrowers.

June 1989 Certificate of Deposits (CDs) was introduced and it became a market-determined instrument in October 1993.

Jan. 1990 Commercial Paper (CP) was introduced at freely determined discount to face value.

1992 Beginning of relaxation of foreign exchange controls.

1992 The CCI (controller of capital issues) which had regulatory control over all capital issues was abolished.

SEBI (Securities and Exchange Board of India) was given statutory powers for regulating the security markets.

Issuers of securities were allowed to raise capital from the market without any consent from any authority either for floating the issueor for pricing it.

Sept. 1992 Foreign institutional investors (FIIs) were allowed unrestricted entry in terms of volumes of investment in the security market.

Dec. 1992 Reserve Bank’s Repurchase Agreements (Repos) was introduced.

March 1993 Exchange rate transitioned from a basket-linked managed float to market-based system via a transitional phase of dual exchange rate regime.

Until the late 1980s, the Indian money market was characterised by a limited number of participants, regulation of entry, limited availability of instruments and tightly regulated interest rates. The reform involved a phased decontrol and development of money markets with a view to the gradual integration among these markets.

The inter-bank call money market, which was the core of the money market until the late 1980s in India, was very active due to the high cash reserve requirement in India. After reforms, with the widening of the market through the participation of non-banking financial sectors and the introduction of CDs, scope for short term funds in the banking sector has expanded. This was reflected in the declining trend of the commercial banks to hold excess reserves. However, the deregulation of the interest rate led the call money rate to vary in a highly volatile manner; during the South-East Asian crisis when the Reserve Bank undertook a series of tight monetary policy measures to control liquidity conditions, the average call rates reached the high level of 50% in January 1998. The Repos were introduced so as to stabilise money market rates by influencing short-term liquidity. The Reserve Bank switched over from auction-based repos to daily fixed-rate Repos in November 1997 to provide signals to money market rates and to set a floor to call rates to impart stability to short-term interest rates. The introduction of Commercial Paper has widened the availability of short-term finance in the corporate sector, which can obtain funds at a lower cost than the cost of borrowing from banks.

During the pre-reform period, the stock market continued to suffer from serious deficiencies: (i) the prevalence of many unhealthy practices, (ii) the regulation of pricing and the high cost of issuing new shares,8 (iii) eligibility of interest payment of debt as an item of expenses vis-à-vis dividend payment. These factors discouraged corporations from raising funds by issuing new shares and thus a relatively high debt-equity ratio for Indian companies was the consequence.

In the post-reform period, issuers of securities have been allowed to raise capital from the market without any consent from any authority either for floating the issue or for pricing it. Deregulation of the primary issues market led to a substantial decrease in the cost of raising funds in the capital market, and resulted in a significant shift in capital structure for the corporate sector; in 1992–93 the equity share constituted over 20% of the total sources of funds from 7.8% in 1991–92, and during this time an unprecedented upsurge of activity was experienced in the stock market; the BSE (Bombay Stock Exchange) Sensex increased by 266.9%. A further step was taken to strengthen the entry norms and disclosure standards to ensure the quality of the issues in the rapidly growing market, for which SEBI (Securities and Exchange Board of India) guidelines were set up.

The experience of the external payments difficulties of the early 1990s highlighted the weakness of the debt-dominated capital account financing in India. This has brought out a policy of fully fledged liberalisation of the foreign investment regime since 1991. In particular, foreign direct investment flows have been encouraged with full repatriation benefits to foreign investors. Portfolio Investment in listed companies can be made by foreign institutional investors (FIIs) without any lock-in period for there mittance of the funds. At the same time , a market determined exchange rate and a relaxation of exchange controls were pursued in the post-reform period, aimed at the integration of domestic foreign exchange markets with foreign markets and more operational freedom for dealing banks. Also, significant measures have been taken in the direction of removing restrictions on imports and exports.

The evolution of the liberalisation in the foreign sector led to a considerable growth in the current and capital account transactions and has contributed to the overall balance of payments surplus since 1993–94. However, these external reforms were at the expense of an increase in domestic money supply. As is often the case in emerging markets, after the liberalisation there was a massive inflow of foreign funds into India generating excess liquidity. Against this, the RBI had to purchase foreign currency for domestic currency in order to avoid an appreciation of the exchange rate. This led to sharp increases in narrow money, consequently leading to a higher rate of inflation in the post-reform, for example, from 6% in 1989 to 14% in 1991 (CPI).

Monetary policy in India

The RBI pursues its monetary policy using the instruments of the Bank rate, OMOs (open market operations), CRR, SLR and Selective and Direct credit control.Before the financial liberalisation, open market operations as a method of monetary control were a useless weapon, plagued by the underdeveloped securities’ and money markets and administered interest rates. The effect of the Bank rate on other interest rates was also limited by regulated interest rates. Yet, the Bank rate may have influenced the level of money supply in a manner peculiar to developing economies. Due to the lack of substitutes for the short-term liquidity in the banking sector (for which re-discounting bills of exchange was a main source of short-term funds), the impact of the change in the Bank rate on the amount of credit might not have been trivial. The CRR, SLR and a selective direct control on credit were probably the main effective policy instruments. Since1973, the RBI raised or reduced the CRR a number of times to influence the volume of cash within the commercial banking system and thus influence their volume of credit. An effect of a higher liquidity ratio, SLR, for the part of government securities,9 is to reduce banks’ ability to grant loans and advances to business and industry, and is, hence, anti-inflationary.To the extent that there were few substitutes of credit, direct credit control also performed effectively during the pre-reform period. These features are probably common in other developing economies.

As a corollary to the financial reforms, the impact of the policy instruments on the financial markets has altered significantly. The liberalisation has initiated the transition from a direct monetary policy (i.e. CRR, SLR and credit control) to the use of indirect instruments (i.e. OMOs and the Bank rate) as the dominant tool of monetary policy. First, as other financial institutions and financial innovations develop, the CRR is seen as a tax on the banking system and its

effectiveness is eroded as there is a loophole to avoid the CRR, for example, an increase in the CRR leads banks to bid for more wholesale deposits. There is also pressure on RBI to reduce CRR to international levels and not to use it as an instrument of credit control (Datt and Sundharam 2000). Second, the initiators of the financial reform envisaged that open market operations were to be the principal instrument of liquidity management in India. OMOs are attractive among others in that the base money is adjusted within short periods of time without

incurring confusion in the financial markets and administrative problems in banks (Cargill 1979). The evolution of the auction system of government securities at market-related interest rates is an important step. Third, the liberalisation of the administered interest rates will vitalise the role of the Bank rate. Interest rates have been emerging as instruments of resource allocation and there would potentially be an interest rate channel of monetary transmission. Then, it is possible

that the Bank rate works as a signalling instrument of monetary policy by indicating the interest rate stance to all economic agents, as is the case in developed economies. For example, when India found itself in a severe liquidity position, the RBI reduced the Bank rate in 1999 and this prompted the banks to reduce the Prime Lending Rate.

There are, however, some fundamental weaknesses remaining in the effectiveness of monetary policies. First, the Indian financial market is disturbed by the existence of two markets, one organised and the other unorganised with the divergence in the structure of interest rates. There are borrowers who are entirely dependent on the unorganised market, especially in rural areas of India.A uniform implementation of monetary policy is difficult in the segmented financial market

(Agarwal 1978). Second, it is a cause of inflationary pressure. To the extent that the pressure is the result of the growth in bank financing, the RBI’ s general controls will have a positive effect, however, if it comes from the government’s deficit financing (or the shortage of goods due to supply shocks), the RBI’ s control has little effect. It seems that the latter has been the case in India (Datt and Sundharam 2000). Third, the overall effect of monetary policy via credit may be weak in India due to the relatively high currency-deposit ratio: the credit creating capacity is

limited. Fourth, India was often confronted with a dilemma of conflicting objectives; the need to restrict money supply, but at the same time the need to provide funds to certain sectors for the economic growth of the country. Accordingly, the conflicting policy measures of direct credit control (i.e. contractionary policy) and the reduction of lending rates (i.e. expansionary policy) were often implemented.

http://www.rbi.org.in/scripts/PublicationsView.aspx?id=14228

Lokesh madan

http://algotradingindia.blogspot.in

Related Readings and Observations

The post Flow of Funds in Indian Financial markets appeared first on Marketcalls.

Live Bank Nifty Options Open Interest Tool Launched

$
0
0

Bank Nifty OI

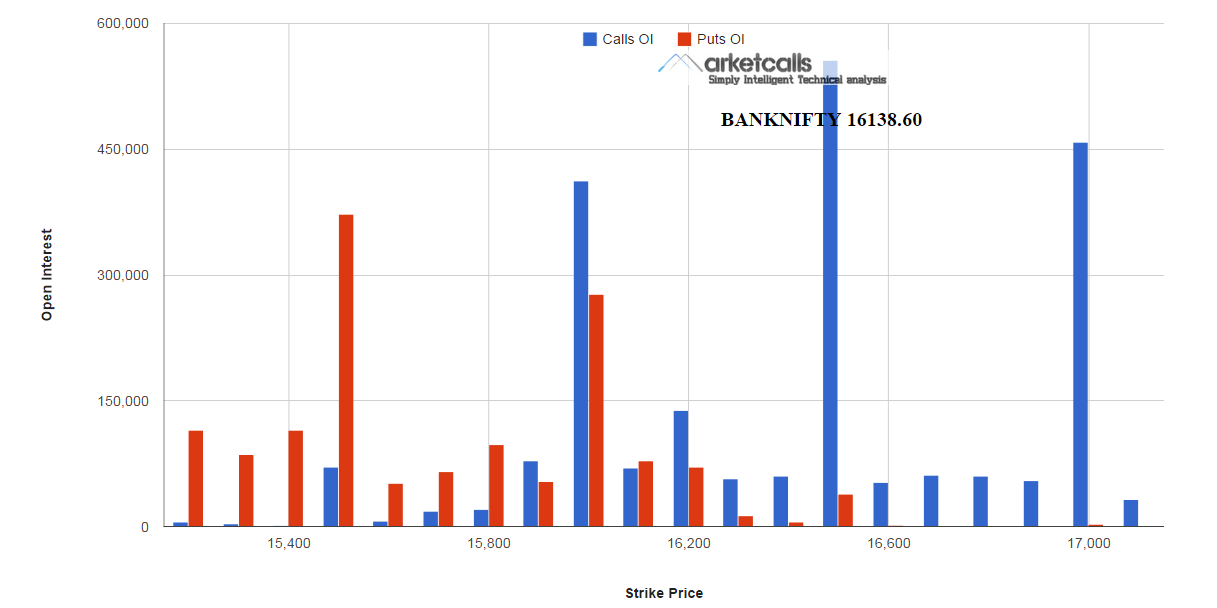
After getting couple of request from our readers Bank Nifty tracker is now added to our portfolio and running live. Now one can track and Visualize both Open Interest and Change in Open Interest for Bank Nifty. Now track the Bank Nifty Options on the go. Charts are responsive and optimized for mobile devices.

NSE Open Interest Tracker

Nifty OIBank Nifty OI

Related Readings and Observations

The post Live Bank Nifty Options Open Interest Tool Launched appeared first on Marketcalls.

September Index Futures and Options Outlook – Updated

$
0
0

Nifty september futures tested intraday high of 8200 on 9th September and fell close to a low of 8107. Currently nifty maintains the positional buy since 13th August and the support zone comes around 8074.51 reverse your position to positional sell mode if the support zone breaks on the hourly charts.

Nifty futures hourly charts
NIFTY

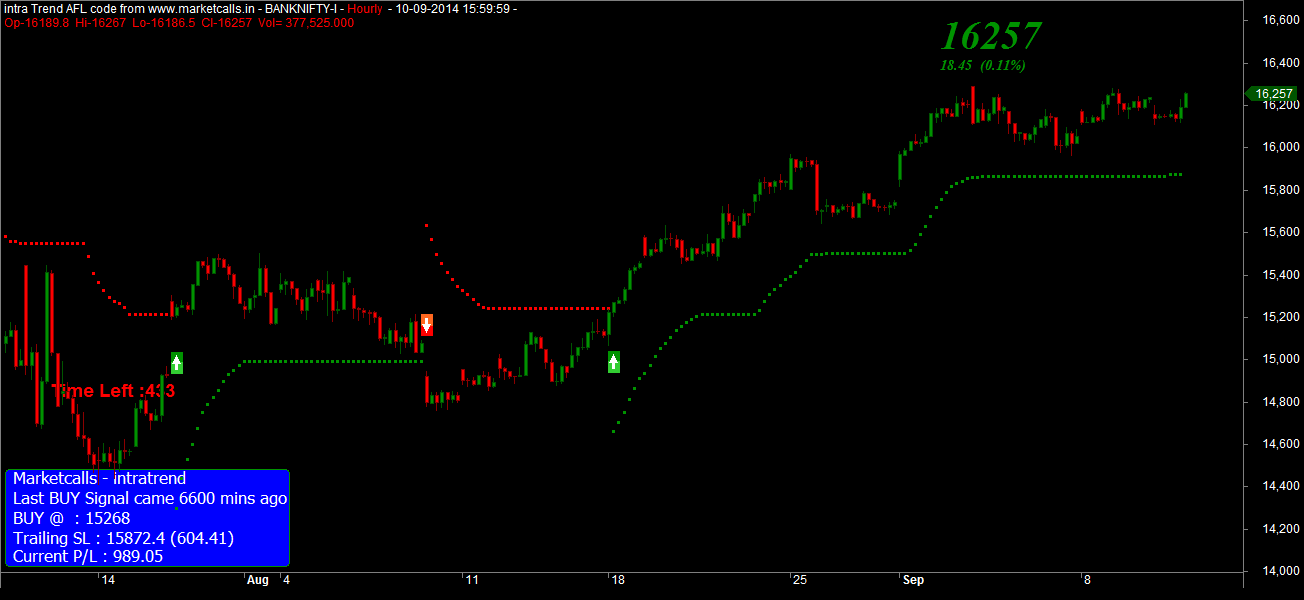
Bank Nifty september futures tested intraday 16295 on 9th September and still the steam in bank nifty futures remains and holds above 16200 level. Currently bank nifty futures maintains the positional buy since 18th August and the support zone comes around 15872.4 reverse your position to positional sell mode if the support zone breaks on the hourly charts

Bank Nifty futures hourly charts
Bank Nifty

Open Interest Details

Open Interest

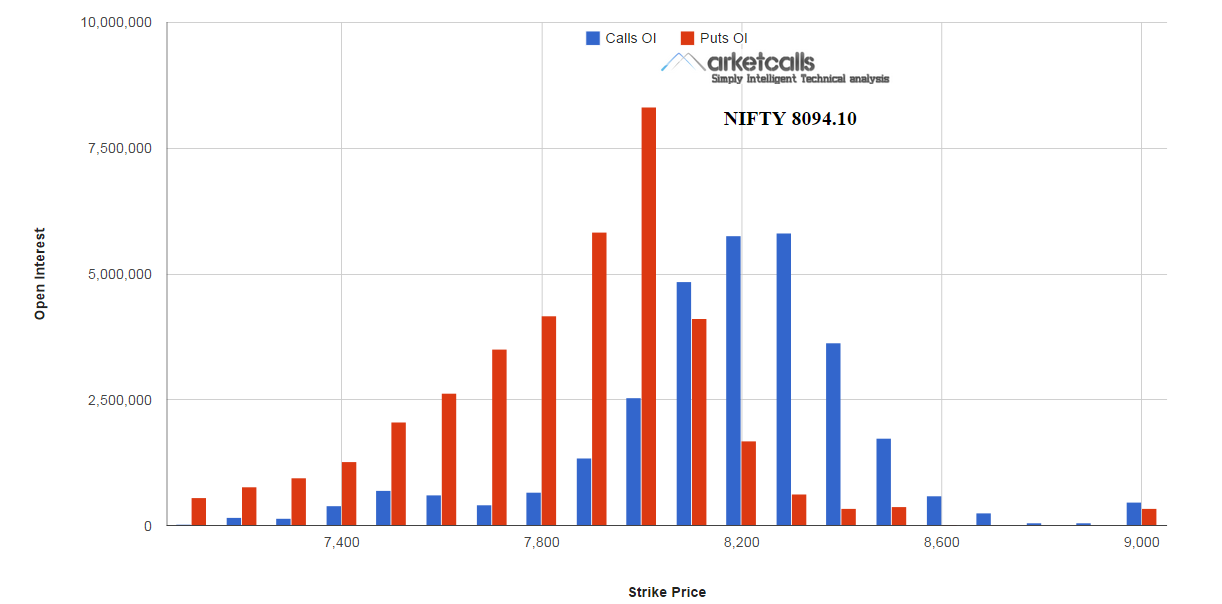
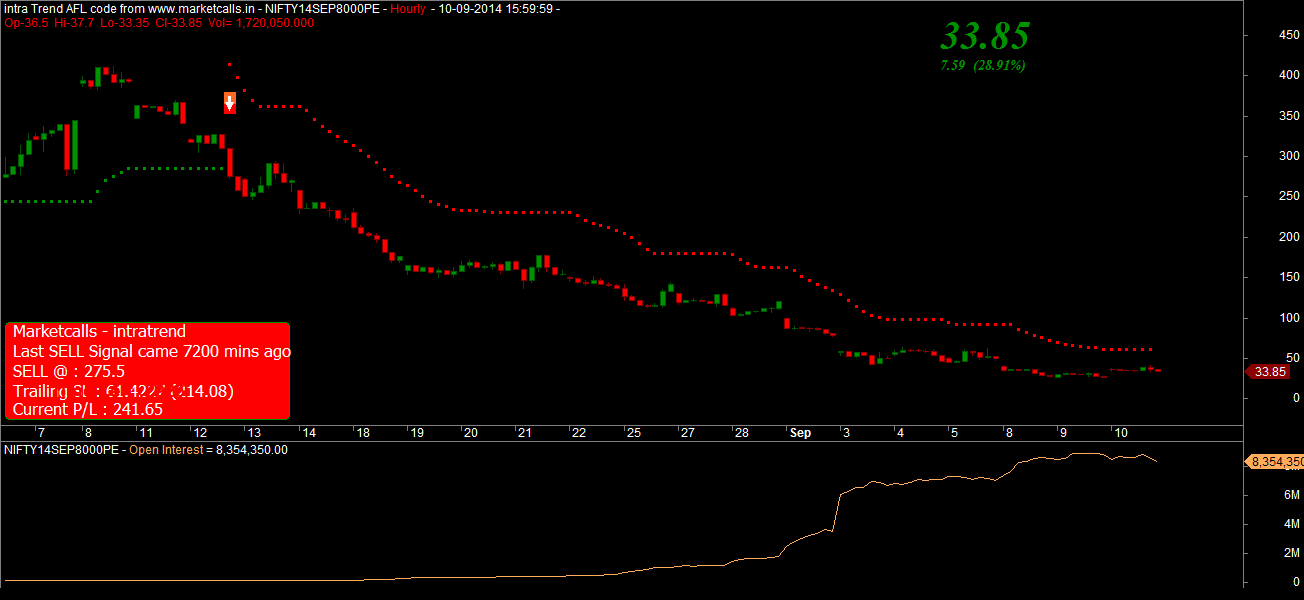
Still 8000PE open interest holds highest among the option strike price and holds right from the beginning for the option series. Looks Option writers are pretty strong in writing 8000PE options so far and they strongly believe that nifty will close above 8000 this september expiry.

Nifty 8000PE Hourly charts
Nifty 8000PE

Related Readings and Observations

The post September Index Futures and Options Outlook – Updated appeared first on Marketcalls.

Travelling Abroad Made Easy With A Multi-Currency World Travel Card

$
0
0

“The bill is 20 Euros – How would you like to pay?”

It’s the middle of the afternoon in Paris, and you haven’t got a clue about your finances to pay the bill. You’ve just had a scrumptious risotto and you cannot bear the thought of parting with little change that you had withdrawn a while back, as you will need it to buy your family a souvenir. Such a situation is barely hard to miss. When one is abroad, we all are in a state of a cash-crunch. No matter how much money is available at our disposal on international trips, we had to part with cash with ease.

Enter, the convenience of a multi-currency world travel card. It’s a card that can be used during emergencies, or allocated payments for a specific duration. If you can travel with a prepaid mobile bill, why not have a prepaid travel card!

A multi-currency world travel card at your disposal 

The world is more beautiful than one can imagine. With scintillating sceneries and historic locations, there are more places to take in than ever before. But, to take-in the beauty around you, you will need to enjoy the scenery in its true bliss. Enjoying these picturesque views can be truly memorable, if you don’t have to worry about not having enough money to pay for the trip. Not only that, the fear of paying the bills for an accident or a medical emergency can ruin most well-thought out international trips. Let’s take a look at all the important ways in which you can have an enjoyable stress-free holiday abroad.

Marketcalls image

  • Planning it in advance: Coordinate with a bank that offers the best facilities for prepaid cards, especially for foreign currencies. Banks such as Kotak bank offer a variety of multi-currency international prepaid travel cards. Select a limit and then proceed to applying for that card.
  • Multi-currency flexibility: Enjoy the convenience of having a card that is accepted around the world. Most exclusive banks offer such cards with the convenience of multiple currencies. Don’t hesitate to ask for a card that has multiple currencies.
  • Prepaid facilities at your disposal: A prepaid international cards can be taken at a set limit in order for you to take care of those emergency purchases when you need it most. It’s probably the most important factor that helps people in their time of need.
  • No more fear of no money at hand: International trips are often limited to a certain budget, but with a bankable back-up multi-currency prepaid card, you can be rest assured that you can travel without having to think about cash, when you need it the most.

Prepaid mobile cards, prepaid travel cards, the world will change as per your needs. Choose a bank that leaves you will the convenience of paying in any currency whenever you want, wherever you are.

To know more about Multi-Currency World Travel Card from Kotak Mahindra Bank, click here!

Related Readings and Observations

The post Travelling Abroad Made Easy With A Multi-Currency World Travel Card appeared first on Marketcalls.

Copper Technical Analysis – Multiple Support Zones

$
0
0

Copper (11.9.2014) traded as per our last report & after finishing the levels , fall back very quickly.

Now copper is trading around $3.0693 & as we can see on charts, its reaching to the lower tradeline current descending channel. However the momentum is very strong & it may break the channel , still few more indicators providing best opportunity for a shot covering at these levels. Current level represent 78.6% feb ret level while a most possible ABCD pattern is available at this point.

On fundamental side, improving US economic data may support copper for a while.

copper

Based on above studies, it is possible for copper to move upside for possible level $3.13 & then $3.17. However a day close below $3.04 will reject the forecast.

Note – above view is based on technical studies & do not represent our buy-sell recommendation. For recommendations Contact Us

Related Readings and Observations

  • Copper – Upside Move Ahead – Technical Analysis Now copper is trading around 6913 of lme & as we can see on charts, copper provided a false breakout below the lower tradeline of the ascending channel.However it was able to bounce in […]
  • Copper technical analysis – Time to sell? Now copper is trading around 7120 area on lme & as we can see on charts , with a top (probably false) above the tradeline copper trimmed its rally & looking for some downside move […]
  • Copper Technical Outlook for October Now copper is trading around $3.2928 & as we can see on chart, copper facing a resistance at topline of current descending channel which is also represent the 78.6% feb correction level of […]
  • Crude Oil Awaiting Bounce? Now Crude Oil is trading around $94.30 & as we can see on chart, as crude bounced back from $92.50 mark & this area providing support since may 2013. We have witness consecutive 3 […]

The post Copper Technical Analysis – Multiple Support Zones appeared first on Marketcalls.

Crude Technical Analysis – Corrective Bounce Ahead?

$
0
0

Crude (12.9.2014) fall sharply in last few weeks & reach to the $90 psychological level.

Now crude is trading around $92.40 & the bounce $90 mark is well  supported by many factors like 261.8% February retracement. , a lower trendline of descending channel as well as a very strong positive divergence. All this together providing a buying opportunity at current level.

On fundamental side , continue demand for sanction on russia putting a dent on crude production future.

OILDaily

Based on above studies , crude possibly move towards $94.80 & then $96.50. a day close below $89.50 will delay the forecast.

  MCX ->    S2(5550)         S1(5550)        cmp(5678)       R1(5740)        R2(5833)     


Note – Above technical analysis is not a buy/sell recommendation.

Related Readings and Observations

  • Crude Oil Awaiting Bounce? Now Crude Oil is trading around $94.30 & as we can see on chart, as crude bounced back from $92.50 mark & this area providing support since may 2013. We have witness consecutive 3 […]
  • Time for Crude Oil to Rise? Now crude Oil is trading around $98.30 & as we can see on charts, crude trying to bounce back from a ascending tradeline. This tradeline was able to hold crude downside move since june […]
  • Crude Reaching Reversal Zone Once Again. Now crude is trading around $103.60 & as we can see on charts, crude once again reaching to the resistance zone ,from where we already witness 2 reversal earlier. The candlestick […]
  • Crude technical outlook – crude on major support. Now crude is trading at $93.35 & as we can see on charts crude is sustaining above the lower trade line of long term ascending channel which made top $112 in last run. This tradeline […]

The post Crude Technical Analysis – Corrective Bounce Ahead? appeared first on Marketcalls.

NSE and BSE Windows 8 App Review

$
0
0

NSE Windows 8 App
If you had never explored NSE and BSE Exchange app in your windows 8 pc/mobile/tablet then it is a must watch for anyone willing to track the market on demand.

NSE windows 8 App has its own light weight and elegant APP to track the NSE indices and the ability to build custom watchlist (Equities, Derivaties, Currencies are supported) and pin your favorite stock/Trading instrument as a App in your start screen which updates automatically. Apart from that NSE app has a Gainers and Loosers dashboard, Monitor Individual scripts and the Market Status which indicates whether the markets are open are closed.

Click to view slideshow.

BSE Windows 8 App

BSE had differentiated a lot when compared to the NSE windows app. The differentiation comes from Turnover status of various BSE instruments(Stocks,Futures,currencies) and a heatmap of BSE constituents in the home screen, BSE announcements and Market Depth(5 levels of Bid and Ask levels) for individual stocks.

Click to view slideshow.

May be this stock watch is not useful for Full timetraders but definitely a good tool which given an overview about what happened in the market in a nutshell and mostly suitable for Investors and Part time traders and anyone who love to track the market on the go.

Related Readings and Observations

  • Windows 8 – Finance App – Review windows 8 finance app preview from marketcalls
  • Investment Picks for the year 2010 Here are the Few Shorter term Investment Picks with a possible potential of 10-15% upside returnsThese investment picks are purely selected based on various technical strategies. Involves […]
  • Positional Shorts/Longs in Dow USED Moving Average Crossovers : 1030min EMA & 70 min EMACharts Used : 5 day Charts, 5 min Bars Go Long RulesIf The faster line (red ) goes above the green - > Close shorts & […]
  • Make Your Mobile Phone Your ATM Card ICICI Bank's smsNcash, an online service facility is quite a secure, convenient and user-friendly method of sending money in forms of cash to any other person, located anywhere in India.

The post NSE and BSE Windows 8 App Review appeared first on Marketcalls.

E-Will – Now Make Your Will Online

$
0
0

People earn money, spend money and save money. But there comes a time when everyone needs to contemplate on one thing and that is how to carry forward the earnings of one’s whole life? We are living in such an age when we have technology at our disposal. Apart from every other thing we also get various finance related services from it. The age of internet has made everything simple. Be it sending money overseas or buying something online, be it depositing money or paying the electricity bills everything has been made simple with internet.

E-Will

Every bank, now, has online services to support their customers. From earning money to spending it, the banks are there to help you with numerous services. And the latest addition to this array of services is the online option to prepare the will. National Securities Depository Limited or NSDL e-Governance Infrastructure and HDFC Securities have joined hands with Warmond Trustees and Executors to introduce the e-Will services. This was launched last month to support various customers to prepare their Will without going to a lawyer.

Until now financial institutions had lot of services like savings, insurance, electronic transactions and investment solutions etc. This latest inclusion has completed the circle of finance related services.

It is very easy to create an E-will. In this service one gets the option to create their will. One has to log in to the portal and s/he will find a ready format of the will. Then s/he has to fill up the spaces and has to provide necessary information to complete the process. Making a will is a very thoughtful and time consuming matter. One can save the draft midway and can work on that later. One can take multiple attempts before finalizing and for that one will get quite a long time. As it is a online process, one can prepare this at any convenient time and at any place. After the completion the draft will be forwarded to the lawyer for consideration and approval. The financial and legal institutions that are providing such services have specialized lawyers to address various communities like Hindus, Muslims, Christians and Parsis. There is also guidance manual and FAQ segment to guide the users. It takes very short time to complete the whole process.

After submitting all the required information the financial firm sends a draft copy to the user for consideration. The user can determine whether she/he wants a soft copy of the will or a delivery to the door step. The whole process has been made with utmost care leaving all the chances of misunderstanding. This unique step not only ensures the future of the concerned person but also assures a legal and smooth carry forward of the hard earned money.

Create your own E-Will Now with HDFC Securities

Related Readings and Observations

The post E-Will – Now Make Your Will Online appeared first on Marketcalls.


Relinfra Futures : Bearish Outlook

$
0
0

relinfra


Relinfra Outlook : Bearish
Short term trend : Down


Relinfra futures closed the week @ 686.80 the high made for the week 707.75, Relinfra has made bearish close for the week, the last two weekly bars are bearish bar.

After a magnificent move from march 2014 the stock doubled more levels of 350 and made the high of 800+. As per Fibonacci levels the stock is making its retracement and currently below 23.6% retracement levels of Fibonacci. The trend line support for relinfra is @ 674 below which there can be a sharp correction toward 630 580

Fno Trades can open shorts below 680 with protective stops of 710 for a target of 630-580.

Related Readings and Observations

The post Relinfra Futures : Bearish Outlook appeared first on Marketcalls.

Study Of Common Investment Habits

$
0
0

imagessd


“Normal fear protects us; abnormal fear paralyses us.”

- Martin Luther King, Jr.

Introduction

The core challenge as an investor is setting aside instinctive physiological and emotional responses at the root of our brain’s decision-making processes. Though they are perfectly suited to protect us from physical harm, they have little value in modern investing

Humans are not wired for disciplined investing.When people follow their natural instincts,they tend to apply faulty reasoning to investing

LESSONS FROM CHESS ABOUT OUR HABITS

“It is wrong to think of chess as an almost exclusively cognitive pursuit, where moves are chosen and positions understood only on the basis of mental patterns and inferences.” In reality, if you want to become a great chess player, or even a good one, “your ability to recognize and utilize your emotions is every bit as important as the way you think.”

Two of the most important executive functions are cognitive flexibility and cognitive self-control. Cognitive flexibility is the ability to see alternative solutions to problems, to think outside the box, to negotiate unfamiliar situations. Cognitive self-control is the ability to inhibit an instinctive or habitual response and substitute a more effective, less obvious one.

It is also important to resist the temptation to pursue an immediately attractive move, since that type of move often leads to trouble down the road. Teaching chess is really about teaching the habits that go along with thinking, Slowing down, examining impulses, and considering alternatives sounds reasonable

TRADING IS PSYCHOLOGICAL

Investing is psychological. And because we constantly want to protect our inner-being, we need to understand how to tame our impulses.

Typical Impulses

“The type of investor who is easily impressed by short-term performance is also really easily disappointed when a strategy struggles. It’s a personality thing. It’s what drives the behavior gap that Carl Richards talks about – getting into the next hot thing at a top and then getting out at a bottom for the hot thing after that, ‘repeat until broke.’” In fact, according to Paul Samuelson, “Investing should be more like watching paint dry or watching grass grow. If you want excitement, take $800 and go to Las Vegas.”

Prospect theory also explains the occurrence of the disposition effect, which is the tendency for investors to hold on to losing stocks for too long and sell winning stocks too soon. The most logical course of action would be to hold on to winning stocks in order to further gains and to sell losing stocks in order to prevent escalating losses.

Lizard Brain

imagesfg

In 1954, the limbic cortex was described by neuroanatomists. Since that time, the limbic system of the brain has been implicated as the seat of emotion, addiction, mood, and lots of other mental and emotional processes. It is the part of the brain that is phylogenetic ally very primitive. Many people call it “The Lizard Brain” because the limbic system is about all a lizard has for brain function. It is in charge of fight, flight, feeding, fear, freezing-up, and fornication

Controlling Lizard Brain

Investing is challenging enough without bringing emotions into the equation. Unfortunately, humans are emotional, and as a result investors often place too much reliance on their feelings, rather than using objective information to drive rational decision making.

What causes investors to make irrational decisions? The short answer: our “amygdala.” Author and marketer Seth Godin calls this almond-shaped tissue in the middle of our head, at the end of the brain stem, the “lizard brain” . Evolution created the amygdala’s instinctual survival flight response for lizards to avoid hungry hawks and humans to flee ferocious lions.

Over time, the threat of lions eating people in our modern lives has dramatically declined, but the human’s “lizard brain” is still running in full gear, worrying about other fear-inducing warning. Sadly, for many people, and investors, the emotional response from the amygdala dominates the rational reasoning portion of the prefrontal cortex. The best investors and traders have developed the ability of separating emotions from rational decision making, by keeping the amygdala in check

Well, the first thing you should do is turn off the TV. And by turning off the TV, I mean stop listening to talking head commentators, economists, strategists, analysts, neighbors, co-workers, blogger hacks, newsletter writers, journalists, and other investing “wannabes”.

LIZARD BRAIN AS OUR DNA OF DECISION MAKING

Amygdala also known as lizard brain control our decision making process of mind. In prehistoric time when human has to survive in wild without any protection of any kind ,nature equipped us with this apparatus in brain for our defenses and preferences.This is the seat of our instinctive reactions and reflexes in the face of dangers and stimulus.It saved us and makes us live our life.We can not grow beyond it as human and our habits are born here and stay as many of those instincts are crucial for our survival and normal life.It controls our life and decision making and always going to do so.One can not selectively decouple from this.But amygdala does help us to survive but it is unsuitable for profitable investment.Our natural instinctive reaction are invalid to survive investment and we are designed to fail.We are our lizard brain and can not evolve beyond it.As a result we have many common investment habits which most of us repeat.

COMMON HABITS

Habits are impulses in trading and investment.Chess and trading share our common habits as we play both.We display same habits in chess and investment.Our habits depends on our personality and are different from person to person..So your personality type or psychological profile and risk profile matters both in trading and chess.

POSITIVE EMOTIONAL IMPULSES OR HABITS FOR REWARD PROCESSING

  1. Recency bias
  2. Performance chasing
  3. Disbelief in chart and patterns when they are most needed
  4. Exuberance and thrill in euphoria condition
  5. Applying hit and trial method-Chalta Hei
  6. Disposition to get tricked or spooked
  7. wide spread Amateurism. trading without skills and technical competency as hobby or recreation without competitiveness like part time electrician or computer technician with predictable bad outcome.  Apparently hostile market environments where market conditions are always changing from volatile to stable and from trending to choppy so nothing works in all market environments for armature but can make sense to a technician
  8. These impulses are to be restrained by slowing down and contemplating alternatives
  9. Making move without any reason like in chess
  10. Keeping a piece hanging without protection as in chess
  11. Lack of capacity to wait and impatience .we forget that market trends only 20% time and 80% time drifts around.
  12. We tend to wait for certainty.
  13. Risk aversion-our preference for sure gain over probable gain.And we prefer probable loss over sure loss.we hang on to loss
  14. Our actions are not completely cognitive and consistent
  15. Fear of missing out
  16. Hoping in the face of hazard
  17. Framing effect on our mind and decision making
  18. Attraction to easy ways and temptations
  19. Attraction to easy and quick money
  20. Role of Our neural devices such as insular cortex and accumudin cortex which process rewards
  21. Habit of windfall gains making us more risk seeking due to high testosterone level
  22. Information impact in us.Our lizard brain has ability to distort the reality.Exposure to too much information make lizard brain highly active and distort the reality as per our psyche such created.Our lizard brain tend to magnify everything.and seek more excitements or intensifys fear and pain.which in turn control our decision making process
  23. We trade without plan and edge
  24. We trade on the basis of news and opinion of commentators -95% of whom arewrong
  25. Seeking happiness and joy to break away from boredom in trading instead of profit maximizing being secondary goal
  26. Our disposition to risk taking or gambling due to high dopamine level in brains
  27. Taking a long view means establishing a thoughtful plan and having discipline to stick with it through markets inevitable ups and downs .not to be guided by instincts, emotions aand lizard brain
  28. Like in chess it is important to resist the temptation to pursue an immediately attractive move .since that type of move leads to trouble down the line.Trading like chess is really about learning habits that goes with thinking.
  29. Impulses in stock market are like habits of chess .In absence of discipline or self control our habits rule us and our decisions.Its our lizard brain running the show in investing .
  30. We should be rationally maximizing profits and minimizing loss like in business


NEGATIVE HABITS AND EMOTIONAL IMPULSES IN RISK

1.Anxiety, Ego ,Fear, Panic, Depression of losses and their intensity of pain and our ability to tolerate them is our personality or risk profile.Their impact varies from person to person

2.risk aversion and preferring probability of loss instead of sure loss

3.Arguing with market.Fighting the trend.

Investing is about taming those impulses and removing emotions from equations of trading.

4.Grass is green beyond the wolf at the door

5.The Harmful Consequence of Brain on Pain

Besides forcing damaging decisions, another consequence of our lizard brain is its ability to distort reality. Behavioral economists Daniel Kahneman (Nobel Prize winner) and Amos Tversky through their research demonstrated the pain of $50 loss is more than twice as painful as the pleasure from $50 gain

6.Playing victim attitude to duck responsibility

7.Very short willpower to follow discipline to stick to a plan or a strategy

8.Cheating in market duty-common tendency to skip monotony and drudgery of regular trading duty to analyze ,read and track price and position at the cost of our freedom and time.

9.Not knowing what we don’t know.One is forced to second guess in the face of unexpected ,unforeseen and unfavorable outcome which only worsen.

We may be our master in normal times but mighty Amygdala is our master controller when it matters most.

Related Readings and Observations

  • Callibration and Measurement of Power Rating of Stocks In any industry it is always critical to calibrate any equipment or measuring tools which are in application of process.This is crucial to ensure efficiency and to achieve targeted output […]
  • Find Your Edge Before You Trade. Edge plays as a significant parameter in finance and gambling or in any form of betting games.In Trading and Insurance ,it finds vital applications as the factor which stands between […]
  • Pump and Dump Scheme in Stock Markets Explained “Pump and Dump” could be defined as a form of microcap stock fraud that involves inflating the price of an owned stock artificially by means of misleading statements so as to sell the […]
  • How Not To End Your Trading Career Untimely. Nineteen-year-old Monty spent the afternoon day-trading penny stocks because his prefrontal cortex isn't yet fully developed and he couldn't recognize risk-reward trade-offs if they hit […]

The post Study Of Common Investment Habits appeared first on Marketcalls.

Nifty Future Weekly Outlook 14th September 2014

$
0
0

Nifty

Nifty Future LTP 8137.85

Technical Update: Nifty future closes the week at 8137.85 after making the high of 8200 for the week. The Friday session however was a positive day. On daily chart the Nifty broken down from a Rising wedge pattern and is making a pullback.

Trend: Short term trend neutral, medium term trend & primary trend are up with strong supports @ 7870

RSI: RSI is trading at 68.61 with upside momentum. There is a clear divergence on RSI which can be visible from chart above price making new high but RSI making lower high hence a cautious approach for longs should be there.

Stochastic: Stochastic indicator is been in over bought zone since April and nifty has rallied 1200 points above after that which shows market has lot of strength and why following indicators alone while going short when overbought can be devastating task. Many traders who enter shorts thinking market is high and overbought have got there account closed or in very big losses.

Volume: The last rally from 7500 to 8200 has been on significantly lower volume’s as seen from chart above.


Trading Strategy: Short term traders holding longs watch 8125 levels till nifty future remains above this level it’s a buy in dip market hence can hold their longs next resistance around 8200-8240. Only if we break 8125 or sustain and close below this level then exit long and be short with protective stops of 8200 add more shorts below 8070 for price target of 8000 & 7950.

Related Readings and Observations

  • Nifty Future Research Report 18th Aug 2014 Nifty future closed the week on a positive note on weekly chart. Nifty future closed Friday’s trading session at 7803.70. Nifty future has been consolidating in a sideways horizontal range […]
  • Nifty Future Report Weekly View 4th Aug 2014   Technical Update : Nifty Future has been facing stiff resistance at 7830 levels.  As updated in previous nifty future report weekly view 7745 below bear's got active and market […]
  • Will Nifty Sustain above 8000 till September Expiry? Surprisingly Mutual funds are the Net buyers consecutively for the last four months and had pumped a net inflow of closely 15464.5 crores right from May 2014 month onwards. It seems mutual […]
  • Nifty and Bank Nifty futures September Overview Nifty and Bank Nifty futures hourly charts is in positional buy mode and currently the support zone comes around 8034 and 15784 respectively. Reverse your position to positional sell mode […]

The post Nifty Future Weekly Outlook 14th September 2014 appeared first on Marketcalls.

How to Setup and Run Amibroker in Amazon AWS Cloud

$
0
0

//www.youtube.com/watch?v=rLWscsYRtOs

Here is a Video tutorial which explains how to Create a Virtual Instance in Amazon AWS cloud , How to Launch a Virtual Instance and How to Run Amibroker in Amazon Cloud EC2(Windows Virtual Instance). Here we had created a Windows 2012 R2 Instance 64 bit machine. Amazon provide a 750 hours of free AWS EC2 micro Instance(Windows,Linux) for the first time users.

Related Readings and Observations

The post How to Setup and Run Amibroker in Amazon AWS Cloud appeared first on Marketcalls.

Shopper Stop : Long Term Outlook

$
0
0

shoppers


Scrip : Shopper stop limited
Trend : Strong Up
Formation : Breakout from triangle
Positive’s : Life Time High
Major Supports : around 440
Trend Reversal : below 370 
Recommendation : Buy
Upside Targets : 750-800

Technical Update : Shopper stop limited made an technical bullish breakout from triangle formation past week. The stock made its life time high at 572+ and closed the week at 547.25. The last candle is highly bullish candle and had closed above its trend line resistance on breakout which indicates the continuation of trend in the stock in coming weeks and months.

Short term supports at 490 with major support at 440. Its a buy in dip stock it should be accumulated in declines around 500 or below for upside targets of 750-800 in coming weeks & months with protective stop loss of 370 below which the trend will reverse.


Related Readings and Observations

The post Shopper Stop : Long Term Outlook appeared first on Marketcalls.

High Frequency Trading & Market Making Heaven For Traders.

$
0
0

Stock Market Image

Do you know Bombay Stock Exchange India Is going to be world best trading venue for High frequency & market making traders. Their are various reason few of them I am going to mention below.


  • Right know most of the liquidity in this venue comes from Algo or Quant based trading which is with in range of 90% – 95% of total volumes.
  • Exchange leaves his fee. So transaction cost in BSE is on lower side.
  • There are various ways by which Foreign National can Trade at BSE India.
  • For High Frequency Trading Exchange provide one of best technology so Round trip with in limit of 250 Micro second. Right now no exchanges provide that low latency in India.
  • Inter Exchange Arbitrage or smart Routing algos can be deployed.
  • On Volume basis No cost Co location Infrastructure provided by BSE India .
  • Market making Incentive programme’s are theirs.
  • Largest number of listed companies in the world – 5433 as of 31 July 2014
  • 11th Largest exchange Globally in terms of market capitalization – Over USD 1.49 Trillion
  • 3rd most liquid exchange globally for Index Options
  • 7th largest exchange in the world in terms of number of trades in Equity Shares
  • 2nd largest in the World in terms of number of currency options contracts traded.
  • 3rd largest in the world in terms of number of currency futures contracts traded.
  • Full bouquet of products including Equity, Equity Derivatives, Currency Derivatives, Interest Rate Derivatives, Debt Products, Security Lending & Borrowing Platform, IPO, SME Platform, Mutual Funds, ETFs and Offer for Sale (OFS).
  • Partnership with S&P Dow Jones Indices on Index Product.
  • Cross listing of benchmark index S&P BSE SENSEX in BRICS countries
  • Established in 1875, BSE Ltd. (formerly known as Bombay Stock Exchange Ltd.), is Asia’s first Stock Exchange and one of India’s leading exchange groups
  • Highly Secure as Running under guidelines of SEBI & registered under WFE Regulations.
  • BSE Have DMA/FIX API & Native API access. Also provide Simulation or paper Test environment for Testing.
  • In House Applications for Order management & Risk management can be approved from BSE.

 
HFT and Market Makers can get the brief detailed info here

Lokesh Madan 

Related Readings and Observations

The post High Frequency Trading & Market Making Heaven For Traders. appeared first on Marketcalls.

Crude Technical Analysis – Continue Holding Support.

$
0
0

Crude (16.9.2014) continue trading in tight range after finding a support just under $90 mark as mention in our last article. Last few days trading showing a slow down in downside movement while the construction of positive candlestick pattern with continue positive divergence suggesting a bounce ahead. A lower trend line support of minor descending channel still favor shot covering.

On fundamental side, last 4 constitutive inventory withdrawal in crude & upcoming maintenance shut down might starting support at this area.

crude 4 hr

Based on above studies, it is possible for crude to move for some upside targets around $94.90 & then $96.50 in coming trading session while a close below $89.50 will delay the forecast.

Note – Above technical analysis is our observation not to consider as a buy/sell recommendation. For recommendations Contact Us 

Related Readings and Observations

  • Crude Technical Analysis – Corrective Bounce Ahead? Now crude is trading around $92.40 & the bounce $90 mark is well  supported by many factors like 261.8% February retracement. , a lower trendline of descending channel as well as a […]
  • Crude Reaching Reversal Zone Once Again. Now crude is trading around $103.60 & as we can see on charts, crude once again reaching to the resistance zone ,from where we already witness 2 reversal earlier. The candlestick […]
  • Crude technical outlook – crude on major support. Now crude is trading at $93.35 & as we can see on charts crude is sustaining above the lower trade line of long term ascending channel which made top $112 in last run. This tradeline […]
  • Crude Oil Short term Technical Outlook Now crude is trading around $97.80 & as we can see on charts, crude was able to manage above 61.8% feb correction level of last ascending wave.This area also supported by the parallel […]

The post Crude Technical Analysis – Continue Holding Support. appeared first on Marketcalls.


NestRTD – Nest/Now to Amibroker Feeder – Open Source (GPL)

$
0
0

[Extract from Traderji Forum]
Amibroker Feeder is a C++ RTD client for Nest/NOW which Feeds realtime data to Amibroker. This utility also included a basic backfill tool to import VWAP statistics / Nest Plus Data table( josh1 has release automated backfill tool recently. You may want to use that instead ) The tools are based on RTNOW utility by josh1

Video Tutorial On How to Extract Data from Nest Trading Terminal to Amibroker using Nest RTD

//www.youtube.com/watch?v=lm6qMwKlsgc

Advantages over using RTNOW
– No need to use excel. Uses less resources.
– More accurate data as we pick up every callback from RTD. If you keep chart open in Nest Terminal and compare, the bars should generally match. Lower Timeframe data is more accurate.

Disadvantages

– Only for NEST / NOW
– No GUI. Create one if you can and share under GPLv3. Only need to setup some files and run exe anyway

Installation Instructions

1)Setup Amibroker DB (intraday settings) and Nest as explained in josh1 RTNOW instructions
2)Copy rtd.format, backfill.format to AmiBroker\Formats folder
3)Read and Setup settings.ini in NestRTD / ABBackFill. For ‘Now’ make sure to change RTDServerProgID value to Now.ScripRTD along with scrip ids / field ids
4)Once setup is done, run the exe ( For Backfill, Fill the data in VWAP.txt/DataTable.txt first )
5)Example settings for many stocks by Einstein – settings.ini
6)If you get c++ runtime missing error, install it

License
1)Tools are released under GPL 3.
2)This is free for life. This is not a money making idea .There is no one time fee, there is no regular fee. There are no server checks.
3)You are free to modify code and to redistribute. If you distribute it, you will have to release it under GPL3 giving same rights to others as i give to you.

Support
No support is provided. The tools have been tested on Nest and Now with help from josh1. I dont have time to hand hold anyone.
Please take effort to read instructions. Please help others if possible. Wiki in github can be edited publicly.
Ill check thread once in a while but not regularly.

Source Code Basic Info and links
If you want to understand/modify code – some info and some links to resources are here – Code info

NestRTD Github Page
Download Latest Release of NestRTD

Related Readings and Observations

The post NestRTD – Nest/Now to Amibroker Feeder – Open Source (GPL) appeared first on Marketcalls.

It is prudent to Invest in a Savings Bank Account now?

$
0
0

We have all be eager to see the budget and how it would impact our budget. With the new financial decisions doled out by the finance minister stating the impact of certain investments, there have been several questions raised over its tax implications. In today’s world arguably, the question whether to save or not does not arise as there are several who still believe in parking in their funds in liquid assets. Given the recent inclusion of taxes on certain types of funds and considering the volatility of the market, having a savings account with a good interest rate is not all that bad. We discuss the various implications of having a savings bank account.

Savings are leading the way

From most quarters, experts have vouched that parking your funds in a savings account seems wiser than ever, it inevitably means that most people who are interested in saving their money in funds need to relook their investment outlook. The sudden change in investment advice has not been all that recent, as the volatility in the markets over the past few years have clearly deterred investors from the stock market. The rise and fall in the SENSEX and the NIFTY have been a constant cause for concern amongst investors. Here’s a reason why a savings account should be considered post-budget 2014-15:

The budget 2014-15, although the most awaited with the assertion of the new government, yet that means the inclusion of several taxation norms that have discouraged investors from looking at larger profit margins from debt instruments. So, we look at the various ways in which the savings account is likely to get a significant boost from investors, here’s why:

  1. Buffering from Market volatility: When the concerns regarding market volatility have been raised over time, having the steady and safe place to park your money seems like a more logical decision. Despite robust predictions by stock market experts, there is no saying how steady the flow of profit margins will remain over the long term. Hence, the decision to go ahead with a savings account will ensure certain returns in the long term.
  2. Tax-free returns guaranteed: Although, the savings account interest rate may not match up to the high level of profits that you may gain in the stock market, they are undoubtedly steady. They offer tax-free interest rate for up to Rs. 10,000.
  3. A steady rate of interest: When compared to certain bad spells in the stock market, it’s quite possible to enjoy the returns from your savings account. It is the most guaranteed mode of getting benefits over time, preventing you from periodic loss that you may occur in the stock market.
  4. Long term returns guaranteed: A savings accounts gives you the ability to multi-task, enjoy the benefits of capturing the high interest rates in fixed and recurring deposits, PPFs, national savings scheme etc. You have complete freedom apart from investing in the stock market, to link your bank account with several long term savings schemes that will generate fixed returns.

The question to open a savings account does not occur to most working professionals as they are provided a salary savings account by default. Yet, it’s always beneficial to have a savings account that generates a significant level of steady income with a fixed interest rate over time.

Related Readings and Observations

  • Shopper Stop : Long Term Outlook Shopper stop limited made an technical bullish breakout from triangle formation past week. The stock made its life time high at 572+ and closed the week at 547.25. The last candle is […]
  • Restriction On Third Party ATM Withdrawals In a latest report, it was found that the numbers of ATM withdrawals from third party ATMs will come down to three per month. Currently, the limit is five withdrawals per month for the […]
  • Small Banks and Payment Banks Explained The reserve bank of India has recently announced the draft guidelines on two new types of banks. To achieve the financial targets of the government plans of launching small banks and […]
  • Single Address Proof To Open A Bank Account Your identity proof is not the first thing anyone asks for, when you meet unknown people for the first time. You say your name and start exchanging words, but this is not so simple if you […]

The post It is prudent to Invest in a Savings Bank Account now? appeared first on Marketcalls.

Now Amiquote 3.10 supports Quandl as Datafeed

$
0
0

Amiquote is a companion program to AmiBroker stock charting/analysis software. Amiquote simpliies with automation of downloading financial data from the various datafeed sources like google finance(EOD & Intraday), yahoo(EOD and Intraday) finance, MSN. And very recently Amibroker had came up with a upgraded version of Amiquote ver 3.1 which auto downloads EOD dataset from Quandl.

Quandl offers free and unlimited access to 9 million time-series datasets from 400 sources spanning finance, economics, society, health, energy, demography & more.

Quandl Amiquote

Currently the Quandl feed in Amiquote is in experimental stage and supports only existing Amiquote license holders. Trail version holders could still use the 3rd party open source Quandl plugin for Amibroker from the developer Mr Anderson Wilson .

Download Amiquote 3.10 version

Related Readings and Observations

The post Now Amiquote 3.10 supports Quandl as Datafeed appeared first on Marketcalls.

MCX to launch New Contracts up to March 2015.

$
0
0

Here is a very big relief for the MCX Commodity players, FMC allowed MCX to launch contracts up to March 2015 as soon as a new technology agreement is signed between MCX and FTIL. FMC has also directed MCX to take all pending actions based on the findings of a PricewaterhouseCoopers (PwC) report and furnish an updated compliance report by 15 October 2014.

MCX Commodity Exchange

In December 2013, FMC(Forward Market Commission) declared FTIL(Financial Technologies) unfit to hold a stake in any commodity exchange and ordered FT to sell its stake in MCX. FTIL has sold its 21% stake to Kotak Mahindra Bank Ltd, Rakesh Jhunjhunwala and other well know investors. FTIL sold its 15 percent stake in MCX to Kotak Mahindra Bank for Rs 459 crore.

MCX allowing new contracts till March 2015 will definitely a welcoming move among commodity traders and brokers, especially the commodity hedgers are the real beneficiaries as traders struggle to hedge instruments like copper,silver which had currently only one contract in open for trading/hedging.

MCX India – Communication from FMC regarding permission to launch of fresh contracts

Related Readings and Observations

The post MCX to launch New Contracts up to March 2015. appeared first on Marketcalls.

How to Install Quantopian Zipline in Windows

$
0
0

Quantopian logo Quantopian, is a Boston-based algorithmic trading platform and Zipline is a Pythonic algorithmic trading library(Open Source). Quantiopian Zipline is currently used in production as the backtesting engine powering Quantopian.

Zipline comes “batteries included” as many common statistics like moving average and linear regression can be readily accessed from within a user-written algorithm. Zipline supports data import from Yahoo Finance too. You can get more info about Zipline here

Installation Guidelines for Setting up Python for the First time

//www.youtube.com/watch?v=xVy6WYtq5go

How to Install PIP and Guidelines for Setting up Quantopian Zipline and its Dependencies

//www.youtube.com/watch?v=GNyWM-alzoo

List of Required Dependencies

1)NumPy is a fundamental package needed for scientific computing with Python
2)SciPy is software for mathematics, science, and engineering.
3)Pandas is a cross-section and time series data analysis toolkit.
4)IPython is an interactive computing environment.
5)TA-Lib is a wrapper for the TA-LIB Technical Analysis Library.
6)Scikit-learn integrates classic machine learning algorithms.
7)Statsmodels provides classes and functions for the estimation of statistical models.
8)Zipline is a pythonic algotrading library.

Installation of TA-Lib, Scikit-learn, Statsmodels are not shown in the video for time constratint and you can download all the above Python Library Windows binaries here. And Zipline installation can be done using direct pip command.

pip install zipline

Other Dependencies which comes with Zipline Installation

1)Logbook
2)pytz
3)requests
4)six
5)python-dateutil

Dependenices for IPython and Matplotlib Installation

pyzmp, jinja2, tornado,pyparsing are some of the dependencies which are required for running IPython and you can use the pip command to install it.

pip install pyzmq
pip install jinja2
pip install tornado
pip install pyparsing

One the dependencies are installed go to Windows Powershell and enter to start IPython Notebook

ipython notebook –pylab inline

In the next video will try to come up with few more concepts on how to use quantiopian zipline in IPython Notebook Interactive computing environment.

Related Readings and Observations

The post How to Install Quantopian Zipline in Windows appeared first on Marketcalls.

Viewing all 2070 articles
Browse latest View live