![photo_dataCenters]()
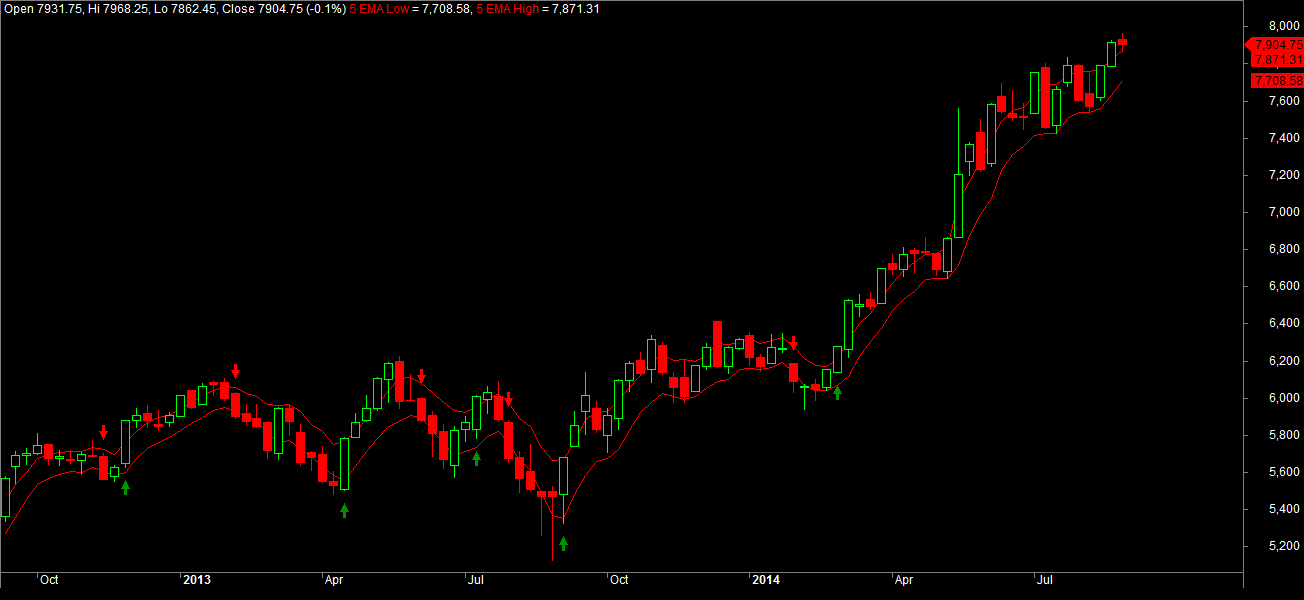
Data Types used in Trading.
Data can be defined as static or dynamic. Static data are data that do not change very often, whereas dynamic data are data that continually change over time. For example, attributes of a bond, such as its maturity and issuer, are most likely going to remain constant over the life of the security, and are referred to as static data; however, its price continually changes, and thus price data is referred to as dynamic data. In addition, some data is public to all participants, such as currency codes and interest rates, whereas other data is kept private to a firm, such as client account information. With these high-level categorizations in mind, the following list shows the main types of data needed for securities operations.
■ Historical Time Series Data: Historical market data is needed in both analytics and risk management for strategy back-testing, instrument pricing, and Monte- Carlo simulations. For example, a quant may require interest rates for the past ten years in order to simulate how they may behave and affect the fixed income portfolio of the trading desk in the future. For credit risk management, the fluctuating credit rating of an issuer in the past is helpful in determining whether it will default on its current obligations. Getting historical time-series data is a one-time download of the relevant dataset from a market source for a fee. Prominent data vendors for financial data include Bloomberg, Reuters, Telekurs, and FTID.
■ Static Reference Data: Static reference data refers to the kind of data fields that do not vary over time. This includes the defining parameters of a security and the legal entity structure of different counterparties. Static data is retrieved in a one-time download every time a new security, counterparty, or market partner is used, with updates triggered by events. For example, in the event of an acquisition, the name of the legal entity that has issued a security will have to be changed.
■ Dynamic and High-Frequency Market Data: Dynamic data varies on a regular basis and is most often used to refer to the changing prices of a security. Quotes received from a multitude of sources for a variety of asset classes have to be normalized and stored in the firm’s database. These prices are then used for analytics, daily mark-to-market, and risk management. This includes high-frequency data, such as tick data, which is a constant stream of tick-by tick price quotes from marketplaces, such as from NSE, MCX, and BSE. There was a time when end-of-day price data was sufficient for most kinds of proprietary algorithmic trading (i.e., statistical arbitrage), but with electronic trading, margins have shrunk and competitiveness in finding small opportunities in the market has skyrocketed. Hedge funds in particular now need intraday high-frequency tick data for trading. Intraday market data is also needed by broker-dealers who must provide best execution to their clients, and therefore need to have a view of real-time current prices in all major marketplaces.
■ Legal Entity and Corporate Actions Data: Keeping track of corporate actions and legal entity data, such as mergers,Divident announcement’s and stock splits, is very important because they can significantly affect the price and future returns on a security. They have been a sore spot for the industry since there is no consolidated data feed for this information, and the middle-office would notify business users after looking at press releases and company websites. Firms now increasingly outsource their needs to corporate actions aggregators, who provide updated information in feeds to the fi rm.
■ Transaction and Position Data: A firm keeps track internally of transaction details, including internal trade identifiers, position data, and profit and loss histories.
■ Account Data: There are two types of account data that each firm holds: the account information of clients that use the firm, and the account information when the firm itself is a client of another fi rm. Details of clients, including names, assets under management, client-directed rules, and transaction history, are kept in account-related databases. In addition, the firm may have several accounts of its own with data vendors, marketplaces, and clearinghouses and must store this information internally.
Market Data Provider with type of data available.
Market data is mainly classified into three main Types
1) Real Time Data 2) Historical Data 3) Corp News data
Now Data is further divided into two main types
1) Level 1
2) Level 2
& Historical data is further divided into various type i.e – EOD, Snapshot data on per 1, 2,5min basis & many others as per corporate requirements.
For Complex Analytics purpose major Market data in use is Real time data (on Tick by Tick basis or Raw data ) For Real time Data you need Leased line access from data provider data centre to your location. For delay data you can use Internet access. So most of above mention Data providers provide both type of access.
IN India you get EOD data from most of exchange’s Free of cost. You can use that data for your analysis.
Main Difference Between Level 1 and Level 2 Market Data?
The quality of the financial data an investor receives will be reflected in the quality of their decision making. For day traders or frequent participants in equity trading, the precision and knowledge of market pricing is far more important than for a ‘buy and hold’ investor. In the Data Market world, access to market data is classified as either Level 1 or Level 2.
Note: Sub-level 1 data can be obtained from live share price websites and your broker. This simply shows you the buy and sell price that you can trade at.
What is Level 1 Market Data
Level 1 market data includes access to the following:
Bid Price & Size – This shows the highest price offered by a trader who has placed an order to purchase, together with the number of shares they wish to purchase at that price. If a day trader wishes to sell more shares than quoted at this price, they will have to accept a lower price to clear the excess shares.
Ask Price & Size – This shows the lowest price offered by a selling trader, together with the number of shares they are willing to sell at that price. If a day trader wishes to purchase more than this quoted size, they will have to offer more to settle the excess shares.
Last Price & Size – This simply shows the price and quantity of the most recent trade executed. Intra-day, this will be updating all the time, but at market close this will represent the closing price for the share.
How much does Level 1 market data cost?
Cost you near about 2000 USD per month .Where are there are various services providers those can provide you this data @150USD you have to Google.
What is Level 2 Market Data
Level 2 (II) market data is offered by data providers at a premium to Level 1. It offers extra information that is often not utilized by normal day traders, and is almost certainly irrelevant to long term investors.
Level 2 market data shows the trader a bigger picture of the ‘order book’. In Level 1 above, the trader was only able to see the best prices for buying and selling, and could not look any deeper into the details of other less competitive orders on the system. The distribution of uncompetitive orders is important to institutional investors who plan to buy or sell large blocks of shares.
If a pension fund wished to sell 50m shares in a medium sized company, they would look at their terminal. Using level 1 data, they may see that the highest bid price on the market is £20 for 50k shares. The pension manager will now know that they can sell their first 50k shares at £20, but will have to accept less in order to shift the rest of their holding. Therefore they would then trade at the next best bid price, and so on, and so on, receiving marginally less for their shares each time they exhaust an order in the market place.
It would therefore benefit the pension fund manager to be able to assess how quickly the competitiveness of the bid prices trail off, before they place a large block of shares for sale. This is called being able to see the ‘depth’ of the market. Market II data allows the participant to see the next 5-10 prices below/above the current best price, offering that insight. If the competitive orders are thin on the ground then they may decide to delay their sale or only sell a small batch. With a very full and competitive order book as a result of strong demand, the pension fund may be able to offload its shares without moving the share price down too much, achieving the best deal for their pension holders.
This demonstrates why level 2 data is quite pointless for your average day trader, who will be trading in such small quantities that their trade will rarely exhaust the bid price or offer price they could see on level 1.
Other than very large institutions, the only other viable market participant who could fully utilize such data would be a high-speed, automatic trading algorithm which pays extremely low commissions and could potentially take advantage of the relatively large price movements caused by ‘gaps’ in order books.
Cost of level 2 data is much more then Level 1 data &difference i.e Level 1 data for six month for one exchange cost you 2000 USD where as Level 2 data cost you 5000 USD.
Best Market data provider in World for domestic as well as for International Markets
1) Bloomberg
2) Reuters
3) Interactive Data
4) OneMarketdata
5) Ticker Plant ( FT India)
6) Exchanges Itself
7) Telekurs
8) Tickdata
9) ActivFinancial
10) Morning Star
Below is some information on a selection of Market data distributors:
• Bloomberg
Bloomberg is the leading global provider of data, news and analytics. The BLOOMBERG TERMINAL and Bloomberg’s media services provide real-time and archived financial and market data, pricing, trading, news and communications tools in a single, integrated package to corporations, news organizations, financial and legal professionals and individuals around the world.
• Interactive Data
Interactive Data is a leading global provider of securities pricing, financial information and analytic tools to institutional and individual investors.
The company supplies time-sensitive pricing (including evaluated pricing), dividend, corporate action and descriptive information for more than 3.5 million securities traded around the world, including hard-to-value instruments. Many of the world’s best-known financial service and software companies subscribe to the company’s services in support of their trading, analysis, portfolio management and valuation activities.
Interactive Data Corporation (NYSE: IDC) is headquartered in Bedford, Massachusetts. Through its branded businesses – FT Interactive Data, ComStock, CMS BondEdge and eSignal – Interactive Data has approximately 1,800 employees in offices located throughout North America, Europe, Asia and Australia.
FT Interactive Data provides FTSE indices data via its relevant services to both active trader and institutional clients.
• Reuters
Reuters, the global information company, provides indispensable information tailored for professionals in the financial services, media and corporate markets. Our information is trusted and drives decision making across the globe based on our reputation for speed, accuracy and independence.
Approximately 357,000 financial market professionals around the world rely on Reuters services, providing them with the information and tools they need to help them compete. These include real-time information via desktops or data-feeds, unbeatable news, analytics and historical and fundamental data. Reuters broker-neutral trading tools provide access to the largest global trading community.
•Telekurs Financial
With over 75 years’ experience of gathering, processing and disseminating international financial information, Telekurs Financial with its 20 branches and offices maintains one of the most comprehensive securities databases worldwide (over 2.4 million instruments). A wide range of global and local products allows easy access to the full range of data on offer:
• Processing products for subsequent processing of the data supplied to your database
• Display products for specialized searches and on-screen display of data in a user-friendly format.
What makes the services of Telekurs Financial special is that structured and encoded fundamental and corporate action data is directly linked with up-to-date price information and financial news.
• Thomson
The Thomson Corporation is a leading global provider of integrated information-based solutions to business and professional customers. Thomson provides value-added information, with software tools and applications that help its customers make better decisions, faster. We serve more than 20 million information users in the fields of law, tax, accounting, higher education, reference information, corporate e-learning and assessment, financial services, scientific research and healthcare.
• Townsend Analytics
RealTick, created by Townsend Analytics, is the electronic trading industry’s premier multi-asset, multi-broker, and multi-route direct-access trading platform. RealTick delivers real-time market data, news and analytics; sophisticated trading tools; unrivaled access to brokers, exchanges and ECNs; and risk management tools to institutions, broker-dealers and individual investors. RealTick’s advanced technical design is supported by state-of-the-art data centers and a redundant network for market data and orders.
Lokesh Madan
Blog – http://algotradingindia.blogspot.in/
( We can help you to choose best with CEP engine integration).
Related Readings and Observations
The post How to Purchase Historical or Live Market Data by Lokesh Madan. appeared first on Marketcalls.
![]()


 Kimono probably that is a the answer to turn any Financial Site into Financial API and possibly you can do even realtime data analytics or visualization on top of it. Sounds Interesting? Kimono built a browser tool that turns any website into an API without any coding experience. And that is particularly interesting to me to build interesting applications on top of it.