Quantcast
Channel: Market Calls
Viewing all 2070 articles
Browse latest View live

Algo based Trading – How to calculate your Trading cost

$
0
0

Algo based Trading – How to calculate your Trading cost by Lokesh Madan.

Chess and handCore Components of Trading Costs

Brokerage Cost: This is the most explicit of the costs that any investor pays but it is usually the smallest component.( Exchange fee + taxes + Broker fee i.e 250 per cr mcx + 1000 per Cr sell mcx + broker fee depends upon volume).

Bid-Ask Spread: The spread between the price at which you can buy an asset (the dealer’s ask price) and the price at which you can sell the same asset at the same point in time (the dealer’s bid price).

Price Impact: The price impact that an investor can create by trading on an asset, pushing the price up when buying the asset and pushing it down while selling.

Opportunity Cost: There is the opportunity cost associated with waiting to trade. While being a patient trader may reduce the previous two components of trading cost, the waiting can cost profits both on trades that are made and in terms of trades that would have been profitable if made instantaneously but which became unprofitable as a result of the waiting.( Day Trading Or carry Forward charges).

Simple Evidence of a Trading Cost.

Active money managers trade because they believe that there is profit in trading, and the return to any active money manager has three ingredients to it:

Return on active money manager = Expected ReturnRisk + Return from active trading – Trading costs

The average active money manager makes about 1% less than the market. If we assume that the return to active trading is zero across all active money managers, the trading costs have to be roughly 1%. If we believe that there is a payoff to active trading, the trading costs must be much higher.

Why is there a bid-ask spread?!

In most markets, there is a dealer or market maker who sets the bidask spread, and there are three types of costs that the dealer faces that the spread is designed to cover.

• The first is the risk cost of holding inventory;

• the second is the cost of processing orders and

• the final cost is the cost of trading with more informed investors.

The spread has to be large enough to cover these costs and yield a reasonable profit to the market maker on his or her investment in the profession.

Factors determining the bid-ask spread!

1. Liquidity: More liquid Asset have lower bid-ask spreads.( If you see Higher volume in any asset means lower Bid-Ask Spread.)

2. Ownership structure: Assets with increases in institutional activity ( FII& DII ) report higher bid-ask spreads (perhaps because institutional investors tend to be more likely to be informed?)

3. Riskiness: Riskier Assets tend to have higher bid-ask spreads (i.e Silver ).

4. Price level: The spread as a percent of the price increases as price levels decrease.

5. Information transparency & corporate governance: Bid-ask spreads tend to increase as information becomes more opaque (less transparent) and as corporate governance gets weaker.

6. Market microstructure: The exchange on which an asset is traded can affect bid-ask spreads as does the mode of trading: electronic versus floor trading, for instance.

More on variation in spreads across All Assets Claases.

Price level: Lower priced Assets have substantially higher spreads (as a percent of asset price) ( Or High Beta assets or assets those are popular between market makers i.e Unitech & SBI ) than higher priced assets. In studies of bid ask spreads around stock splits, the spread as a percent of the stock price just before and after stock splits, the spread cost (as a percent of the stock price) increases significantly after stock splits.

Trading volume: A study found that the stocks in the top 20% in terms of trading volume had an average spread of only 0.62% of the price while the stocks in the bottom 20% had a spread of 2.06%.

Ownership structure: As insider holdings increase, as a percent of total stock outstanding, bid ask spreads increase, reflecting lower liquidity (since insiders don’t trade their holdings as frequently) and a fear that insiders may know more about the company than other investors (information asymmetry).

More Evidence of Bid-Ask Spreads!

The spreads in Indian government securities ( Low on Beta – NTPC ) are much lower than the spreads on Private Listed traded stocks in the India ( High Beta – Reliance ). For instance, the typical bid-ask spread on a Govt Owned stock is less than 0.1% of the price.

The spreads on corporate Stocks ( Reliance , TATA ) tend to be larger than the spreads on government Stocks, with safer (higher rated) and more liquid corporate Stocks having lower spreads than riskier (lower rated) and less liquid corporate Stocks.

While the spreads in the traded commodity markets are similar to those in the financial asset markets, the spreads in other real asset markets (real estate, art…) tend to be much larger.

Role of Spread in Investment Strategies

Strategies that involve investing in small-cap stocks or low-prices stocks will be affected disproportionately by the costs created by bidask spreads.

As an example, consider the strategy of buying on down time ( when you see Index of market is less 5% in week .But it must kept in mind no finanical loss is their in that corporate for which stock you are going to buy” i.e FT ( NSEL problem) Index is down in august FT is life time down but there is big problem with management for NSEL so do not take this stock.We are going to present evidence that a strategy of buying the stocks

which have the most negative returns over the previous many years and holding for a five-year period earns significant excess returns. A follow-up study, however, noted that many of these “losers” were low-priced stocks, and that putting in a constraint that the prices be greater than 100 Rs on this strategy resulted in a significant drop in the excess returns.

Why is there a price impact?!

The first is that markets are not completely liquid. A large trade can create an imbalance between buy and sell orders, and the only way in which this imbalance can be resolved is with a price change. This price change, that arises from lack of liquidity, will generally be temporary and will be reversed as liquidity returns to the market.

The second reason for the price impact is informational. A large trade attracts the attention of other investors in that asset market because if might be motivated by new information that the trader possesses. This price effect will generally not be temporary, especially when we look at a large number of stocks where such large trades are made. While investors are likely to be wrong a fair proportion of the time on the informational value of large block trades, there is reason to believe that they will be right almost as often.

Limitations of the Block Trades

These and similar studies suffer from a sampling bias – they tend to look at large block trades in liquid stocks / Futures & options on the exchange floor or electronic trading– they also suffer from another selection bias, insofar as they look only at actual executions.

The true cost of market impact arises from those trades that would have been done in the absence of a market impact but were not because of the perception that it would be large.

Determinants of Price Impact

Looking at the evidence, the variables that determine that price impact of trading seem to be the same variables that drive the bid-ask spread. That should not be surprising. The price impact and the bid-ask spread are both a function of the liquidity of the market. The inventory costs and adverse selection problems are likely to be largest for stocks where small trades can move the market significantly.

In many real asset markets, the difference between the price at which one can buy the asset and the price at which one can sell, at the same point in time, is a reflection of both the bid-ask spread and the expected price impact of the trade on the asset. Not surprisingly, this difference can be very large in markets where trading is infrequent; in the collectibles market, this cost can amount to more than 20% of the value of the asset.

Impact on Investment Strategy

The fact that assets which have high bid-ask spreads also tend to be assets where trading can have a significant price impact makes it even more critical that we examine investment strategies that focus disproportionately in these assets with skepticism.

Since you can reduce the price impact of trades by breaking them up into smaller trades, the price impact cost is likely to be greatest for investment strategies that require instantaneous trading.

The price impact effect also will come into play when a small portfolio manager, hitherto successful with an investment strategy, tries to scale up the strategy

The Cost of Waiting ( Carry forward Cost )

If there was no cost to waiting, even a large investor could break up trades into small lots and buy or sell large quantities without affecting the price or the spread significantly.

There is, however, a cost to waiting. In particular, the price of an asset that an investor wants to buy because he or she believes that it is undervalued may rise while the investor waits to trade, and this, in turn, can lead to one of two consequences.

• One is that the investor does eventually buy, but at a much higher price, reducing expected profits from the investment.

• The other is that the price rises so much that the asset is no longer under valued and the investor does not trade at all. A similar calculus applies when an investor wants to sell an asset that he or she thinks is overvalued.

Determinants of the Cost of Waiting

Is the valuation assessment based upon private information or is based upon public information? Private information tends to have a short shelf life in financial markets, and the risks of sitting on private information are much greater than the risks of waiting when the valuation assessment is based upon public information.

How active is the market for information? The risks of waiting, when one has valuable information, is much greater in markets where there are other investors actively searching for the same information.

How long term or short term is the strategy? Short term strategies will be affected more by the cost of waiting than long term strategies.

Is the investment strategy a contrarianor momentumstrategy? In a contrarian strategy, where investors are investing against the prevailing tide, the cost of waiting is likely to be smaller than in a momentum strategy.

Trading costs on real assets

The smallest transactions costs are associated with commodities – gold, silver or diamonds – since they tend to come in standardized units.

With residential real estate, the commission that you have to pay a real estate broker or salesperson can be 5-6% of the value of the asset.

With commercial real estate, it may be smaller for larger transactions.

With fine art or collectibles, the commissions become even higher.

The costs tend to be higher because:

• There are far fewer intermediaries in real asset businesses than there are in the stock or bond markets

• The products are not standardized. In other words, one Picasso can be very different from another, and you often need the help of experts to judge value and arrange transactions. This adds to the cost in the process.

Trading costs on private equity/businesses

1. Liquidity of assets owned by the firm: A private firm with significant holdings of cash and marketable securities should have a lower illiquidity costs than one with assets for which there are relatively few buyers.

2. Financial Health and cashflows of the firm: A private firm that is financially healthy should be easier to sell than one that is not healthy.

3. Possibility of going public in the future: The greater the likelihood that a private firm can go public in the future, the lower should be the illiquidity cost.

4. Size of the Firm: If we state the illiquidity cost as a percent of the value of the firm, it should become smaller as the size of the firm increases.

The Management of Trading Costs

Step 1: Develop a coherent investment philosophy and a consistent investment strategy

The portfolio managers who pride themselves on style switching and moving from one investment philosophy to another are the ones who bear the biggest burden in terms of transactions costs, partly because style switching increases turnover and partly because it is difficult to develop a trading strategy without a consistent investment strategy.

Step 2: Estimate the cost of waiting given the investment strategy

The cost of waiting is likely to small for long-term, contrarian strategies and greater for short-term, information-based and momentum strategies.

If the cost of waiting is very high, then the objective has to be minimize this cost, which essentially translates into trading as quickly as one can, even if the other costs of trading increase as a consequence.

Step 3: Look at the alternatives available to minimize transactions costs, given the cost of waiting.

Take advantage of the alternatives to trading on the exchange floor.

Trade portfolios rather than individual stocks, when multiple orders have to be placed.

Use technology to reduce the paperwork associated with trading and to keep track of trades which have already been made.

Be prepared prior to trading on ways to control liquidity and splits between manual and electronic trading. This “pre-trade” analysis will allow traders to identify the most efficient way to make a trade.

After the trade has been executed, do a post-trade analysis, where the details of the trade are provided in addition to a market impact analysis, which lists among other information, the benchmarks that can be used to estimate the price impact.

Step 4: Stay within a portfolio size that is consistent with the investment philosophy and trading strategy that has been chosen

While it is tempting to most portfolio managers to view portfolio growth as the fruit of past success, there is a danger that arises from allowing portfolios to become too big.

How big is too big? It depends upon both the portfolio strategy that has been chosen, and the trading costs associated with that strategy.

While a long-term value investor who focuses well-known, largecapitalization stocks might be able to allow his or her portfolio to increase to almost any size, an investor in small-cap, high growth stocks or emerging market stocks may not have the same luxury, because of the trading costs we have enumerated in the earlier

Step 5: Consider whether your investment strategy is yielding returns that exceed the costs

The ultimate test of an investment strategy lies in whether it earns excess returns after transactions costs. Once an investor has gone through the first four steps, the moment of truth always arrives when the performance of the portfolio is evaluated.

If a strategy consistently delivers returns that are lower than the costs associated with implementing the strategy, the investor has one of two choices – he or she can switch to a passive investing approach (such as an index fund) or to a different active investing strategy, with higher expected returns or lower trading costs or both.

Why taxes matter ( STT or CTT mostly on sell part + stamp duty )

Investors get to spend after-tax income and not pre-tax income.

Some investment strategies expose investors to a much greater tax liability than other strategies.

To measure the efficacy of an investment strategy, we have to look at after-tax returns and not pre-tax returns.

How to manage taxes

Keep trading to a minimum: The more you trade, the higher the tax liability you will face as an investor.

Factor in taxes when buying: When investing, take into account the expected tax drag on returns. Thus, if dividends are taxed at a rate higher than capital gains, you will pay more in taxes. If you don’t need the cash from dividends, you will do better investing in stocks that deliver more price appreciation.

Factor in taxes when selling: When trading, consider the tax effects of your trades. Match losing stock sales with capital gains.

Don’t invest just to avoid taxes: Investments that are structured primarily to avoid taxes are not only often bad investments but they are more likely to be challenged by tax authorities.

If you want to start Algo based Trading – How to calculate your Trading cost.

1) Technology Cost – Colocation server cost + Hardware cost + Interactive line Cost + TBT line Cost + Colocation access link cost + Order management system cost ( ID cost )

2) Brokerage Cost – Asset class volume cost.

3) Fund cost – Day trading Fund cost or Carry forward Fund cost or some fixed cost on fund.

4) Margin on Assets classes – Futures & Options need less margin as compared to cash asset.

For Details refer : http://algotradingindia.blogspot.in/2012/10/transaction-cost-analysis-for-indian.html

Rgds
Lokesh Madan
Skype – lokesh.madan3
 

Related Readings and Observations

The post Algo based Trading – How to calculate your Trading cost appeared first on Marketcalls.


Will Nifty and Bank Nifty extends the Decline?

$
0
0

Last week Nifty had lost 0.45% last week. Banks are the biggest losers, Bank nifty sheds more than 362 points last week.

Fundamental News release for this week
Industrial production data for June and Inflation based on consumer price index (CPI) would come out on August 12th. Data for inflation based on wholesale price index (WPI) for July would come out on August 14.

Nifty hourly charts
Nifty Spot

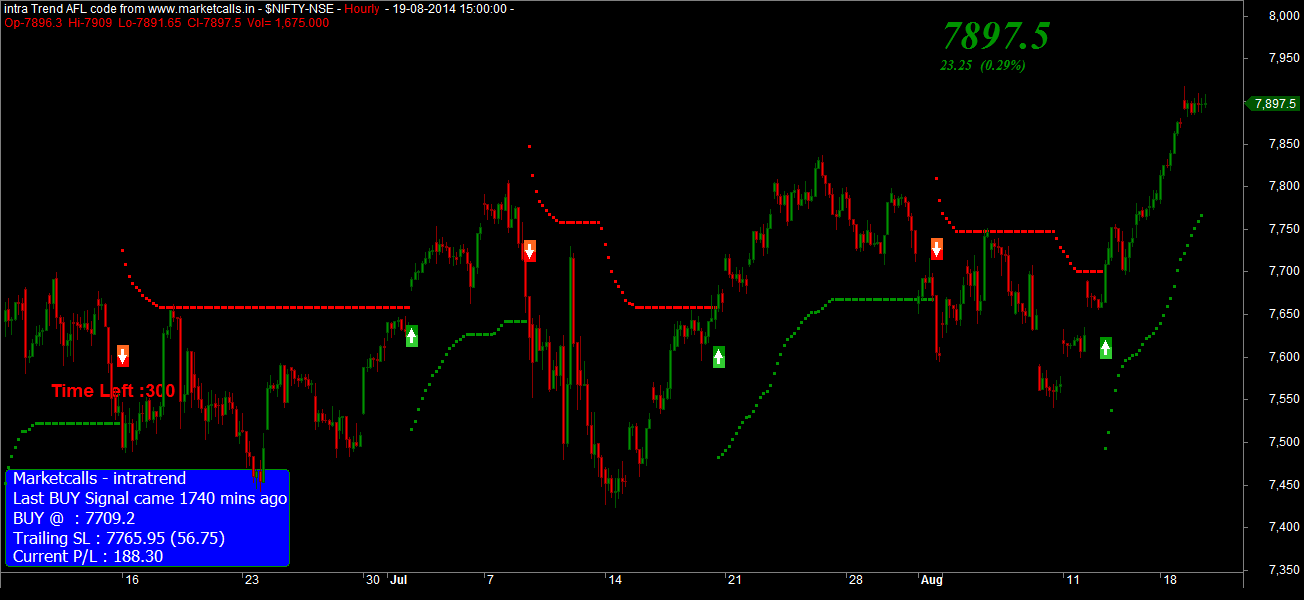
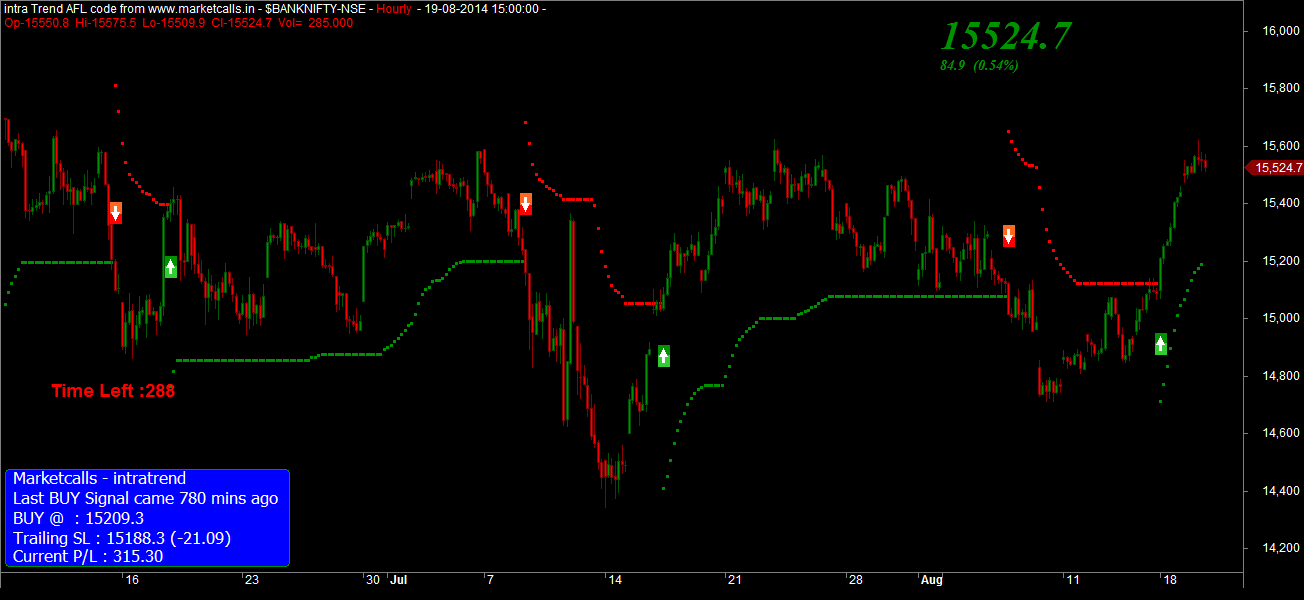
Nifty and Bank Nifty hourly charts maintains the positional sell mode. Currently the resistance zone comes very close to 7733 and 15203 respectively. Reverse your position to positional buy mode if the support zone breaks on hourly basis.

Bank Nifty Hourly Charts
Bank Nifty Spot

India VIX Hourly Charts

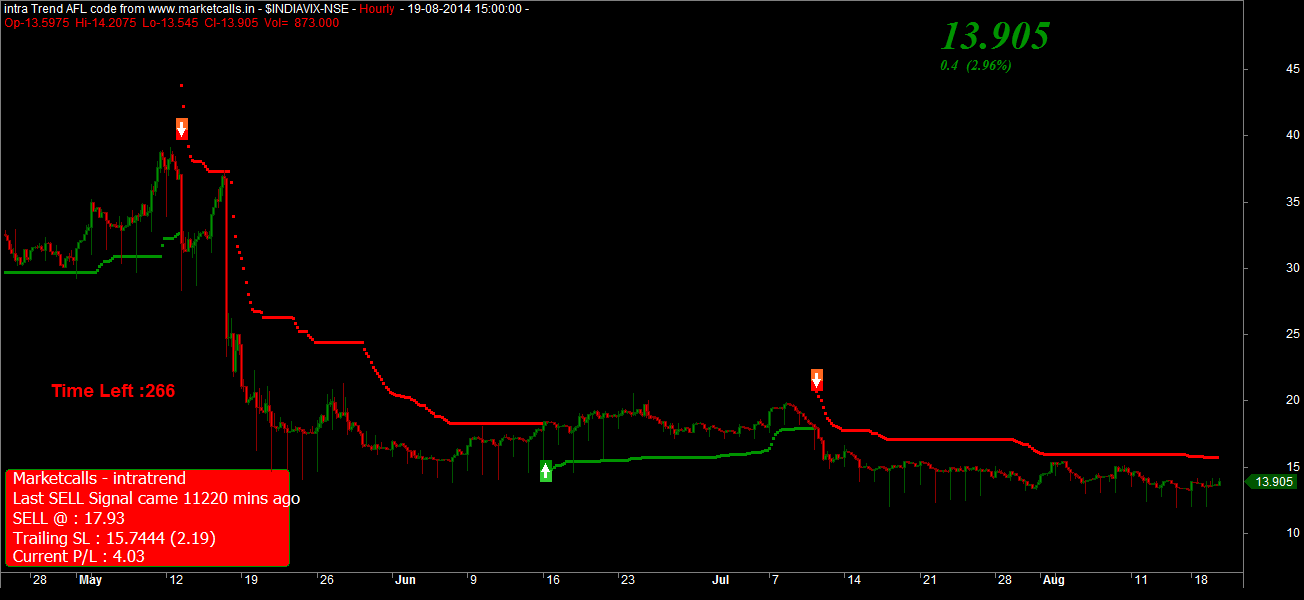
India VIX still maintains the positional sell mode since mid of july 2014 and currently the resistance zone comes under 15.86. Any breakout would like to show increased volatility in the market. Currently no much significant movement in India VIX.

India VIX

Nifty Options Open Interest
Currently both 8000CE holds equal amount of open interest indicates option writers are expecting nifty to show volatility and it could trade in the range of 7300-8000 range. Lot of Volatility expectation from option writers for current month expiry and nifty likely to close below 8000..
Open Interest

Related Readings and Observations

  • Banking stocks Leads the Decline Nifty fell on late wednesday and banking stocks led the decline.The Bank Nifty fell 1.9% as yields on bonds rose, heightening concerns over the lenders' debt holdings. Banking stocks such […]
  • Nifty and Bank Nifty August Overview Last friday nifty lost close to 118 points intraday due to fears of a decline in global money flows if the United States, increases interest rates and due to Argentina's second default in […]
  • Nifty and Bank Nifty Very Close to All time High Nifty and Bank Nifty currently trading very close to its all time high made on the Union Budget 2014 event 7809 and Bank Nifty made a All time high around Election 2014 results 15742.
  • Does Shorting Favors Nifty and Bank Nifty Traders? On the Weekly charts Bank Nifty turned to long term sell mode and nifty still trading below 5EMA(High) and nifty still holds the long term buy mode. Currently the long term resistance zone […]

The post Will Nifty and Bank Nifty extends the Decline? appeared first on Marketcalls.

Time for Crude Oil to Rise?

$
0
0

Crude Oil (11.8.2014) traded lower as per last article & went below $100 mark. Still some support coming back to radar.

Now crude is trading around $98.30 & as we can see on charts, crude trying to bounce back from a ascending tradeline. This tradeline was able to hold crude downside move since june 2013. At present point the area represent 138.2% feb correction level which could act as support. Indicators showing a positive divergence which support a positive outlook for coming trading session.

On fundamental side, increasing global tension & a sudden involvement by US army may boost the prices.
crudedaily
Based on above studies, we expect crude to move higher for possible level around $100.70 & then $103.40 once again. A day close below $94.80 mark will force us to reanalyze the charts.

Note – Above view is based on technical studies & do not represent our buy-sell recommendation. For recommendations Contact Us

Related Readings and Observations

  • Zinc – Major Reversal Chart Pattern in Forming. Now zinc is trading around 2290 on lme & as we can see on weekly chart, there is a strong probability of an ABCD reversal pattern. If we look at daily chart , we find some reversal […]
  • Bearish Crude Oil Technical – Short term overview Crude (20.09.2013) traded in tight range from last 4 weeks, looks like finding a direction, probably on downward.Now crude is trading around $105.50,as we can see on charts, crude have […]
  • Gold Technical Analysis week starting Dec 5th 2011 Gold has been trading in a narrow range since November. It just oscillates between 1000 point range of 28300 to 29300. At the same time it is giving a ascending triangular pattern which is […]
  • Triangle Breakout in Gold Daily Charts Now gold is trading around $1301 & we can see on charts, gold was able to provide a triangle breakout. This breakout was very much awaited after gold placed a bullish candlestick pattern […]

The post Time for Crude Oil to Rise? appeared first on Marketcalls.
Want to become Algo Trader ? How to start learning Algo Trading?

$
0
0

Step 1: Model search. Searching for models of trading systems using traditional methodologies is a tedious, trial-and-error-process. There are no recipes for success and every trader is alone in this highly demanding task. For example, some traders rely on visual inspection of charts and attempt to identify pattern formations that can be modeled as a set of simple rules. Others adopt the algorithmic route and attempt to forecast future price direction using indicators or other mathematical techniques. Thus, the complexity of models can vary widely. Many trading system developers use prepackaged systems and indicators available in software programs used for back testing. However, it is highly unlikely that a combination, or even a variation, of known formulas, indicators, or pattern formations can result in a trading system with profit-making potential. It is often the case that trading rules based on experience or on the visual inspection of price charts can offer more potential than indicators or other fancy mathematical forecasting models.

Step 2: Implementation. After a model of a trading system is available, the next step is to implement it and back test it. In the context of the methodology discussed, it is not enough merely to discover a
trading system model that one might be able to use in actual trading. It is also essential that the model logic is in a form suitable for coding in a programming language. High-level programming languages designed for this particular purpose, and offered with popular back-testing software packages, significantly reduce the time and effort required for developing and debugging programming code. Still, some trading system developers prefer to write their own code due to the limitations in the functionality of high-level-language programming.

QuantTradingCycle

Step 3: Back testing. Back testing involves driving the model of a trading system with historical data input and generating market entry and exit signals. The entry and exit signals in conjunction with the input are then used to calculate a set of performance parameters. Most software programs with built in back-testing functionality also offer advanced graphics capability for plotting entry and exit points on a chart and displaying the equity curve. The use of high-level programming languages provides virtually unlimited flexibility for coding and calculating custom performance parameters and running advanced analysis to determine the statistical significance of the results.All the computational power and implementation flexibility available nowadays is useless unless one can find a model of a trading system that will provide the much-needed competitive advantage. As mentioned previously, back testing is the process of determining and analyzing the hypothetical historical performance of a trading system it does not guarantee future performance.

Step 4: Validation. It is highly recommended to always validate that the results obtained from back testing correspond to the intended operation of a trading system. The validation step does not try to address
the limitations and pitfalls of back testing, but attempts to identify programming and implementation errors.Specifically, validation involves the manual inspection of the back-testing results in order to determine whether the hypothetical historical operation corresponds to the intended operation. Quite often, trading system developers skip the validation step because it involves some tedious manual checking of entry and exit points and a considerable amount of calculations.A random sample of entry and exit points followed by manual calculations based on the mathematical formulation of the model usually suffices to determine with high probability whether the implementation is correct. However, such a method of validation cannot assure that all entry and exit signals the model should have generated were actually generated. The typical reaction of back-testing software program developers is that missed signals do not matter as long as the trader follows the generated signals based on which the historical performance was calculated. Conditions may develop in the future that can trigger entry and exit signals, resulting in a degradation of performance.

Step 5: Analysis. The objective of this step is to determine the suitability of a system in actual trading based on hypothetical historical performance results. Analysis is more of an art than a science, and its effectiveness depends on many factors, including skill and experience. Moreover, the results of back testing can be analyzed only in the context of the model’s intended operation. Thus, the decision of whether to accept or reject a trading system depends on the results obtained but also on the trader’s objectives.For instance, if a trading system designed for use in short-term trading ends up being a longer-term trend-following system, it should be rejected even though the analysis of the results indicates acceptable performance. Many trading systems developers analyze results in absolute terms and not in relation to intended operation. This can result in a conflict between the objectives of the trader and the operation of the trading system. Therefore, the analysis of results should also include determining whether the actual operation of the system conforms to the intended operation in the trading time frame applicable. As an example, some trading system developers use ad-hoc methods to force a system to operate in the trading time frame of interest. This includes, among other things, placing a time limit on open positions. Such practice often results in gradual actual performance degradation due to random factors that can cause, among other things, future volatility to vary significantly from that of historical prices used in back testing.


In the case of back-testing results obtained for trend-following systems, the most important parameter to consider is the profit factor Pf.

A large profit factor indicates that the trend-following system achieves its objective by minimizing losses during sideways-moving markets and maximizing profits during trending markets. The profitability P is
of secondary importance in this case, high values may be needed to avoid degradation of actual performance due to future market conditions. On the other hand, in short-term and intraday trading systems, it is quite hard to obtain a large profit factor. In these trading time frames, the value of the profitability P in conjunction with the average win to average loss ratio RWL are the important parameters to consider, although a large profit factor is always welcome. Similar considerations apply to the analysis of drawdown levels. Trend-following systems must be able to sustain larger drawdowns, but that should not be the case with intraday and short-term trading systems, where increased values probably indicate an unacceptable streak of consecutive losers. Since the maximum number of consecutive losers that can occur in the future is a random variable, it is desirable that the number obtained from back testing is as low as possible.

Rejecting a trading system because of unacceptable back-testing results is much easier than rejecting a system that seems to be acceptable, but chances are it will fail in actual trading. As mentioned previously, analysis of back-testing results is a fairly complex process and its effectiveness ultimately depends on skill and experience. Eliminating subjectivity from the analysis process is as important as developing mechanical systems for the purpose of eliminating emotions from the trading process. If a trading system is accepted but the analysis was not performed properly, although emotions are eliminated from the trading operation, performance is already compromised and the benefits of systematic trading may not be realized. This is one reason it may be preferable to make the analysis of back-testing results automatic; this naturally leads to the concept of synthesis of trading systems.

Step 6: Modifications. After the results of a back test are properly analyzed, the trading system developer may attempt to improve performance by making appropriate changes to the model. For instance, different position exit schemes and money management methods can be implemented in an attempt to determine the best one for the particular market and intended operation. It is important to understand that the model modification step should not be confused with performance optimization. While the former is a useful practice, the latter is not. It is very hard to establish rules for determining when a specific change made to a model transforms it into a completely different model. The only way this can be deduced is by analyzing back-testing results. For example, changing the exit logic from a profit target based on a fixed percentage of the entry price to a trailing stop may result in an increase in the profit factor while at the same time turning a short-term trading system into a trend follower. Thus, all changes made must remain within the domain of intended operation. This is a rule not always followed by trading system developers, who often analyze the results in absolute terms and ignore whether any changes made to the model transform it into a different model not conforming to initial specifications, including trading time frame considerations, initial trading capital requirements, and risk/reward parameters. If one is not careful, such practices may cause trader–system incompatibility, which can be the source of significant losses. Optimization and implementation of ad-hoc methods to reduce losing trades must be avoided in this step. An important empirical rule is that any changes made to a model that reduce the number of losing trades without a proportional increase in the number of winning should be viewed with great suspicion. The reason for this lies in the possibility that such improvement may be just a filter of losing trades based on a limited set of conditions that just happened to be present in the historical data. When the system is employed in actual trading, new conditions may emerge not subject to the same filtering used and performance can degrade to the point of reversing from profitable to unprofitable. This can happen when the system was tested on market data spanning the period of a major prolonged trend. For example, if the developer changes the system logic to filter out short trades by eliminating signals that occur while the difference between a fast and a slower simple moving average is positive, the number of losing trades may be reduced significantly. However, in actual trading conditions, the trend may reverse to a prolonged downturn and the system may end up filtering out short trades occurring near the peak of short-term reversals (those offering the best potential of profit in a downtrend).

By the way, this appears to be a serious limitation of many systems designed for trading equities using data from the period of the longest stock market rally in recent history, from 1993 to early 2000. As a matter of fact, traders who used black-box trading systems based on such native design methodology after 2000 ended up losing money. The best way of avoiding indirect optimization due to special conditions reflected in the historical data is by selecting markets that exhibit several cycles of upturns followed by downturns, such as commodities and currencies. This is especially useful for short-term and longer-term system developing. In the case of intraday systems that do not use other time frames to filter out trades, the effectiveness of such methods to reduce the number of losers may be higher. Model modification is another step in the trading system development process that is plagued with subjectivity and errors and will also be eliminated by the synthesis method.

Lokesh Madan

http://algotradingindia.blogspot.in/

Related Readings and Observations

The post Want to become Algo Trader ? How to start learning Algo Trading? appeared first on Marketcalls.

Restriction On Third Party ATM Withdrawals

$
0
0

In a latest report, it was found that the numbers of ATM withdrawals from third party ATMs will come down to two per month. Currently, the limit is five withdrawals per month for the account holders. However, this is applicable only for the account holders present in cities. As far as, the instructions of Reserve Bank of India are concerned, the banks will have to continue offering the same limit to the account holders in rural areas. The banks will now have to provide details to the RBI regarding the numbers of machines that are present in villages.

Problems For City Customers:

This news certainly comes as a great source of disappointment for the city account holders. This is because if they do not have a home bank ATM available to them, and they have completed the limit of free withdrawal for two times, they will have to look for home bank ATMs in other areas. Otherwise, they might have to pay up to Rs20 for any cash withdrawal from other ATMs that are not of the home bank. This can surely cause some kind of trouble for the account holders of cities, or they have to end up paying excess amount on their withdrawal from other ATMs.

Freedom Of Atm Operations Required:

As far as, the customers are concerned, the existing regime of free withdrawal up to 5 times should continue. According to them, this is required for the development of the market. They claim that the freedom of white label operators of ATM should not be limited or restricted. In addition to that, price points should also not be dictated through inter-bank interchange charges. In fact, some of the executives of ATM deploying companies are of the same view. The restriction has not yet started, but it is expected that the limit would start getting applied.

Banks Had To Pay Transaction Fees:

It was in 2009 that access to the third party ATMs was made free. As a result, customers could withdraw money from any ATM. It was due to a representation from banks that RBI agreed to cap the number of free withdrawals. It was then restricted to 5 withdrawals a month in other third party ATMs. The limit for total cash withdrawal from third party ATMs was fixed to Rs10, 000. Though this transaction was free for customers, home banks had to pay about Rs18 per transaction to the third party banks for using their machines. This turned out to be a major expense for the banks.

atmusage_fotor

Increasing Numbers Of ATMs:

Brown label ATMs were installed by the banks and the major investments came from technology companies. They made investments on behalf of the banks and collected rents from banks in return. This was an additional expense for banks. However, it was because of this reason that the numbers of ATMs has increased over the years and customers could enjoy the benefit of withdrawal. With increased restrictions, account holders will have to be more careful while withdrawing money from third party ATMs.

Related Readings and Observations

The post Restriction On Third Party ATM Withdrawals appeared first on Marketcalls.

An Insight Into The Reasons For The Average Indian’s Cold Feet About Stock Markets

$
0
0

In India, out of a population of approximately 123 crores, only a meager 2.25 crores (approx) dabble in stocks. A general sweeping assumption would be that the stock markets are not meant for people with a limited risk appetite. But when we scrape the bottom, a whole new scenario emerges. In the larger scheme of things, people keep a safe distance from stocks because of the legal and corporate pitfalls that arise from loopholes in the system.

stock fear

For an average middle class Indian, savings is all about securing the future through 2 essential investments- gold and real estate. A roof over the head and freedom from the rigmarole of rent paying is any average man’s dream. And the infatuation of Indians with amassing gold lies in their cultural roots. Most of the savings of a salaried man are parked in gold which is imperative for marriage purposes. When thinking about investment, most Indians shy away from investing in stocks. The fear is often deep-rooted and stems from uncertainty and half baked knowledge. Additional income also comes from interests from fixed deposits in banks. But in a country struggling to battle inflation, the income from interests is often negated by rise in overall prices. Hence the income is not surplus after all, it is simply a maintenance of a person’s purchasing power. For example, if bank interest on a sum of Rs 1 lakh is Rs 9000 and inflation is at 9%, then the income and expenditure are evened out.

The RBI feels that the reason behind this limited mindset is a mistrust of government officials and their inability to control inflation. The average Indian’s mental block to stock markets can be attributed to corporate misgovernance and the fleecing of investors by financial intermediaries. Besides even though the stock markets have given impressive returns in the past, it has been observed that even though the large cap stocks performed well, the overall performance of the mid cap and small cap stocks were erratic. With the volatility, uncertainty and the hairpin bends that stock markets always take, the safe-playing masses prefer to steer clear of cash equities.

But the benefits of long term investing cannot be undermined and the government is beginning to sit up and take notice of this scenario. SEBI has been empowered considerably and risk surveillance systems have been put in place to increase credibility in the equity markets. However on the flip side, even though SEBI is adopting risk management actions, there is still a certain amount of manipulation and lack of liquidity in equity markets.

Actions already taken by the government to improve the investment climate in India include the establishment of SEBI, depository of shares, screen based trading, clearing corporations, settlement guarantee fund, rolling settlements, disclosure rules for companies among other things.

Strong laws for corporate governance along with steps to safeguard public sentiment can go a long way in turning the tide. Occurrences like the Saradha scam in Bengal or the infamous Satyam scam can only be contained by strong foolproof tabs on corporate malpractices and corruption. The saradha scam exposed the chit fund farce that was being played out in rural Bengal where lakhs of people invested their hard earned savings and consequently lost every penny in the bargain. And finally a control on inflation is also necessary so that the investors get to see some real returns as opposed to a mere balancing out of income and added expenditures.

Related Readings and Observations

  • Dalal street handicapped with no long term trust capital Literally speaking ,if you are not careful and mindful in any money dealings be it with auto or taxi driver. electrician, plumber even vegetable vendors ,the crime takes place in India for […]
  • Trading in cash market? Think again… All of us have only one objective while entering the stock market, it is to make money. However, we all forget one important thing. In stock market the competition is severe. We are […]
  • The 7 Golden Principles of Stock Selection A seasoned investor has to invest time and effort into evaluating the real value of a stock. Making a wise and informed choice has a lot to do with a holistic research and trend analysis […]
  • Corporate Fixed Deposits, Credit Ratings: An Overview Financial Companies and Non-banking Finance Companies call the public to invest with them for a fixed time, carrying a prescribed rate. Company Fixed Deposits are like your deposits with […]

The post An Insight Into The Reasons For The Average Indian’s Cold Feet About Stock Markets appeared first on Marketcalls.

Nifty and Bank Nifty Trend Update – 14th Aug 2014

$
0
0

Nifty Spot Hourly Charts
Nifty Spot

Nifty on the hourly charts turned to positional buy mode with support coming around 7610 and on contrary Bank Nifty still maintains the positional sell mode with resistance zone coming around 15120 reverse your position to buy mode if the resistance zone breaks on the hourly charts.

Bank Nifty Spot Hourly Charts
Bank Nifty

Nifty Open Interest

Nifty Open Interest shows bullish picture as currently 7600PE shows highest open interest amoung the option series and the put writers strongly believe that 7600 will be the current month support on EOD basis.

Open Interest

Related Readings and Observations

  • Nifty and Bank Nifty June Expiry Overview Nifty and Bank Nifty maintains the positional sell mode with resistance zone coming around 7673 and 15569 respectively. Reverse your position to positional buy mode if the resistance […]
  • Call writers take advantage post IIP results Industrial production grew at 3.4 per cent in April after contracting for two months in a row mainly due to improved performance of manufacturing, mining and power sectors and higher […]
  • Will the Volatility in the Market Increase? Indiavix on the hourly spot charts is in positional Buy mode with supports coming around 15.22. Reverse your position to positional sell mode if the support breaks on the hourly charts. […]
  • Nifty and Bank Nifty Strategy Overview Post Election Results As of now 7500CE and 8000CE has the higher open interest which indicates a possible resistance at 7500 for the current month. As Nifty Responded with a sharp reversal from the high on […]

The post Nifty and Bank Nifty Trend Update – 14th Aug 2014 appeared first on Marketcalls.

BSE to Levy Transaction Charges for Currency Derivatives

$
0
0

BSE in its latest circular stated that it will start levy Transactional Charges for Currency Derivatives(Futures and Option Contracts).The charges will be increased in a phased manner from Rs2 per crore from 1 December to Rs10 from 1 October, 2015.

BSE Currency Trading

The charges for currency derivatives would be Rs 2 per crore of turnover for two months from December 1, 2014 to January 31, 2015, and would increase to Rs 4 for the next two months. It would further rise to Rs 6 from April 1, 2015 for two months, then to Rs 8 for next two months and finally to Rs 10 with effect from October 1, 2015.

Currently NSE and MCX-SX is charging Rs100-115 per crore of turnover in currency futures segment in four different slabs.For currency options, the NSE charges are Rs 30-40 for every Rs one lakh of premium value in three slabs.

The BSE launched its currency derivatives platform in November 2013 and has not levied any transaction fees for these trades since then. In its circular dated March 21, 2014 BSE had waived of transaction charges on currency derivative trades till November 30, 2014 and interest rate derivatives trades till January 31, 2015.

NSE and MCX-SX began charging these trades in August 2011 after an order from the fair trade regulator Competition Commission of India (CCI).

Related Readings and Observations

The post BSE to Levy Transaction Charges for Currency Derivatives appeared first on Marketcalls.

Technology Based Risk in Financial Market’s by Lokesh Madan.

$
0
0

stock-trader

When I meet India’s & International Top Prop Desk MD or CEO.Their main concern is Not about Returns.But its Risk Which occurs due to Technology.So we short listed some important points to highlight the Risk occurs due to High Tech Technology used in financial Markets.In our conclusion we provide solution to this problem.

It goes without saying that the reliance on technology in today’s financial markets is so great that technology risk is a massive issue for organizations& we all know the benefits that technology has brought to the industry have been very significant, shaping today’s globalized business of raising capital, trading and investment. Without doubt the capacity that technology has generated has led to the large growth in volumes and the introduction of new and sophisticated products. As we know, it has also transformed the way in which operations perform their tasks, giving a wide range of benefits from dematerialized settlement to added-value client services. However, this radical transformation of the industry has been accompanied by the introduction of technology risk. This risk is, perhaps not surprisingly, a significant element in operational risk but how and why does technology risk arise?

Technology risk can arise in many ways. Take, for instance, an organization that invests in new technology, either new to the business or new to the marketplace. The risk here is that the technology may be untried and subsequently proves difficult to work with, fails to meet requirements or is unreliable in operation.

Alternatively, a firm may create technology risk by under investing in technology so that the operational processes become increasingly affected by the inadequate and failing systems.

There is also the risk of technology-based projects taking longer to complete or being over-budget and, in some cases, there may be inadequate training of the teams supporting and using the technology. Elsewhere in the article we have commented on the dangers of projects being mismanaged and over-running and, of course, in extreme cases the projects may be shelved because the funding and/or time runs out – costly mistakes in monetary as well as competitive and risk terms.

Implementation itself can, of course, be a risk with everything from inadequate training to underestimation of converting data from the old to the new system and adequate controls to reconcile this process.

Risk issues due to Technology :


1) Errors in the development of software ( OMS,Risk Management System or Trading Software). The complex nature of the investment banking industry means that any support system would require complex algorithms or business rules to be developed. Unless there is comprehensive testing, there is a risk that the algorithms may be incorrectly programmed.

2) Errors in formulae or mathematical models.( Quant or Algo Strategies): The nature of some products like derivatives requires development of complex models for revaluation or margin purposes. New products are constantly being introduced and new models need developing or existing ones updated.
3) The quality and availability of systems support ( Colocation,Various venders) can be a major issue and cause severe problems in the operations environment.
4) Problems with static data input( Algo Variable Inputs) and maintenance affecting key processes like revaluations, expiry of products, corporate actions,etc.
5) Failure in Network / Hardware or communication channels.
6) Inadequate security over the system and its output.

Let us discuss in detail:::

1) Core Risk by Technology :: System risk


A core technology risk is system risk. The failure of a system to perform or to be reliable can have far-reaching implications for an organization. Recommendation 2 – 2000 of The International Securities Services Association Recommendations 2000 illustrates the importance of systems in allowing the efficient and risk-managed environment for securities clearing and settlement by considering technology risk from the point of view of core processing. In commenting on securities systems in the clearing house/custodian/Central Securities Depository fields it states:

ISSA 2000 Recommendation 2
Securities systems must allow the option of network access on an interactive basis. They should cope with peak capacity without any service degradation, and have sufficient standby capabilities to recover operations in a reasonably short period within each processing day.
The considerations in formulating this recommendation were the market infrastructure and the impact from the technology perspective.

Their findings were that market infrastructure will need to accommodate:
1) Increasing volumes of traffic and volatility in markets
2) Globalization of investment
3) Emergence of electronic communication networks (ECNs) as virtual exchanges
4) Demand for real-time settlement of stock and cash with a move to real time or rapid multiple batch intra-day settlement
5) Demand for flexible processes allowing delivery versus delivery of stock both internally and across depositiories
6) Longer hours of operation for trading and need to support 24-hour, 7-day week operations.
7) Circuit breaker execution on time.
8) Control on HFT speed.

This is a major issue for the industry as initiatives like STP rely on the ability of the key market organizations to put in place the above. From a technology perspective, this gives rise to:

• Utilities that serve multiple trading markets or platforms
• Systems that can accommodate surges in activity (in transaction processing and information transmission) without any degradation of service and response time
• Real-time process enabling interactive communication to facilitate intra-day traffic
• Linkage to the appropriate real-time cash settlement processes
• Adequate contingency and back-up, minimizing the risk of outages that could prevent the timely completion of settlements on the contracted date
Each of the above issues is significant to both the suppliers of the systems and the users. The risk of defaults and financial losses increases when settlement is delayed and clearing houses, CSDs and custodians cannot afford to have or interact with unreliable core systems.
As ISSA points out, this implies that the technology infrastructure must have:
• Open access to on- and off-exchange markets
• Scaleable systems covering the maximum forecast daily volumes
• Resilient and fault-tolerant processes
• Continuous processing capability with interactive user communication links
• Adequate stand-by allowing for recovery of operations, without any loss of data in a reasonably short period within the working day
Operations managers will be familiar with the problems created by system downtime. It is a source of concern to risk managers as well, not least because the dealing activity cannot realistically be suspended every time the operations systems are down, even though it is not possible during this time to verify totally the exposure of the business. When we talk about system risk we need to differentiate between the internal system risk and the external risk as described in the ISSA Recommendations, and yet both are very significant issues in different ways.

Internal system risk

This is a risk that to some extent at least is under the control of the firm. The system is either in-house or supplied and may be supported internally or externally or both. It is chosen to meet the business requirement of the firm and developed accordingly. The risk associated with it would be:

• Capability to meet current and future levels of business
• Ability to handle products
• Age of system and reliability
• Poor maintenance capability
• Understanding of the scope of the system by operations managers and teams
• Comparison to other systems

When considering the degree of system risk it has, a firm must pay particular attention to these risk situations and be satisfied that the business is not being compromised as a result. If any are evident then the operational risk level is going to be increased, if the impact of any is compromising the clearing and settlement processes then the risk level is likely to be, or will become, critical. As a result, systems will need to be reviewed then redeveloped or replaced.

External system risk
The principal problem with external risk is that the firm is not very often in control, i.e. they have to utilize the system or services in any case. It is this impact of systems in the counterparty that worries ISSA and led to their recommendations.
The failure of systems within counterparties, whether they be prolonged failures or just inadequate functionality has a profound impact on the performance of the operations team within the user.

For instance, the inability to provide timely and accurate data from a custodian has an impact on the client, likewise the inability of a CSD to receive and process correctly instructions. However, the problem is not just with the organizations within the clearing and settlement infrastructure, it also lies with the suppliers of systems to the banks, brokers and institutional clients.

Late delivery of system releases, errors in newly released functionality and failure to rectify errors with software in a timely fashion can all have a drastic affect on the operations team’s ability to carry out the function efficiently. This in turn increases the risk. Monitoring of the system and support performance is therefore essential and while service level agreements may give some comfort they do not remove or negate all the risk.


2) System security

With systems and technology at the heart of the industry and the businesses it is not surprising that system security is considered a major operational risk. Fraud, money laundering, manipulation of data, technology criminals, Strategies leakage, terrorism and ‘for fun’ hackers all present a very real danger to businesses. In many cases the business is vulnerable because of poor security over access and/or availability of data output from the system.
Operations managers have a responsibility to ensure that the data input and output to and from the systems is in a controlled environment. This may seem very simple but in reality can actually be very difficult as the need to be able to carry out the processing functions can create areas where there is a conflict of interest with risk control. For example, it is late in the day and a new product has been traded that needs to be set up on the system. The natural control to prevent fraud would be to have an independent person from deal input/processing set up the product on the system. This would incorporate an independent check that the product was duly authorized etc. However, if this person (and any support) is not available or they are not competent to set up the product on the system there will be problems. As a result of not being set up or set up incorrectly the trade may not be processed, affecting records and reporting, and could affect clients and generate both operational and possibly regulatory risk.
However, if the processing team are permitted to set up products in the system there is a different, but just as dangerous, weakness.
Organizations overcome this by sometimes having static data teams and manage the situation through ensuring availability of trained staff and setting deadlines for the time to set up a new product in the system. By instituting adequate procedures and controls the situation can be managed but incorporating this into headcount, operational hours and ensuring adequate competency is not easy, particularly in smaller firms.
On a more simplistic but nevertheless important note, password control into systems can be, and often is, woeful. Not only are passwords often freely shared, but they can take an age to be disabled after a person leaves the organization. Slack access rules open up an
organization to all manner of dangers that, to be fair, the operations team member may not recognize. We have probably all used someone else’s access code to expedite a quick solution to an inquiry, particularly when dealing with a client inquiry and they are waiting on the telephone for the reply. However, this cannot, in risk terms, be justified. The situation where the access code of a departed employee takes days, sometimes weeks, to be disabled is a totally unacceptable risk.

Problems also exist today with so many organizations offering and taking services via the Internet. Without question this is a quick and very attractive medium to communicate and get information, for instance from exchanges. However, unless there are adequate controls and protection to the systems a disaster is waiting to happen. It may be unsavoury that employees might access and download pornography, but the real danger is the vulnerability to viruses and hackers. Activists for various anti-capitalist groups, criminals and terrorists can bring a company quickly to its knees if they can access the core systems. With people often on the inside, i.e. employed in the firm, any weakness that can be discovered and then conveyed to compatriots on the outside presents a massive risk.

3) Business-continuation risk


With the exception of a regulatory suspension or ban, nowhere is there more risk to the continuation of the business than technology.If we look back at some of the risks we have already mentioned, most of them could manifest themselves into a very significant problem, some quite quickly. A virus, for instance, or a major problem with the implementation of a new system would be examples. Yet it is the loss or severe disruption of a system that perhaps creates the greatest concern in many people’s minds. Even in London businesses have faced the threat of terrorism for many years and the Irish Republican Army (IRA) has, while never stopping the financial markets, or indeed firms operating in the markets, from continuing their business, given insight into the consequences of losing infrastructure like buildings.

Although the threat from the IRA has to some extent been reduced by the Northern Ireland peace process, dissidents still harbour ideas about attacks on Britain and crave the publicity that a ‘big one’, i.e. bomb, brings. This was highlighted in the USA and indeed the world by the terror attacks of 11 September 2001. In both cases despite appalling destruction, deaths and damage, most businesses defiantly survived and continue in operation today. They did so because of disaster recovery and business-continuation policies that enabled them to re-establish the business, including systems, in an alternative location.

These types of massive disruption are a risk, there can be no question about that, and yet other potentially equally dangerous situations to the business exist.

As technology advances so the industry moves forward. Many key players in the infrastructure of the capital markets are coming together in mergers and alliances, changing the whole way in which business, including clearing and settlement, is carried out. As the systems move forward in the drivers we talked about earlier in this article take effect, some firms are caught in a very difficult situation.

Redeveloping or replacing systems is neither cheap nor particularly easy to implement and yet a failure to modernize the systems can have massive implications for the business. On the one hand, there is the possibility of being unable to meet exchange or clearing house interface capabilities and therefore being unable to continue as a member of that organization. On the other, operations teams faced with increasing demands from clients for ever more sophisticated technology-based services cannot compete with other firms because of outdated systems.

These both pose significant threats to the firm and need to be addressed by a long-term commitment simply because the pace of change is unlikely to slow and ‘temporary patches’ are no solution.

Operations managers must therefore be very aware of their role in helping to plan and develop the system capabilities for the firm, as wrong decisions on the choice of system and the future requirements are not just simply an embarrassment and a financial loss, they may be terminal and prompt the firm to consider outsourcing the operations function. Given the threat to the business of the failure of systems to be adequate from a business and regulatory aspect, one can see why the directors may decide that the risk to the continuation of the business is too great, not to mention the investment, to maintain an Operations function.

There are, of course, many sound arguments for investing in systems and utilizing the Operations function as a revenue generator and support service to the business and its clients. So providing the Operations managers can show their ability to manage systems, both in usage and development capacity, there is no reason to believe that business-continuation risk cannot be adequately managed.


Finally the —- Technology is power. It is also a risk. So re test 10 times on all above mention points before goes into Production line.
One of the Solution for Technology Risk :

There is a General insurance provided by three insurance company by which you can protect your pro desk under Technology risk occurs. Flash crash can also be insured using this policy.

Please write your comments:
Lokesh Madan
http://algotradingindia.blogspot.in
 

Related Readings and Observations

The post Technology Based Risk in Financial Market’s by Lokesh Madan. appeared first on Marketcalls.

Nifty Future Research Report 18th Aug 2014

$
0
0

Nifty Weekly Research Report

Nifty

Nifty Future Hurdle 7835
Resistance 7870 7920
Supports 7765 7725

Technical Update: Nifty future closed the week on a positive note on weekly chart. Nifty future closed Friday’s trading session at 7803.70. Nifty future has been consolidating in a sideways horizontal range with just around the breakout. There is a huge possibility of a big rally in coming days if the breakout sustains nifty future is heading for 8000-8100 levels soon. 7835 Hurdle once sustain close base bulls will shoot up vertical rally. Bear’s stay out or wait before entering shorts.
Price: Price action still suggest a buy in dips market as bulls come at every support with buying. No major correction has been seen this past week. Thou Nifty achieved the upside targets as suggested in our previous weekly report.

RSI: 14day daily RSI is @ 58. The momentum indicator is showing sign of short term uptrend and market is at strong resistance levels.

Trend: Short term trend up with cautious bias, medium term, primary trend are up with strong support at 7560 levels

Volume: The rally on Thursday was on weak volume as compared to the previous seen rally’s.

 
Trading Strategy: Short term traders be long or out. Above 7835 market holds then shall rally big upside. Trader’s holding long should book partly open positions around 7835 rest can trail there pos to cost stop loss with upside targets of 7890 and 7950.

Related Readings and Observations

The post Nifty Future Research Report 18th Aug 2014 appeared first on Marketcalls.
USDINR and GOLD Spot Price Medium Term Outlook

$
0
0

USDINR Spot Price – Daily Chart
USDINR

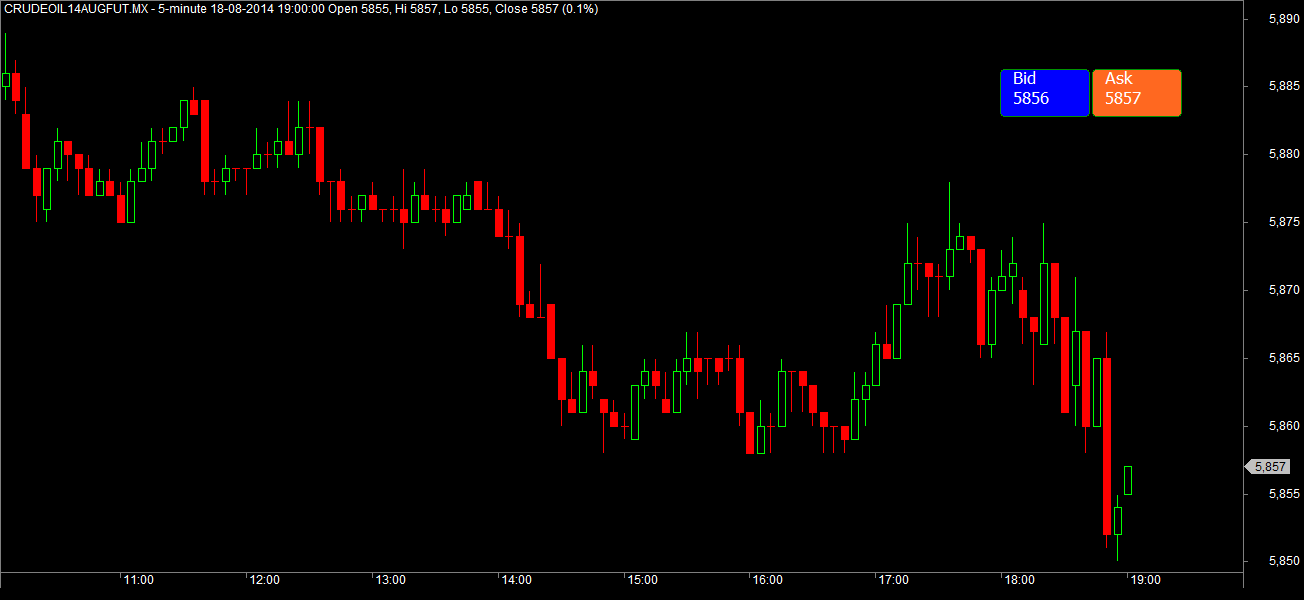
Currently both USDINR and Gold maintains a medium term buy mode. And the support zone comes around 59.55/Dollar and 1260.6 respectively. Outlook will turn bearish if the support zone breaks on the Daily Charts.

Gold Spot Price – Daily Chart
GOLD

Related Readings and Observations

  • Triangle Breakout in Gold Daily Charts Now gold is trading around $1301 & we can see on charts, gold was able to provide a triangle breakout. This breakout was very much awaited after gold placed a bullish candlestick pattern […]
  • Lead on Reversal Pattern. Now Lead is trading at 2226 on LME & as we can see on charts, lead was able to produce a negative candlestick pattern after touching the topline of short term channel . The top line was […]
  • USDINR Long Term and Short Term : July Month Overview USDINR on the daily charts very recently turned to long term buy mode since 16th June 2014. Currently the EOD support comes near to 59.06. USDINR will turn to long term sell mode if the […]
  • Will Gold Resume Downtrend Move Again Now gold is trading around $1271 mark & as we can see on charts, gold retested the upper tradeline of minor descending channel & placing a bearish candlestick pattern once again […]

The post USDINR and GOLD Spot Price Medium Term Outlook appeared first on Marketcalls.
How to Plot Bid Vs Ask Dashboard in Amibroker

$
0
0

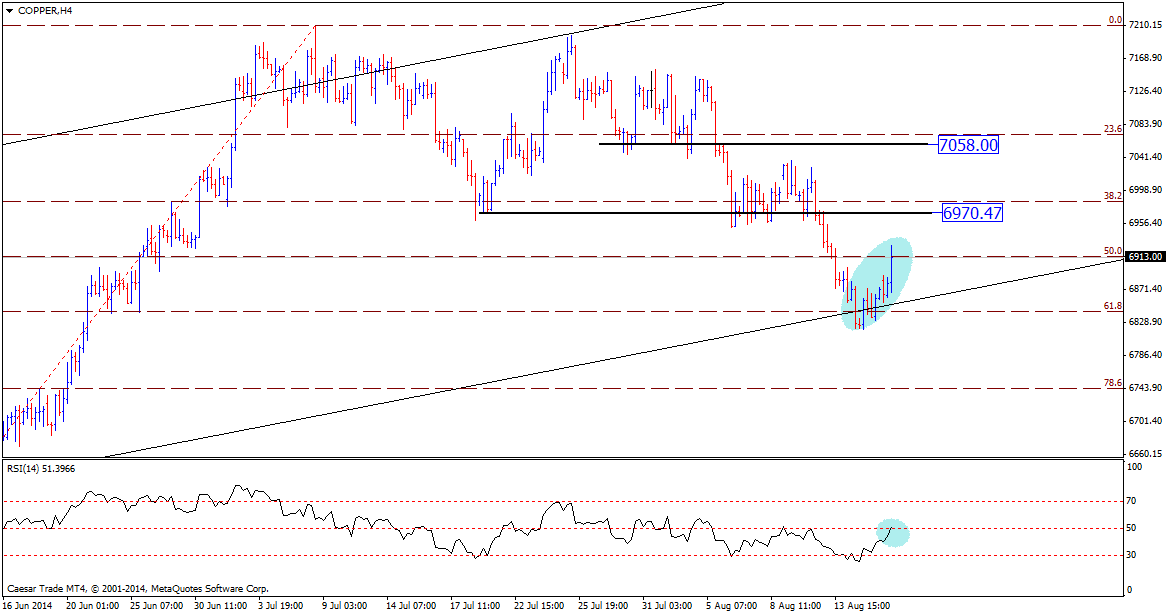
Here is a little Bid Vs Ask Dashboard for Amibroker users which helps to monitor the Bid-Ask Spread during live trading. In a highly liquid market the Bid Ask spread difference will be very thin whereas in a illiquid script the Bid-Ask spread get wider due to less number of buyers and sellers.

How to Get Bid Vs Ask Data
Amibroker supports a function called getRTdata() to retrive realtime data fields like Bid, Ask, BidSize, AskSize, Volume, Last…etc. refer here for more detailed reference

Requirements
1)Realtime Data Subscription Supporting Bid, Ask, BidSize, AskSize, Volume, Last.
2)Preferably Amibroker 5.6 verion or above.

Crude Oil Bid Vs Ask Dashboard
Crude Oil Bid Ask Dashboard

Steps to Install Bid Vs Ask Dashboard
1)Downlad Bid Vs Ask Dashboard Amibroker AFL Script
2)Unzip to local folder and Save the AFL script in C:/Program Files/Amibroker/Formulas/Basic Charts folder.
3)Now goto File->New Blank Chart and Apply the Candle Stick Chart or your favorite Trading System
4)Now goto Charts->Basic Charts->Bid Vs Ask. Drag and Drop it to the Charting Space.
5)Bingo you are done. Now you should be able to see the Bid Ask Dashboard as shown above.

Related Readings and Observations

The post How to Plot Bid Vs Ask Dashboard in Amibroker appeared first on Marketcalls.
Copper – Upside Move Ahead – Technical Analysis

$
0
0

Copper (19.8.14) traded lower as per expectation & reach to the support zone.

Now copper is trading around 6913 of lme & as we can see on charts, copper provided a false breakout below the lower tradeline of the ascending channel.However it was able to bounce in over night electrinic trading. The bouncing area was well supported by the 61.8% feb correction of the last bull wave as well as representing a parallel support from mid june 2014. RSI recovering on day charts while on 4h overcoming 50 mark.

On fundamental side , continue improving data from US might start supporting commodities as well as in this week fed meeting is pending & expecting interest rates to keep on life time low for some more time.

COPPERH4

Based on above studies, copper has major probability of reversal & reach to possible levels 6970-7058 in coming trading session.

Note – above view is based on technical studies & do not represent our buy-sell recommendation
For recommendations Contact Us


Related Readings and Observations

  • Copper technical analysis – Time to sell? Now copper is trading around 7120 area on lme & as we can see on charts , with a top (probably false) above the tradeline copper trimmed its rally & looking for some downside move […]
  • Copper Technical Outlook for October Now copper is trading around $3.2928 & as we can see on chart, copper facing a resistance at topline of current descending channel which is also represent the 78.6% feb correction level of […]
  • USDINR and GOLD Spot Price Medium Term Outlook Currently both USDINR and Gold maintains a medium term buy mode. And the support zone comes around 59.55/Dollar and 1260.6 respectively. Outlook will turn bearish if the support zone […]
  • Time for Crude Oil to Rise? Now crude Oil is trading around $98.30 & as we can see on charts, crude trying to bounce back from a ascending tradeline. This tradeline was able to hold crude downside move since june […]

The post Copper – Upside Move Ahead – Technical Analysis appeared first on Marketcalls.
Nifty At All time High – Will it Push Up More?

$
0
0

Nifty once again made a fresh All time intraday high 7918.55 however still Bank Nifty struggling near the previous all time high 15742 made on 16th May during Election Results 2014.

Nifty Spot Hourly Charts
Nifty Spot

Nifty and Bank Nifty on the hourly charts maintains the positional buy mode with the support zone coming around 7766 and 15195.6 respectively reverse the position to positional sell mode if the support zone breaks on the hourly charts.

Bank Nifty Hourly Charts
Bank Nifty Spot

India VIX Hourly Charts

India VIX maintains the prolong sell mode and staying below the sub 14 level. Currently the resistance zone comes near 17.93 reverse your position to positional buy mode if it breaks on the hourly charts.

India VIX

Nifty August Options Open Interest

Suddenly 8000CE call writers started writing once again and 7600PE writers those who dominated this season saw little amount of unwinding. 8000CE currently holds the highest open interest across strike prices which indicates call writers believe that market holds the EOD resistance of 8000 for current expiry month.

Open Interest

Related Readings and Observations

  • Nifty and Bank Nifty Trend Update – 14th Aug 2014 Nifty on the hourly charts turned to positional buy mode with support coming around 7610 and on contrary Bank Nifty still maintains the positional sell mode with resistance zone coming […]
  • Will Nifty and Bank Nifty extends the Decline? Nifty and Bank Nifty hourly charts maintains the positional sell mode. Currently the resistance zone comes very close to 7733 and 15203 respectively. Reverse your position to positional […]
  • Banking stocks Leads the Decline Nifty fell on late wednesday and banking stocks led the decline.The Bank Nifty fell 1.9% as yields on bonds rose, heightening concerns over the lenders' debt holdings. Banking stocks such […]
  • Nifty and Bank Nifty August Overview Last friday nifty lost close to 118 points intraday due to fears of a decline in global money flows if the United States, increases interest rates and due to Argentina's second default in […]

The post Nifty At All time High – Will it Push Up More? appeared first on Marketcalls.
Start Trading on SGX Nifty from India – Complete Details.

$
0
0

Sgx nifty futures

SGX Nifty

SGX Nifty – Futures & Options

Key Features of SGX Nifty

1. International benchmark for Indian equity
2. USD-denominated
3. No FII requirements
4. Lower cost structure – Lower exchange clearing fees, No transaction and capital taxes, Interest payable on margins
5. Extended trading hours
6. Availability of cross product margins offset
7. Co Location available.
8. CFTC-approved
Benefit of SGX Nifty Trading.

Its first important Point is – Nifty is available to you from 6:30 AM Indian time at Singapore till 3:30 AM India time at India.
Now Futures as well as options trading is approved.

The Singapore Exchange, which started trading in Nifty options in December 2011, may very well see a significant portion of volumes moving overseas. Lower transaction costs due to lower taxation will likely result in Singapore emerging as the destination of choice for trading in Nifty options, suggest some experts. Options are a type of contract which gives the buyer the right but not the obligation to buy a security at a certain price. For the privilege of being able to do so, option sellers or writers, are paid a premium. They are a more popular product than futures since unlike the latter; the downside is restricted to this premium. The securities transaction tax, a levy of 0.125% on the value of all share market transactions in India, is expected to cause investors to prefer taking their positions in Singapore. The exchange is currently trading in Nifty futures and has close to a tenth of the turnover on the NSE.Index options account for the majority of trading volume on the NSEcomprising 64.4% of the average daily turnover on the exchange during last December. In April-November 2010, the government collected Rs4,373 crore by way of STT.
SGX get their approval for Option Nifty Trading

Singapore Exchange has obtained licensing rights and expects to provide S&P CNX Nifty Index (Nifty) options and related products in end of Year 2011.Licensing rights from India Index Services & Products Limited (IISL) will allow SGX to offer the product range including derivative contracts on the CNX Nifty Junior, CNX 100 and CNX Midcap indices. Subject to regulatory approvals, the products may be added amidst rise in the trading of India-related products on SGX.
SGX Nifty – Futures contract SpecificationsUnderlying Stock Index – S&P CNX Nifty Index is a market capitalization-weighted index of 50 component stocks listed on the Indian bourse.
Contract Size – US$2 × SGX S&P CNX Nifty Index Futures price ≈ US$11,000* (*assuming futures price of 5,500) .
Contract Months – 2 nearest serial months and Mar, Jun, Sep and Dec months on 1-year cycle.
Minimum Price Fluctuation – 0.5 index point (US$1.00)
Trading Hours (Singapore Time) – T session: 9.00am – 6.10pm T+1 session: 7.15pm – 2.00am (next day)
Last Trading Day – Last Thursday of the expiring contract month. If this falls on an India holiday, the last trading day shall be the preceding business day.
Settlement Basis – Cash settlement
Final Settlement Price – Official closing price of the S&P CNX Nifty Index rounded to the nearest 2 decimal places.
Negotiated Large Trade (NLT) – Minimum 50 lots
Margins (as of 11 Aug 2011) – Maintenance: US$550
Daily Price Limits – Temporary Price Limits
Effective from 10 October 2008 until further notice from the Exchange
a. an Initial Upper and Lower Price Limit of 10%
(when the Initial Price Limit at 10% is reached, the Exchange will only signal a Cooling Off Period* if the underlying cash market for the SGX Nifty Contract is closed)b. an Intermediate Upper and Lower Price Limit of 15%c. a Final Upper and Lower Price Limit of 20%.

Cooling Off Periods* for all price limits (10%, 15% and 20%) will be 5 minutes. There shall be no price limits for the remaining of the Trading Day after the Final Cooling Off Period*.

For the avoidance of doubt,

(i) if the Exchange signals a Cooling Off Period* when the 10% Upper or Lower price limit is reached, all resting bid and offer orders beyond the 10% price limit will automatically be removed from the order book.

(ii) once the Initial Upper and Lower Price Limit of 10% is reached for the Trading Day, the SGX Nifty Contract will then be subject to the Intermediate and Final Price Limits (15% and 20% respectively) for the remainder of the Trading Day. This will apply regardless of whether the Exchange signals a Cooling Off Period* when the Initial Upper and Lower Price Limit of 10% is reached.

There shall be no price limits on the Last Trading Day of the expiring contract.

Settlement Basis – Cash Settlement. The Final Settlement Price shall be the official closing price of the S&P CNX Nifty Index, which is derived based on the average weighted prices of the individual component stocks of the index during the last 30 minutes of trading. The official closing price will be rounded to two decimal places.

Position Limit – A person shall not own or control more than 25,000 contracts net long or net short in all contract months combined.

1. SCOPE OF CONTRACT SPECIFICATIONS AND DEFINITIONS


These SGX S&P CNX Nifty Index futures contract specifications (“these specifications”) govern futures trading in the SGX S&P CNX Nifty Index on the SGX-DT Market. The rules and procedures for trading that are not specifically covered in these Specifications shall be as set forth in the Trading Rules.1 Capitalized terms used herein and not otherwise defined shall have the meanings ascribed to them under the Trading Rules. For the purposes of these Specifications and unless the context otherwise requires, the following capitalized terms shall have the meanings set forth below:

Contract Refers to the SGX S&P CNX Nifty Index Futures Contract traded on the SGX-DT Market;

Cooling Off Period Refers to a period of ten (10) minutes or such other period as the Exchange may from time to time prescribe during which each Contract may only continue to be traded at or within its Price Limits for the time being in force;

Final Lower Limit Refers to a price of twenty percent (20%) or such other amount as the Exchange may prescribe from time to time below the previous day’s Daily Settlement Price for such Contract;

Final Upper Limit Refers to a price of twenty percent (20%) or such other amount as the Exchange may prescribe from time to time above the previous day’s Daily Settlement Price for such Contract;

Initial Lower Limit Refers to a price of ten percent (10%) or such other amount as the Exchange may prescribe from time to time below the previous day’s Daily Settlement Price for such Contract;

Initial Upper Limit Refers to a price of ten percent (10%) or such other amount as
the Exchange may prescribe from time to time above the previous day’s Daily Settlement Price for such Contract;

S&P CNX Nifty Index Refers to a free float-adjusted, market capitalization-weighted
index representing a diversified 50 stock index owned and managed by India Index Services & Products Limited;

Indian Business Day Refers to a day on which the National Stock Exchange of India
is open for trading.
1 Trading Rules refers to the Futures Trading Rulebook, which may be found on the Exchange’s website at

http://www.sgx.com

2. TRADING

2.1 Trading Months and Hours

The Contract shall be listed for such Contract Months and scheduled for trading during such hours as may be determined by the Exchange.

2.2 Contract Value and Trading Unit
Each Contract shall be valued at two (2) U.S. Dollars multiplied by the Contract price. The trading unit shall be two (2) U.S. Dollars multiplied by the Contract price.

2.3 Minimum Fluctuations

Bids and offers shall be quoted in index points. The minimum fluctuation of the Contract
shall be one half (0.5) of an index point, equivalent to one (1) U.S. Dollar per Contract.

2.4 Position Limits

Unless otherwise approved by the Exchange and subject to Rule 4.1.18 of the Trading Rules, a Person shall not own or control Futures Contracts on the S&P CNX Nifty Index that exceed twenty five thousand (25,000) contracts net on the same side of the Market, and in all Contract Months combined.

2.5 Price Limits and Cooling Off Period

2.5.1 There shall be no trading in any Contract at a price above its Initial Upper Limit or
below its Initial Lower Limit except as provided for in this clause 2.5 and clause 2.6.
If the price for any Contract reaches either its Initial Upper Limit or Initial Lower Limit, the Exchange will signal a Cooling Off Period. After such Cooling Off Period, the respective Final Upper Limit and Final Lower Limit for each Contract shall come into effect.

2.5.2 If, after the Cooling Off Period signaled pursuant to clause 2.5.1, the price for any
such Contract reaches either its Final Upper Limit or Final Lower Limit, the Exchange will signal a further Cooling Off Period. After such Cooling Off Period, there will be no Price Limits for the remainder of the Trading Day.

2.6 Price Limits on Last Trading Day
Notwithstanding clause 2.5, there shall be no Price Limits on the Last Trading Day for an
expiring Contract.

2.7 Trigger for Price Limits

The Price Limits referred to in clause 2.5 shall be deemed to have been reached upon:

(a) the making of the first unsatisfied bid at the Initial Upper Limit or Final Upper Limit in part or in whole; or

(b) the first unsatisfied offer at the Initial Lower Limit or Final Lower Limit in part or in whole, as the case may be.

2.8 Termination of Trading

The Last Trading Day shall be the last Thursday of the Contract Month. If the Last Trading Day is not an Indian Business Day, the preceding day on which the underlying market is open for trading shall be the Last Trading Day.

If, at any time in the course of or after the close of trading on the day preceding what should in the normal course of business be the penultimate trading day (the “NPTD”) with respect to a Contract Month, or anytime thereafter, it comes to the knowledge of the Exchange that either of the two (2) days in that Contract Month which was expected in the ordinary course of business to have been respectively the last and penultimate Trading Day for that Contract Month will not in fact be an India Business Day, then the Last Trading Day shall be the next India Business Day that follows the NPTD.If, at any time in the course of or after the close of trading on the day preceding the NPTD, or anytime thereafter, it becomes known to the Exchange that both of the days erstwhile expected in the ordinary course of business to have been respectively the penultimate and the Last Trading Day would not be Indian Business Day(s) of the Contract Month, then the Last Trading Day shall be the next Indian Business Day following the NPTD.

3 CLEARING AND SETTLEMENT

Settlement under these Specifications shall be by cash settlement.

3.1. Final Settlement Price
The Final Settlement Price shall be the official closing price for the S&P CNX Nifty Index rounded to two decimal places on the Last Trading Day.

3.2 Alternative Resolution of Final Settlement Price

Notwithstanding clause 3.1, the Exchange and the Clearing House may, where the Final
Settlement Price prescribed in clause 3.1 is not available, resolve that the Final Settlement Price shall be determined by other means in accordance with Rule 4.1.20 of the Trading Rules. The decision of the Exchange and the Clearing House shall be binding upon all parties to the Contract.

3.3. Final Settlement

Clearing Members holding Open Positions in the Contract at the time of termination of trading in that Contract shall make payment to or receive payment from the Clearing House in accordance with normal variation margin procedures, based on a settlement price equal to the Final Settlement Price.

3.4 Other Rules and Procedures for Clearing and Settlement

The rules and procedures for clearing and settlement that are not specifically covered in these Specifications shall be governed by the Clearing Rules.2

2 The Clearing Rules refers to the SGX-DC Clearing Rules, which may be found on the Exchange’s website at

http://www.sgx.com.

4. REQUIREMENTS FOR TRADING

The Exchange has entered into a license agreement with the India Index Services & Products Limited (“IISL”) to be permitted to use certain stock indices to which the India Index Services & Products Limited owns rights in and to (the “IISL Indices”) and the proprietary data contained therein in connection with the listing, trading, marketing and clearing of derivative securities linked to such indices.

IISL assumes no liability or obligations in connection with the trading of any contract based on the IISL Indices. IISL and Standard & Poor’s, a division of the McGraw-Hill Companies Inc. (S&P) shall not be responsible for any losses, expenses or damages arising in connection with the trading of any contract linked to the IISL Indices, provided that nothing herein shall affect either party’s obligations as a party trading in
any contract linked to the IISL Indices. The Exchange, IISL and Standard & Poor’s do not guarantee the accuracy or completeness of any of the IISL Indices or any data included herein.

SGX Nifty – Options contract Specifications (Started in December 2011)

New Functionalities Features
A. Listed Options Strategies
• Vertical Spread
• Horizontal Spread
• Straddle
• Strangle
• 1:2 Ratio Spread

B. Tailor-Made Combinations (TMCs)
• Available for listing and trading
• RFQ supported

SGX Nifty – Options contract Specifications

Contract Size – US$2 x S&P CNX Nifty Index Price ≈ US$11,600
Contract Months – 2 nearest serial months and 12 nearest quarterly months on the Mar, Jun, Sep and Dec cycle.
Strike Prices – 100 index points (ATM strike +/- 12 strikes)
Minimum Price Fluctuation – 0.1 index points (US$0.20)
Trading Hours (Singapore Time) – T session: 9.00am – 6.15pm T+1 session: 7.15pm – 2.00am (next day)
Last Trading Day
– Last Thursday of the expiring contract month. If this falls on an Indian holiday, the Last Trading Day shall be the preceding business day.
Option Exercise – European style – In-the-money options will be exercised and cash settled automatically.
Trading Halt
– Save for trading on the Last Trading Day of an expiring Option Contract, trading in an Option Contract shall be halted during the Cooling Off Period of the SGX S&P CNX Nifty Index Futures.
Negotiated Large Trade (NLT)- Minimum 25 lots

This post originally appeared on the Algotradingindia Blog. Lokesh Madan is a strategy business consultant for various high frequency trading companies worldwide with more than 12 years of experience in financial technology, research work and business development.

Lokesh Madan

Skype – lokesh.madan3

Related Readings and Observations

The post Start Trading on SGX Nifty from India – Complete Details. appeared first on Marketcalls.
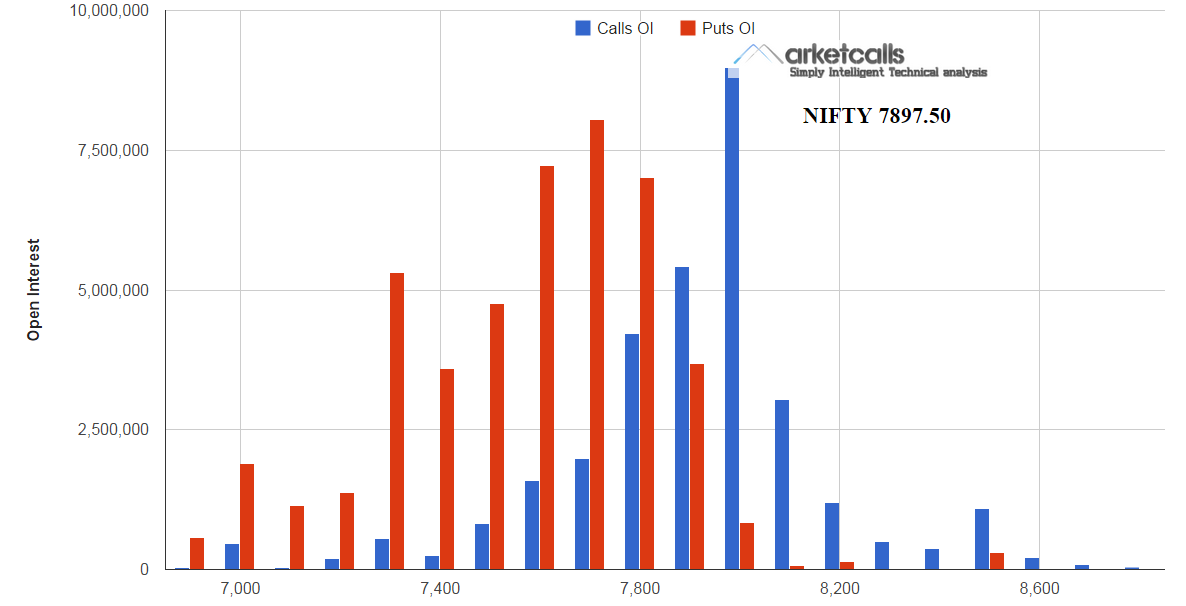

Understanding Financial Regulatory Bodies in India

$
0
0

In India, the financial system is regulated with the help of independent regulators, associated with the field of insurance, banking, commodity market, and capital market and also the field of pension funds. On the other hand, the Indian Government is also known for playing a significant role in controlling the field of financial security and also influencing the roles of such mentioned regulators. You must be aware of the regulatory bodies and their functions, before a final say. The most prominent of all is RBI or Reserve Bank of India. Let us look in detail about various Financial Regulatory Bodies in India.

RBI – Reserve Banks of India :

Reserve Bank of India : Reserve Bank of India is the apex monetary Institution of India. It is also called as the central bank of the country.

RBI logoThe Reserve Bank of India was established on April 1, 1935 in accordance with the provisions of the Reserve Bank of India Act, 1934. The Central Office of the Reserve Bank was initially established in Calcutta but was permanently moved to Mumbai in 1937. The Central Office is where the Governor sits and where policies are formulated. Though originally privately owned, since nationalization in 1949, the Reserve Bank is fully owned by the Government of India.

The Central Office is where the Governor sits and is where policies are formulated. Though originally privately owned, since nationalization in 1949, the Reserve Bank is fully owned by the Government of India.

SEBI – Securities and Exchange Board of India :

SEBI logoApart from RBI, SEBI also forms a major part under the financial body of India. This is a regulator associated with the security markets in Indian Territory. Established in the year 1988, the SEBI Act came into power in the year 1992, 12th April. The board comprises of a Chairman, Whole time members, Joint secretary, member appointed, Deputy Governor of RBI, secretary of corporate affair ministry and also part time member. There are three groups, which fall under this category, and those are the investors, the security issuers and market intermediaries.

PFRDA – Pension Fund Regulatory and Development Authority :

PFRDA LogoPension Fund regulatory is a pension related authority, which was established in the year 2003 by the Indian Government. It is authorized by the Finance Ministry, and it helps in promoting income security of old age by regulating and also developing pension funds. On the other hand, this group can also help in protecting the interest rate of the subscribers, associated with the schemes of pension money along with the related matters. PFRDA is also responsible for the appointment of different other intermediate agencies like Pension fund managers, CRA, NPS Trustee Bank and more.

FMC – Forward Markets Commission :

FMC logoOther than the financial bodies mentioned above, FMC also plays a major role. It is the chief regulator of the commodity(MCX, NCDEX, NMCE, UCX etc) of the Indian futures market. As per the latest news feed, it has regulated the amount of Rs. 17 trillion, under the commodity trades. Headquarter is located in Mumbai, and the financial regulatory agency is working in collaboration with the Finance Ministry. The chairman of FMC works together with the Members of the same organization to meet the required ends. The main aim of this body is to advise the Central Government on matters of the Forwards Contracts Act, 1952.

IRDA – Insurance Regulatory and Development Authority :

IRDA LogoLastly, it is better to mention the name of IRDA or insurance regulatory and Development authority, as a major part of the financial body. This company is going to regulate the apex statutory body, which will regulate and at the same time, develop the insurance industry. It comprised of the Indian Parliamentary act and was passed duly by the Indian Government. Headquarter of this group is in Hyderabad, and it was shifted from Delhi to Hyderabad. These are some of the best-possible points, which you can try and focus at, while dealing with financial bodies of India.

Related Readings and Observations

The post Understanding Financial Regulatory Bodies in India appeared first on Marketcalls.
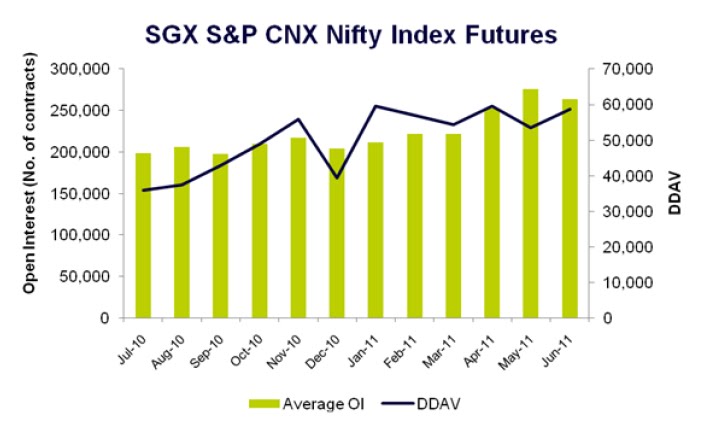
MCX Gold – Time to Rise – Technical Analysis

$
0
0

Gold (20.08.2014) traded higher as per our last article & went to $1320 mark. However a sharp fall was witnessed from there specially on mcx with combination of INR.

Dear reader , on a demand posting an article about MCX Gold this time. Generally we don’t do that because of violate behavior of gold on mcx with some common excuses like INR, import duty , contract expiry, low volume etc. Today we were watching MCX charts & very surprised that irrespective to COMEX spot Gold, Mcx gold adjust its level to complete the chart patterns. When we wrote our last article on gold , we were bullish & gold really made 1st level $1320 but at the same we were not expecting it to move almost 1000 point on MCX but it made it & now it fall almost 1000 point too.

Visit here for Live MCX Gold Charts

Both the cases INR played an important role, moved up & moved down, all fine it can happen. But when we look at the dollar index, EURUSD , USDCAD, USDCHF, USDJPY etc the story is totally different. So how it is happening with INR ??

Anyways , MCX gold now trading at 28225 & as we can see on charts , gold fall back to support zone once again. We also witness a gap due to contact expiry. This area represent the 61.8% feb. ret. level as well as many parallel support are there. Candlestick formation is not complete till now but the range bound trading suggest for the same. Indicators neutral.

MGLDH4

Based on above studies, it is possible for gold to move higher to the predicted levels around 28502-28715 & 29080 in coming trading session. A day close below 28080 will force us to reanalyze the charts.

Note – Above view is based on technical studies & do not represent our buy-sell recommendation.For recommendations Contact Us

Related Readings and Observations

The post MCX Gold – Time to Rise – Technical Analysis appeared first on Marketcalls.
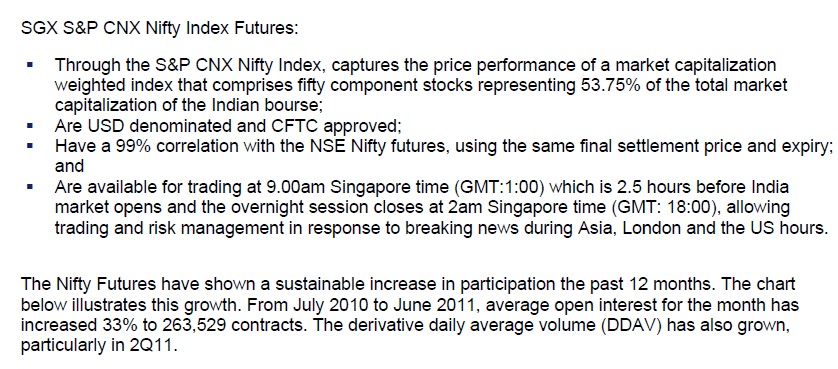
How Not To End Your Trading Career Untimely.

$
0
0

Sword War

Detecting high level of pain component in trades above your threshold mental torture appetite or tolerance level is crucial to save your trading career as a beginner.

MONTY’S BUTTERFLIES AND RAIN BOW.

Nineteen-year-old Monty spent the afternoon day-trading penny stocks because his prefrontal cortex isn’t yet fully developed and he couldn’t recognize risk-reward trade-offs if they hit him in the face. This introduces to dangers and demands of trading on your finances and personal health ,spirit and well-being which most traders are not even aware. Most of us are myopic and can not see the uglier side. We self destruct due to our inability to look beyond the bait dangling in front of our eyes.But Risk aversion is not good either.

“Men see the bait, not the hook” – Confucius

RISK AND REWARD ARE RELATED

Although you may be tired of hearing that investment rewards can be increased only by assumption of greater risk,no lesson is more important than investment management.This fundamental law of finance is supported by centuries of historical data.The risk of investing in common stocks and bonds depends on length of time the investments are held.the longer the investors holding period ,the lower the risk.But retunes some times comes only at substantial risk to investors.Total returns could be negative for three years or more.Higher risk is the price one pays for more generous returns.

We would like to double our capital overnight,but how many of us can afford to see half of capital vanish just as quickly? JP MORGAN once had a friend who was so worried about his stock holdings that he could not sleep in night.The friend asked “what should I do about my stocks?” Morgan replied “ sell down to sleeping point” He was not kidding.Every investor must decide the trade off he is willing to make between eating well and sleeping well.The decision is upto you. High investment rewards are always coupled with substantial risk taking.So what is your sleeping point? That is your risk appetite.Finding answer to this question is one of the important investment steps you must take.Sleeping scale can raise your consciousness of risk reward trade off of investment or helps you to quickly recognize sleepless investments or trades.

Risk tolerance is essential aspect of any financial plan and only can evaluate your attitude towards risk.But key to investment to work for you is whether you are able to sleep at night. How did you feel when market dropped 2000 points in January 2008? If you panicked and became physically ill because a large proportion of your assets were invested in stocks ,then clearly you should pare down your portfolio.

MEASURING RISK – THE COST OF BAILOUT

Standard deviation or variance risk due to volatility.Once you measure it you find out if it is within your appetite and within the emotional threshold level.Every price level has reward and embedded with risk.Excess focus on reward and neglecting risk due to bias or greed then the trade off would blow right on your face as you don’t take cautions like smaller positions or further confirmation or tighter stop losses or alternative low volatile trades.(like working with heater treater).Our tendency to get rich quickly leads to this desperation and finally you just bail out yourself by paying heavily .

Small caps and momentum stocks are always attractive to trade due to high beta during rally.But they tend to fall more during market decline so the cost of bail out is also high.Consciousness of this trade off protects you from heavy future payments and sleeplessness.

PSYCHOLOGY OF RISK

Risk is not only like a bill or bail out payment to broker but a painful trouble or personal crisis.Risk is about something which is injurious or toxic and has trade off with reward.Risk reward trade off if calculated in advance ,it becomes bearable if and when it happens.If neglected in overconfidence , trade-off blows in your face and becomes unbearable as you lose more money in a state of shock.You have to endure pain and mental torture.Ignoring risk leads to ignoring protection.Your Risk is the extent of lack of protection for money invested.(like just giving someone money in unsecured transaction) just for lust of expected reward.When rewards are high ,there is no protection or safety for your money.Trade offs are high there and sleepless types.

On the other hand in large cap or blue chip companies risk -reward trade off is low with high returns unlike small caps with high returns with higher trade offs.Good will for Company management and their consistent performance provides your money protection

REWARDS AS INCOME

In addition to our labor income we need investment income to supplement and improve our standard of living.Income and money can provide us present and future welfare and luxury or pleasures to rich traders.With money and income you eat well and sleep well and have to work less as any investment advisor tells you.

RISK AS SLEEPLESSNESS WHEN BAD THINGS HAPPEN

Trading Benchmarks

Portfolios sometimes easily lose half of their value in bad market year. Any loss of capital and income will immediately affect your standard of living..If you have no problem sleeping during bear markets and if you have staying power to stick with your investments , your risk appetite is just perfect.Lack of protection for capital and income during down phase of market causes unhappiness fear ,panic despondency and mental torture.Risk is injury or toxicity and is physical thing as much as neither eating nor sleeping well.

INDUSTRIAL Vs FINANCIAL RISK

In industry Risk is referred to as situations in which accidents or fatalities could occur causing physical injury to person.Bursting of vessel ,toxic gas leaks or acid spray are causes of industrial accidents and are called risks.Does the risk imply accidents in financial world ?Yes they are.As it happens in accidents and affected people ,all elements of danger such as fear ,panic, pain ,personal crisis ,shocks despondency and grief even fatalities prevails in financial market when bad things happen.People are driven tobrink of suicides and financial ruin during crisis due to lack of consciousness of risk aspects and impacts.

On lighter side to raise the conscious level of tradeoff ,one has to ask himself ,does he have to go to doctor ever for investing now?Are you ever going to be sick and unwell after losing money?So now you decide how much money you can lose without being unwell and sick before you invest. Tha is your appetite.This is for popular awareness of trade offs involved.Trade offs could be in the form of fever , weakness ,depression ,vomiting ,headache and sleeplessness-all for just investing .

UNDERSTANDING TRADE OFFS

Look at coal mining industry.Reward or compensation is certainly high.But trade off between risk and reward is equally high.Not every body can work thousand feet below ground.Many are going to be sick and many fatalities are reported every year.No body stick to the job for long.Many tend to bailout due to unbearable trade off involved.In trading too ,if trade off is unbearable ,one can not stick to it for long and has to bail out.Not every body can manage his standard of living in bear market for three years.

When trade off exceeds the emotional or physical endurance level,you can not tolerate payment demands and stick to trade.It becomes task and trouble..So your expectation of doubling money is shattered by the tsunami of the reality of having to bear pain of having no protection your money which you failed to realize at the outset.You can be easily made to pay out of fear and run away.There is only fine distinction between physical and emotional pain and they are interchangeable.More cash in market place is always risky for your health.Know the rules of free market and take cautions against possible physical attacks.Trade not when expected reward is high but if pain is going to be bearable.Remember you could be asked to give money to market and you should be able to bear it.

TO SURVIVE INSPITE OF EMOTIONS AND STATE OF YOUR HEART

Your reactions are born in your heart and changes within split seconds and that you neither know or control.Your excitement and pleasure to change your dream of getting rich quickly now could be replaced by fear and mental torture just next moment and your decision could turn contradictory.Something you like now but you may hate next moment.So if you don’t plan at the outset as per your threshold ,you are going to end your trading carrier untimely- a sad end.

Spending and losing money is painful and torture.Your heart is filled with hate and fear.In fear you tend to over think and can not relax and can not sleep. If Fear is unbearable ,you either become passive or quit and run.Ruin is writing on the wall.

MARKET NOT FOR DUMMIES AND ROOKIES

People having no power of resistance or knowledge,the common less sophisticated investors who tend to invest out of thrill and excitement of getting rich quickly at the top of rally ,risk is imaginary fear of weak hearted people who are not progressive.Only the realization and consciousness of fear can temper down the excitement and thrill and resultant discretionary trading based on emotions and gut feeling which ends in sad ending.Creative negative thinking like anticipating adverse news such as negative eco data or political tensions ,fear and consequent rationality to seek some kind of protection for money can be brought to bear into consciousness and replaces the madness of getting rich quickly with big trades.Your greed ,bias and excitement is now mixed and mitigated with caution and puts a brake on your discretion.

LOSS AND YOUR PSYCHOLOGY

Reactions emanate from heart which get filled with discontent ,frustration and dissatisfaction having to bear loss.Happiness and contentment can only return if and when losses are recouped.You hang on to your losses and your ego ,or you go all in to make up and your capital disappears and your broke.Remember gambler fallacy and don’t fall for it.Consequent fear destroys happiness.When you remain strong in the face of fear for long, you get disease ,anxiety ,depression and mental disorders.

Losing money is not a music or a romantic film which you can forget easily.Bad things are not forgotten easily.They are like horror movies that makes you ride the roller coaster of painfully emotional trip.In stock market,romantic and horror films alternate very quickly or run parallel like in multiplexes.So know what to expect as thing could blow up right on your face.Dont be tricked by what you see now or what you feel.

BUSINESS PESPECTIVE GROUNDS YOU

Prospect of bearing risk reward trade off best realized with business analogy with deterministic outcomes with trading where outcome is deterministic.You as a contractor have to pay penalty for delaying completing work or failing to deliver goods in time.Risk is known and calculated and expected bearing of pain is in front of you.So you take cautions to make a deal that does not hurt you if bad things happen.Those losses you can easily absorb and take in your stride.

Bad things happen in stocks and you have to make an imaginary deal which does not hurt you if trade goes against you.

1.think trading and investing as business

2.Expect bad things happening which is called Risk

3.Expect consequent mental torture and lack of relaxation

4.Can you bear that ?

This is how one should analyze trade off or demand of trading a position.Make informed choice not impulsive one.

TROUBLES

In troubles like having to pay is fearful.Your capital and income are lost and it impacts your standard of living in addition to ego torture.You can not relax and rest peacefully and have to live in fear or get nightmares or even get insomnia too.If you chose to hang on to losses you have watch it continuously without rest.I remember the experience of fear when lost to volatility due to a stray Korean missile.Missile landed no where except on my head.No kidding.Hanging on to losses gives you no time and freedom to do anything with your money on call- a real trouble.you may have to go to doctor and take some medicine only after your wife advises you to do so.I measure trade off with pain killers associated with a trade.Life can not be smooth ,easy and relaxed until the trouble is over or trade is closed.So much for discretionary trading.

Yes when looking into trade off to bear, you uncover imaginative bad things in your mind and balance it with your psychological make up based on past experiences and decide if you can bear it or be comfortable.by how much suck and fear without losing sleep.

LOSSES AND YOUR EFFICIENCY

Psychological implications of bad emotions such as fear ,panic and troubles varies from person to person.Some people may break down with small losses.They can not relax as their trade off index is low.Bad emotions if exceed your threshold affects your health energy and efficiency and makes you wooly headed.

BAIL OUT RANSOM IN TRADING LIFE AND GLADIATORS’ FATE

Trading life is going to be cut short pathetically if you don’t keep your EMI under control and it becomes like your mortgage being lost or you have to sell the house immediately. EMI and trade off are no different.If interest rate rises ,your EMI looks scary and unbearable.Dont trade like gladiators .Trading carrier comes to an abrupt end as it happens to life of one of gladiators and they know this.Avoid gladiator syndrome to survive in the game.Your trading life is extinguished when assumed trade off is beyond your breaking point.

Expect rewards but expect Risk too.Can you take the trouble? Know your risk appetite depending on how much fear you can handle not how much money in your account.Beyond your risk appetite ,you will break down ,hence limited resource.Back calculate the expected reward from your risk appetite and decide position size.

This is like pressure vessel which has a designed pressure and safety valve,If more gas is supplied into vessel ,safety valve pops or vessel bursts.So you have to determine this critical value of risk appetite Once this is ascertained ,you can estimate how much to invest into portfolio ,mutual fund or into a trade easily.and you can cut losses easily and run or you have to hang on only to quit when all capital is wiped out and you can not bear pain to stick.Sell or close till the sleeping point or wait to be unwell.

There is pressure of rewards and pressure of risk.The pressure of rewards is to controlled in balance with tolerable loss bearing pressure.Your safe pressure of bail out ransom is constant and could be set lower than your overconfidence.

FEAR – A LESS SOPHISTICATED VIEW

Fear is a bad condition you have to worry about constantly and mind is subjected to overthinking with no relaxation like preparing for tests , exams or clients meet.It is terrible state and panic is fast torture of your body and mind..Solution is not risk aversion but trade off estimation.Position sizing ,tight stop losses , choosing comfortably volatile stocks ,cutting losses ,avoiding discretionary trades ,not being tricked ,or not playing with gambler fallacy can be palatable to your risk appetite.

Not kidding really.


Related Readings and Observations

The post How Not To End Your Trading Career Untimely. appeared first on Marketcalls.

Indepth Study On Exit Strategies For Traders By Lokesh Madan

$
0
0

Trade Exit strategies are more complex in nature as compared to Trade In Strategies. It involves different types of analysis i.e Technical Based, Fundamental based& Quantitative based. In this article we are not focusing on the timing of trade entries but to the major problem trader’s faces: how to get out of a trade once in Exit Strategies.

exit-strategy

WHY TO STUDY: EXIT STRATEGIES

In many ways, a good exit is more critical and difficult to achieve than a good entry.

The big difference is that while waiting for a good opportunity to enter a trade, there is no market risk. If one opportunity to enter is missed, another will always come along-and a good, active trading model should provide many such opportunities.

When a trade is entered, however, exposure to market risk occurs simultaneously.

Failing to exit at an appropriate moment can cost dearly and even lead to the dreaded margin call! We actually know someone who made a quick, small fortune trading, only to lose it all (and then some) because the exit strategy failed to include a good money management stop! To get out of a trade that has gone bad, it is not a good idea to simply wait for the next entry opportunity to come along.

A good exit strategy must, above all, strictly control losses (Stop Losses), but it must not sacrifice too many potentially profitable trades in the process; i.e., it should allow Profitable trades to fully mature.

How important is the exit strategy?

If risk can be tightly controlled by quickly bailing from losing trades, and done in such a way that most winning trades am not killed or cut short, it is possible to turn a losing system into a profitable one!

It has been said that if losses are cut short, profits will come. A solid exit strategy can, make a profitable system even more lucrative, while reducing equity volatility and drawdown. Most importantly, during those inevitable bad periods, a good exit strategy that incorporates solid money management and capital preservation techniques can increase the probability that the trader will still be around for the next potentially profitable trade.

FEATURES A GOOD EXIT STRATEGY MUST HAVE.

There are two major goals that a good exit strategy attempts to achieve.

1) The first and most important goal is to strictly control losses. The exit strategy must dictate how and when to get out of a trade that has gone wrong so that a significant erosion of trading capital can be prevented. This goal is often referred to as money management and is frequently implemented using stop-loss orders (money management stops).

2) The second goal of a good exit strategy is to ride a profitable trade to full maturity. The exit strategy should determine not only when to get out with a loss, but also when and where to get out with a profit. It is generally not desirable to exit a trade prematurely, taking only a small profit out of the market. If a trade is going favorably, it should be ridden as long as possible and for as much profit as reasonably possible. This is especially important if the system does not allow multiple re-entries into persistent trends. “The trend is your friend,” and if a strong trend to can be ridden to maturity, the substantial profits that will result can more than compensate for many small losses. The profit-taking exit is often implemented with trailing stops. profit targets, and time- or volatility-triggered market orders. A complete exit strategy makes coordinated use of a variety of exit types to achieve the goals of effective money management and profit taking.

TYPES OF EXIT STRATEGIES

There are a wide variety of exit strategies to choose from when developing an exit strategy. In the standard exit strategy, only three kinds of exits were used in a simple, constant manner.

A fixed money management exit was implemented using a stop order: If the market moved against the trade more than a specified amount. The position would be stopped out with a limited loss. A PNL target exit was implemented using a limit order: As soon as the market moved a specified amount in favor of the trade, the limit would be hit and an exit would occur with a known profit.

The Time-Based exit was such that, regardless of whether the trade was profitable, if it lasted more than a specified number of bars or days, it was closed out with an at-the-market order. There are a number of other exit types not used in the standard exit strategy: trailing exits, critical threshold exits, volatility exits, and signal exits.

A trailing exit, usually implemented with a stop order and, therefore, often called a trailing “top, may be employed when the market is moving in favor of the trade. This stop is moved up, or down, along with the market to lock in some of the paper profits in the event that the market changes direction. If the market turns against the trade, the trailing stop is hit and the trade is closed out with a proportion of the profit intact.

A critical threshold exit terminates the trade when the market approaches or crosses a theoretical barrier (e.g., a trendline, a support or resistance level, a Fibonacci retracement, or a Gann line), beyond which a change in the interpretation of current market action is required. Critical threshold exits may be implemented using stop or limit orders depending on whether the trade is long or short and whether current prices are above or below the barrier level.

If market volatility or risk suddenly increases (e.g., as in the case of a “blow-off top), it may be wise to close out a position on a volatility exit. Finally, a signal exit is simply based on an expected reversal of market direction: If a long position is closed out because a system now gives a signal to go short, or because an indicator suggests a turning point is imminent, a signal exit has been taken.

Many exits based on pattern recognition are signal exits.

Money Management Exits

Every exit strategy must include a money management exit. A money management exit is generally implemented using a stop order. Therefore, it is often referred to as a money management stop. Such a stop closes out a trade at a specified amount of adverse excursion (movement against the trade), or at a specified price below (if long) or above (if short) the price at which the trade was entered. A money management stop generally stays in place for the duration of the trade. Its purpose is to control the maximum risk considered tolerable. Of course, the potential risk may be greater than what was expected.

The market could go limit up (or down) or have a large overnight gap. Trading without a money management stop is like flying in a rickety old plane without a parachute, The issue is not whether a money management stop should be used. Rather, it is determining the optimal placement of the stop. There are many ways to decide where to place money management stops, The simplest placement occurs by assessing the maximum amount of money that can be risked on a given trade. For example, if a trade on the NIFTY 50 is entered and the trader is not be willing to risk more than one Lakhs, a money management stop that uses a one lakhs stop-loss order would be specified. If the market moves against the trade more than one lakhs, the stop gets hit and the position is closed out. Another way to set the money management stop is on the basis of volatility. In volatile markets and periods, it may be a good idea to give trades more room to breathe, i.e., to avoid having the stop so close to the market that potentially profitable trades get stopped out with losses.

A good way to set a money management stop is on the basis, of a price barrier, such as a trendline or support/resistance level. In such cases, the stop also serves as a critical threshold exit. For example, if there are a number of trend and support lines around 7800.00 on the Nifty 50, and a long position at 7900 has just been entered, it might be worth considering the placement of a stop a little below 7900 i.e at 7880. Setting a protective stop at 7880 is logical since a break through support suggests that the trend has changed and that it is no longer smart to be long the Nifty 50. In this example, risk is substantially less than the one lakhs risked when using the money management stop that was based on a Rupees amount. A tighter stop can often be set using a barrier or critical price model than would be the case using a simple Rupees amount model.

As hinted above, setting a money management stop involves a compromise. It is good to have a very tight stop, since losing trades then involve only tiny, relatively painless losses. However, as the stop is tightened (i.e., moved closer to the entry or current price), the likelihood of it getting triggered increases, even if the market eventually moves in favor of the trade. For example, if a 5000 Rs/- stop loss is set, almost all trades on the Nifty 50, regardless of entry method, will be stopped out with small losses. As a stop gets tighter, the percentage of winning trades will decrease. The stop eventually ends up sacrificing most of what would have been profitable trades. On the other hand, if the stop is too loose, although the winning trades are retained, the adverse excursion on those winners, and the losses on the losing trades, will quickly become intolerable. The secret is to find a stop that effectively controls losses with out sacrificing too many of the trades that provide profits.

Trailing Exits

A trailing exit is usually implemented with a so-called trailing stop. The purpose behind this kind of exit is to lock in some of the profits, or to provide protection with a stop that is tighter than the original money management stop, once the market begins to move in the trade’s favor. If a long position in the NIFTY 50 is taken and a paper profit ensues, would it not be desirable to preserve some of that profit in case the market reverses? This is when a trailing stop comes in useful. If a one lakhs money management stop is in place and the market moves more than one lakhs against the trade, the position is closed with a one lakhs loss. However, if the market moves 75K in the trade’s favor, it might be wise to move the old money management stop closer to the market’s current price, perhaps to 30K above the current market price. Now, if the market reverses and the stop gets hit, the trade will be closed out with a 30K profit, rather than a one lakhs loss! As the market moves further in favor of the trade, the trailing stop can be moved up (or down, if in a short position), which is why it is called a trailing stop, i.e., it is racheted up (or down), trailing the market-locking in more of the increasing paper profit.

Once it is in place, a good trailing stop can serve both as an adaptive money management exit and as a profit-taking exit, all in one! As an overall exit strategy, it is not bad by any means. Trailing stops and money management stops work hand in hand. Good traders often use both, starting with a money management stop, and then moving that stop along with the market once profits develop, converting it to a trailing stop. Do not be concerned about driving the broker crazy by frequently moving stops around to make them trail the market. If trading is frequent enough to keep commissions coming in, the broker should not care very much about a few adjustments to stop orders. In fact, a smart broker will be pleased, realizing that his or her client is much more likely to survive as an active, commission-producing trader, if money management and trailing stop exits are used effectively.

How is the placement of a trailing stop determined? Many of the same principles discussed with regard to money management exits and stops also apply to trailing exits and stops. The stop can be set to trail, by a fixed rupees amount, the highest (or lowest, if short) market price achieved during the trade. The stop can be based on a volatility-scaled deviation. A moving threshold or barrier, such as a trend or Gann line, can be used if there is one present in a region close enough to the current market action. Fixed barriers, like support/resistance levels, can also be used: The stop would be jumped from barrier to harrier as the market moves in the trade’s favor, always keeping the stop comfortably trailing the market action.

Profit Target Exits

A profit target exit is usually implemented with a limit order placed to close out a position when the market has moved a specified amount in favor of the trade. A limit order that implements a profit target exit can either be fixed, like a money management stop, or be moved around as a trade progresses, as with a trailing stop. A fixed profit target can be based on either volatility or a simple rupees amount. For example, if a profit target of 30K is set on a long trade on the NIFTY 50, a sell-at-limit order has been placed: If the market moves 30K in the trade’s favor, the position is immediately closed. In this way, a quick profit may be had.

There are advantages and disadvantages to using a profit target exit. One advantage is that, with profit target exits, a high percentage of winning trades can be achieved while slippage is eliminated, or even made to work in the trader’s favor. The main drawback of a profit target exit is that it can cause the trader to prematurely exit from large, sustained moves, with only small profits, especially if the entry methods do not provide for multiple reentries into ongoing trends. All things being equal, the closer the profit target is to the entry price, the greater the chances are of it getting hit and, consequently, the higher the percentage of winning trades. However, the closer the profit target, the smaller the per-trade profit.

For instance, if a 3K profit target is set on a trade in the NIFTY 50 and the money management stop is kept far out (e.g., at 5 lakhs), more than 95% of the trades will be winners! Under such circumstances, however, the wins will yield small profits that Will certainly be wiped out, along with a chunk of principal, by the rare 5 lakhs loss, as well as by the commissions. On the other hand, if the profit target is very wide, it will only occasionally be triggered, but when it does get hit, the profits will be substantial. As with exits that employ stops, there is a compromise to be made: The profit target must be placed close enough so that there can be benefit from an increased percentage of winning trades and a reduction in slippage, but it should not be so close that the per-trade profit becomes unreasonably small. An exit strategy does not necessarily need to include a profit target exit. Some of the other strategies, like a trailing stop, can also serve to terminate trades profitably.

They have the added benefit that if a significant trend develops, it can be ridden to maturity for a very substantial return on investment. Under the same conditions, but using a profit target exit, the trade would probably be closed out a long time before the trend matures and, consequently, without capturing the bulk of the profit inherent in the move.

Personally, we prefer systems that have a high percentage of winning trades.

Profit targets can increase the percentage of wins. If a model that is able to reenter active trends is used, profit target exits may be effective. The advantages and disadvantages really depend on the nature of the system being trading, as well as on personal factors.

One kind of profit target we have experimented with, designed to close out dead, languishing trades that fail to trigger other types of exits, might be called a shrinking target. A profit target that is very far away from the market is set.

Initially, it is unlikely to be triggered, but it is constantly moved closer and closer to where the market is at any point in the trade. As the trade matures, despite the fact that it is not going anywhere, it may be possible to exit with a small profit when the profit target comes into a region where the market has enough volatility to hit it, resulting in an exit at a good price and without slippage.

Interest Based Exits

I saw some Portfolio management companies work strictly on system they design they generally use two Exit policy.. First for Stop Loss & second for profit taking.. Most commonly 10% portfolio drawdown in any sector is Stop loss & profit taking depends on what interest rate they want to book what they calculated means depend upon the risk they take & analysis they make it can be 25% to 100% on any sector.

Time-Based Exits

Time-based exits involve getting out of the market on a market order after having held a trade for a fixed period of time. The assumption is that if the market has not, in the specified period of time, moved sufficiently to trigger a profit target or some other kind of exit, then the trade is probably dead and just tying up margin. Since the reason for having entered the trade in the first place may no longer be relevant, the trade should be closed out and the next opportunity pursued.

Volatility Exits

A volatility exit depends on recognizing that the level of risk is increasing due to rapidly rising market volatility, actual or potential. Under such circumstances, it is prudent to close out positions and, in so doing, limit exposure. For instance, when volatility suddenly expands on high volume after a sustained trend, a “blow-off top might be developing. Why not sell off long positions into the buying frenzy?

Not only may a sudden retracement be avoided, but the fills are likely to be very good, with slippage working with, rather than against, the trader! Another volatility exit point could be a date that suggests a high degree of risk, e.g., anniversaries of major market crashes: If long positions are exited and the market trends up instead, it is still possible to jump back in. However, if a deep downturn does occur, the long position can be reentered at a much better price!

What else constitutes a point of increased risk? If an indicator suggests that a trend is about to reverse, it may be wise to exit and avoid the potential reversal.

If a breakout system causes a long entry into the NIFTY 50 to occur several days before the full moon, but lunar studies have shown that the market often drops when the moon is full and the trade is still being held, then it might be a good idea to close the position, thus avoiding potential volatility. Also remember, positions need not be exited all at once. Just a proportion of a multi contract position can be closed out, a strategy that is likely to help smooth out a trader’s equity curve.

Barrier Exits

 A barrier exit is taken when the market touches or penetrates some barrier, such as a point of support or resistance, a trendline, or a Fibonacci retracement level. Barrier exits are the best exits: They represent theoretical barriers beyond which interpretation of market action must be revised, and they often allow very close stops to be set, thereby dramatically reducing losses on trades that go wrong. The trick is to find a good barrier in approximately the right place. For example, a money management stop can serve as a barrier exit when it is placed at a strong support or resistance level, if such a level exists close enough to the entry price to keep potential loss within an acceptable level. The trailing exit also can be a barrier exit if it is based on a trend line.

Signal Exits

Signal exits occur when a system gives a signal (or indication) that is contrary to a currently held position and the position is closed for that reason. The system generating the signal need not be the same one that produced the signal that initiated the trade. In fact, the system does not have to be as reliable as the one used for trade entry! Entries should be conservative. Only the best opportunities should be selected, even if that means missing many potential entry points, Exits, on the other hand, can be liberal. It is important to avoid missing any reversal, even at the expense of a higher rate of false alarms. A missed entry is just one missed opportunity out of many. A missed exit, however, could easily lead to a downsized account! Exits based on pattern recognition, moving average crossovers, and divergences are signal exits.


For more Details

http://algotradingindia.blogspot.in/2014/08/indepth-study-on-exits-strategies-for.html


Lokesh Madan

http://algotradingindia.blogspot.in/

Related Readings and Observations

The post Indepth Study On Exit Strategies For Traders By Lokesh Madan appeared first on Marketcalls.

Layman’s Guide To The World Of Insider Trading

$
0
0

In the world of investment, the term of insider trading has created quite a buzz. It is a word that can be commonly heard from the investors. Well, this is such a term which means selling of the stock of a company with which the individual is associated. The transaction can be conducted by the officers, employees and the directors that are associated with the company in question. Now, in this respect it is needed to be mentioned that when the trading is done through the means of their personal securities of the people, then that needs to be reported to the SEBI. It is necessary for you to understand all the aspects related with this process, to avoid stepping in the illegal side of this process.

SEBI Insider Trading Definition

A look at the illegal side

Knowing about the situation when the insider trading is considered to be illegal will help you in bracing yourself from unwanted hassles. When the insider trading breaches the fiduciary duty or the relationship of trust, then it is considered to be illegal. Also, the same is considered in terms of breaking of the confidence during the trading while the personal have the procession of the material related with trading. The possession of information which is nonpublic about the process is also considered to be illegal. The other kind of violation of law includes the aspect of ‘tipping’ of such information. Moreover, it also can be a person dealing with the trading process.

Who is an insider?

The personnel who is working in the company or is associated in the company can get the labeled of being an insider. However, they need to have access to such information which can have an influence in the decision making process of the investors. Also, the information that can influence the price of the stock and persons having that information will be considered as an insider. Besides that, the personnel who have information access in a temporary form are also considered to be an insider for the company. The determination of the insider is done in accordance with the parameter published from SEBI.

The implications of violation of insider trading

There are different situations in which an individual or group of individuals can be considered liable for the breaching of law regarding the aspect of insider trading. There have been numerous cases in the recent time. The cases against the officers and directors of an organization were made for trading of the securities after having a detailed knowledge about the confidential corporate developments. Also, those individuals were accused who already had access to the information from the ‘tippers’, or the associates of someone that have the confidential information about the trading. The government employees having access to the valuable information has also been considered to be a faulty party in many of the cases. In simple words, the person who has information about the trading which is not known to the public cannot act as a participating party.

Insider Trading Recent Case Study

Very recently junior and midlevel employees of some of India’s top corporates such as Wipro, ITC and M&M were flummoxed when they were pulled up by the market regulator SEBI.

Sebi imposed a fine of Rs 2 lakh on a general manager of Mahindra & Mahindra for selling 644 shares of M&M during the silent period — the ‘no transaction period’ that precedes events such as quarterly results and annual general meetings. In another order, an HR manager at ITC was fined Rs 5 lakh for not disclosing the sale of 10,000 ITC shares to exchanges within the stipulated time. An official of Wipro was told to cough up Rs 5 lakh for selling 8,000 Wipro shares in violation of Insider Trading Regulations. (The employees concerned are not being named as the violation is technical in nature). – Economic Times

The consequences

The result of getting involved in the violation of the law regarding the insider trading can result in both civil, as well as, criminal charges. This is a lucrative option as long as it is conducted under the perimeter of law.

Related Readings and Observations

The post Layman’s Guide To The World Of Insider Trading appeared first on Marketcalls.

Viewing all 2070 articles
Browse latest View live