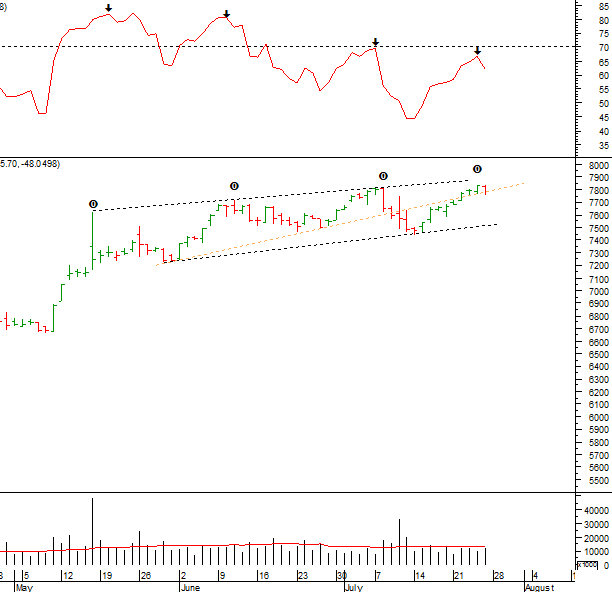
Technical Update: Symmetrical Triangle breakout from a trading range in Petronet LNG daily chart. Price: Petronet closed strong day on day bullish, with an outside bar bullish reversal candle on weekly charts. The stock is in strong momentum month on month and is be up 6 continuous months this year. RSI: 14 day daily RSI is @ 63. From chart above one can clearly see how since beginning of the trend marked with circles the RSI has been making higher highs and RSI has not break below the levels since trend began. It has been bouncing from range of 50 Indicating buyer’s coming at every dips for the stock and trend is strong up. Trend: Short term sideways with upside bias, medium term, primary trend are up with strong support at 170 Levels. Volume: The volume expansion is clearly seen on rallies where as corrections has shallow volume.
Image may be NSFW. Clik here to view.
Weekly Chart Petronet LNG
Technical Update: Above is the weekly chart of Petronet LNG the price has faced strong resistance at 175-180 in past. The stock has faced selling pressure from these levels in past four occasions. On positive side the price has managed to close strong bullish candle on weekly close in previous week indicating bulls in charge still for the uptrend.
Image may be NSFW. Clik here to view.
Petronet LNG Monthly Chart
Technical Update: The price after making the breakout on monthly chart previous month has been able to hold on the higher levels. The formation targets for monthly breakout is around 220-230 Rs Trading Strategy: Short term trader’s Buy Petronet LNG cash in dips to 183 -177 stop loss 168 Targets 220-230, For Investor Point of view the stock could be accumulated in any good correction till 155 stop loss of 120 targets 300
Taxpayers that are filing their income tax returns will have to follow few extra steps in order to make sure that they do not have any problem in the future. One of them is email id and mobile number. Till date, providing these details was not mandatory. However, since this year, these things have become mandatory for filing returns. Consequently, the income tax department can send emails and SMS for any queries or information. People, who have already registered their mobile numbers and email ids before, should update them now, if there has been a change in the address or the number. This is especially applicable for people who had more than ten income tax accounts and had already registered before.
Image may be NSFW. Clik here to view.
Completing The Process With Passwords:
In order to complete the process of filing, the tax payers will have to enter the one time passwords. The password will be sent by the income tax department and after logging into the e-filing account, they have to authenticate. NRI taxpayers will have to authenticate by means of the password sent in the emails. Validation is required because in many cases tax payers did not receive proper information and communication from the department. However, now important messages and information can be sent via mail and message.
Smooth And Convenient Process:
In order to ensure that you have a smooth and convenient filing process, the IT department requests all tax payers to cooperate at the earliest. Validation is required only for one time. In the future, if the tax payer changes his number or email ID, it has to be updated and validated again for once. There is nothing to bother about sharing these details with the department because the department has advised that the emails and sms can be kept in the safe list so that communications from the department are not blocked.
Sharing Common Email Id:
There are many people and many business organizations that do not have email ids. In such a case, they can provide a common email id or phone number of other family members so that they can the necessary information from the department communicated to them. In fact, the department has also said that one common mobile number or email id can be used for a maximum of 10 user accounts during the process of e-filing. The taxpayer will also get the opportunity to enter any other number as a secondary contact number.
Getting In Touch Directly:
This attempt has mainly been taken in an effort to get in direct touch with the taxpayers anytime, as required. There are cases when there were issues of pending refunds and the IT officer had to face difficulty in getting in touch with the taxpayer. However, with this process, the entire thing will get simpler and lots of hassles would get reduced in the entire process. Therefore, as a taxpayer, it is high time to provide the necessary details or update the information required by the department. Thins will be smooth and convenient like never before.
Related Readings and Observations
10 best Tax-Saving Investment Options We earn. We spend. We save. And then, at the end of the fiscal year, we compute our income tax. Many of us hurriedly invest in a bid to reduce our tax liabilities. The government has […]
Things you need to know about Capital Gain Taxation Capital Gain (both long terms as well as short term) happen to be an important criteria as well as an invaluable area of discussion whenever it comes to the aspect of the sale of any of […]
Indian Tax Structure and Laffer Curve The Laffer Curve could be defined as the geographical representation of the relationship between tax rates, tax revenue and taxable income. The principle behind the Laffer curve theory is […]
eSignal Mobile Application for iPad – Review eSignal, an Interactive Data company and leading provider of real-time desktop solutions for professional and individual traders, this week announced the launch of eSignal Mobile, a […]
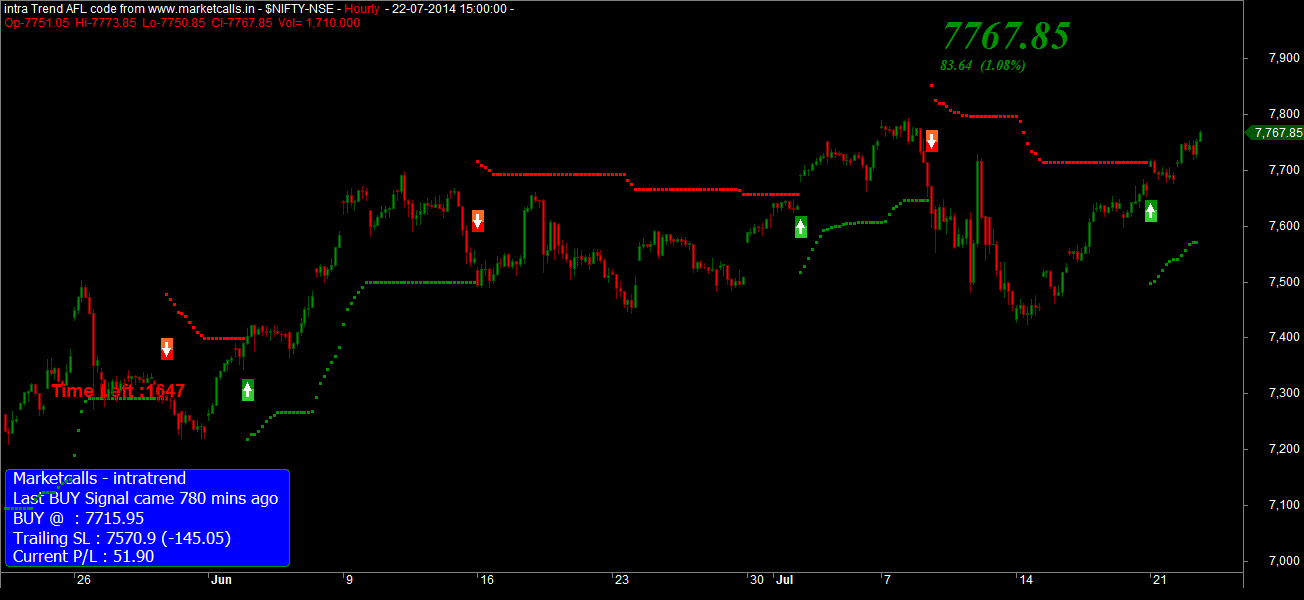
Nifty and Bank Nifty currently trading very close to its all time high made on the Union Budget 2014 event 7809 and Bank Nifty made a All time high around Election 2014 results 15742.
Nifty and Bank Nifty on the hourly charts turned to positional buy mode with the support zone comes near 7570 and 14951 respectively. Reverse your position to positional sell mode if the support zone breaks the support on the downside(hourly basis)
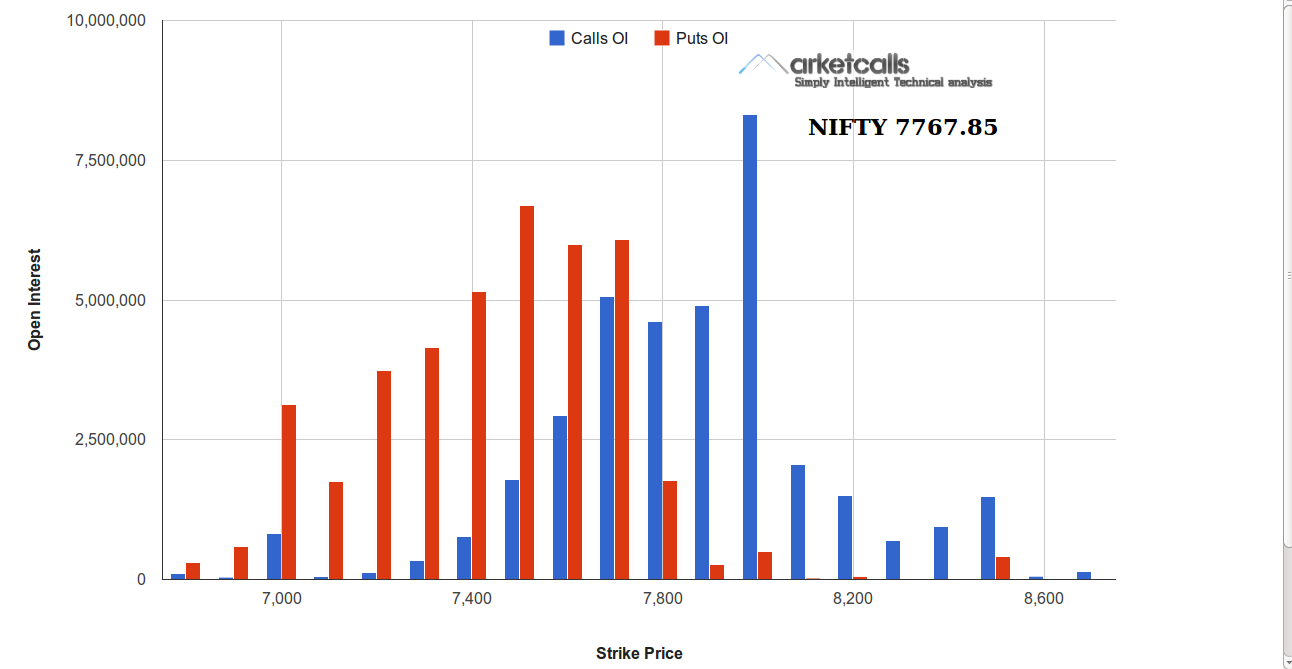
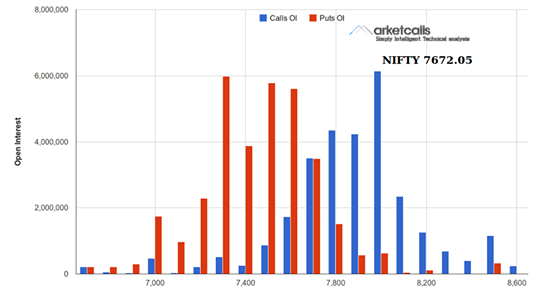
Currently Nifty Options Open interest built up is still greater at 8000CE. However currently active put writing happening currently in 7500PE, 7600PE, 7700PE. Option writers very strongly believe that Market might close above 7700 for the current option series.
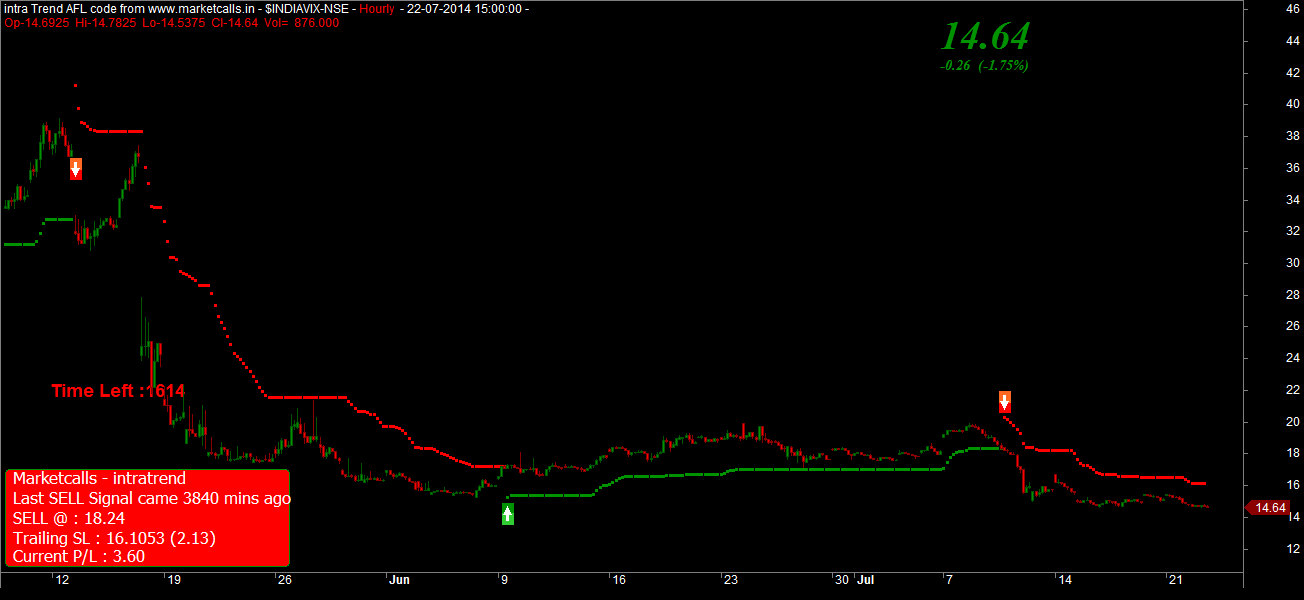
India VIX Hourly Charts
India VIX on the hourly charts trading currently below 15 levels and maintains the low volatility season and also maitains the positional sell mode. Reverse the position to positional buy mode if the support zone breaks downside on the hourly charts
Does Shorting Favors Nifty and Bank Nifty Traders? On the Weekly charts Bank Nifty turned to long term sell mode and nifty still trading below 5EMA(High) and nifty still holds the long term buy mode. Currently the long term resistance zone […]
Nifty and Bank Nifty June Expiry Overview Nifty and Bank Nifty maintains the positional sell mode with resistance zone coming around 7673 and 15569 respectively. Reverse your position to positional buy mode if the resistance […]
Increased Volatility and Flipping Option Writers Market fallen down 100+ points and once again there is a flip in open interest 7600CE and 7700CE writers taken advantage by building higher open interest. There is a confused state among […]
Call writers take advantage post IIP results Industrial production grew at 3.4 per cent in April after contracting for two months in a row mainly due to improved performance of manufacturing, mining and power sectors and higher […]
Here is a simple AFL code snippet to plot One Previous Day High Low and currently day One hourly high low (i.e high between 9:15a.m – 10:15a.m as per NSE timings)
Previous Day High Low AFL code
To compute Previous days high-low values we need to use TimeFrameGetPrice function as shown below. TimeFrameGetPrice basically retrive the O,H,L,C values from other timeframes and in this case it is Daily timeframe and the same values are plotted in lower timeframes.
To get Current days’ first one hour high and low we need to use timebased functions like timenum() and finally ORBH and ORBL captures the first one hour high and low. And you can change the timings mentioned below the suit your exhchange and your requirements.
OST=091500; //Observation Start Time
OET=101500; //Observation End Time
Currtime =TimeNum(); //get current time
ob_end = Cross(TimeNum(),OET); //detect the observation end time
ob_st = Cross(TimeNum(),OST); //detect the observation start time
Highest_since = HighestSince(ob_st,H,1); //capture the 1 hour high
Lowest_since = LowestSince(ob_st,L,1); //capture the 1 hour low
ZLEMA ATR Long Only Trading System – AFL code ZLEMA ATR Long only Trailing stop loss trading is a mechanical strategy for higher timeframes. The trailing stop loss is quite adaptive and adjustible in the down trends to revise it […]
Bollinger Band Based Trailing Stop Loss – Amibroker BBand TSL or or Bollinger Band based Trailing stop loss trading is once again a mechnaical trend trading system for lower timeframes inspired from mql4 (metatrader). The trailing stoploss […]
How to Plot the Equity Curve without Backtesting? In Amibroker the general way of computing the Equity curve is to backtest the given trading system and the report computes the equity curve, drawdown...etc results for you. And to compute […]
Double Donchian Trading System – Amibroker AFL code Double Donchian Trading system is a Breakout trading system inspired from Richard J.Dennis. Donchian channels were developed by Richard Donchian, a pioneer of mechanical trend following […]
Technical Update: Nifty future closed the week on a positive note on weekly chart. Nifty future closed Friday’s trading session -34.45 points. Last bar close is negative. Nifty future just managed to close above the short term trend line. There is a possibility of double top formation been formed in nifty future but yet that is not confirmed yet? Fresh up leg will begin once nifty future sustains above 7835 only.
Price: Price action still suggest a buy in dips market as bulls come at every support with buying. No major correction has been seen this past week. Though Nifty achieved the upside targets as suggested in our previous weekly report.
RSI: 14 day daily RSI is @ 61.98. The momentum indicator has turned downside as market facing resistance at higher levels. Also from the chart above, one can clearly see the negative divergence, we have marked the same with arrow’s and circle even with uptrend market the price making higher high’s and momentum indicator is making lower high’s. It’s a sign of been cautious at higher levels.
Trend: Short term trend up with cautious bias, medium term, primary trend are up with strong support at 7550 levels
Volume: The past week rally is been on lower volume as compared to the correction seen previously.
Trading Strategy: Short term traders watch 7790 and 7745 levels. Bias for the week will remain positive once 7790 above market sustains. Bears will be active if nifty future close below 7745 . Intraday & Short term next supports 7705-7650
We are entering to FNO Expiry week for nifty future July series hence buying far out of money nifty options for July series on hope should be strictly avoided.
Trader’s holding long should keep stop loss of 7745. For fresh longs in nifty future, open positions above 7835 with protective stops of 7780 for upside targets of 7890 and 7950. Trader’s going short at higher levels must keep stop loss at 7835 levels only we thou avoid catching tops hence will wait till trend confirm’s any change.
Related Readings and Observations
Nifty Future Report – Weekly View – 21st July 2014 Nifty Future breakout from a rising wedge and made lows of 7445 this past week and made the Intraday high of 7692 and closed the week at 7669.35. For week starting Monday 21 July 2014 […]
Nifty Weekly Charts As per our 5 EMA Strategy, Nifty Weekly Charts shows resistance at 2827. Only if we close above 2827-2850 levels for this week, we can initiate fresh longs. So Not betting much on […]
ETC Networks:"A worthy merger story" Scripscan-ETC NetworksCMP-150Traded in:NSE-BSEStory:Merger storyBusiness:ETC Networks derives its revenues mostly from commercials and trailers advertisements.The company has couple of […]
We have been using the Volume chart as a reference along with other indicators, moving averages, exponential moving averages to watch out if the breakout or breakdown is with volume or not. A common belief regarding the Volume was what I grew up learning with and it was only later that I realized after going deeper into Volume that what we see in a normal Volume chart is not exactly what volume is all about. I did not have much knowledge of any Volume based indicators then; and understanding Market Profile was out of question.
I used to keep searching the internet regarding many topics and the priority was that I could find an indicator which can give profits and most importantly consistent profits. In this search for something related to Volume I just happened to add Volume At Price Multi (As it reads in Amibroker) to the price chart. At first I thought that this is what Market Profile should be but then I did not find any other parameters so kept on looking at the Volume at price formations and kept on changing timeframes and as 1 minute was the lowest timeframe I could select due to my data restrictions as I did not have tick data, I started using that 1 minute Volume at Price chart for Intraday trading in Nifty futures and it has served for me as an Effective use of Volume At Price for Intraday Trading.
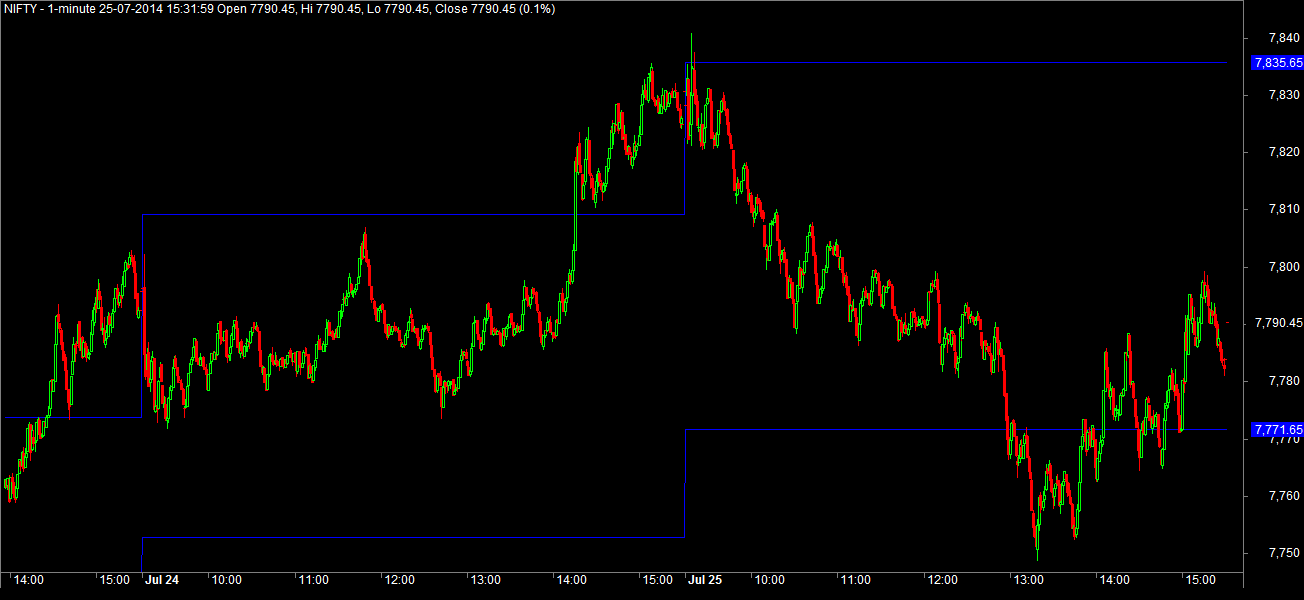
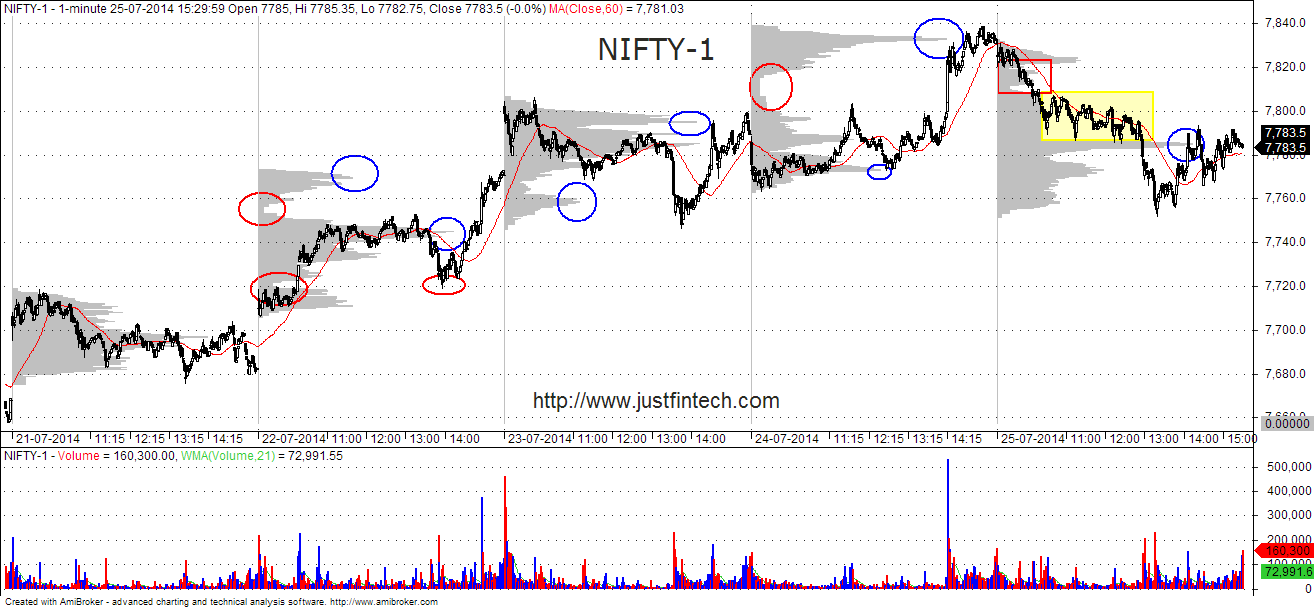
Have a look at the following 1 minute chart of Nifty Futures :
Image may be NSFW. Clik here to view.
Nifty Futures 1 Minute Volume At Price Chart
In the above chart we can see that when we look at the Volume plotted vertically on the price instead of the horizontal volume bars plotted in the pane below, it gives us some clue of the prices reacting in the zone where there is lowest concentration of volume and where there is highest concentration of volume. (Later came to know that this is called High Volume Node and Low Volume Node in Market Profile Terminology).
I take those high and low volume areas very seriously as that gives an idea of the intention of market participants at those prices. As we can see, on 22-07-14 NF (Nifty Futures) opened and traded in a narrow range for an hour and then broke out on the upside with volume and while going up left a low volume area near 7718-7722. Now instead of instantly entering into a buy trade, I would add 50% longs at the point of breakout and then wait for it to decide further move. I went up till 7553 and traded in the range of 7735-7750 for sometime, creating the highest concentration of volume near 7745 zone (marked in blue circle). So now, as per the Volume related with price, 7718-7722 range is support and 7745 is resistance zone as price could not trade above that 7745 zone. As the high of the previous day was same as the lowest volume range I would prefer to buy a dip towards that range and exit part near 7745 and rest at day end.
Again on 23-07-14, the price was trading above the high volume zone of 22-07-14 and then dipped towards another zone of high volume concentration of 22-07-14 ( 7765-7770 range). So I would buy 50% there and waited for the prices to progress. The volume was concentrated now near 7755-7760 zone which was a low volume zone of 22-07-14. Remember, we had highest concentration at 7745 so we will closely watch that price and we got a dip towards 7746 and the prices quickly reversed, assuring of the previous support. We added longs at 7750 and waited for the cross of 7765-7770 range and finally exited longs at day end near 7790.
Followed the same on 24-07-14 but 25-07-14 was different. Prices traded below the highest Volume concentration zone of 7728-7733 and highest volume concentration was formed in 7815-7822 zone on 25-07-14. We now look for the price action near 7805-7810 zone which was the low volume zone of 24-05-14 marked in red circle. It could not stay above that zone so we sell 50% in that range and watch the previous days high volume zone of 7780-7785. Price tried to go towards 7785 in 3 attempts till 7785.05 and finally in 4th attempt it gave a breakdown below that zone and we added 50$ extra shorts. The point to watch out will be the low volume zone of 23-07-14 and high volume zone of 7785. The prices went down and took support near 7750 and till 7745 does not break, the trend will not continue downwards as per all previous observations. prices reversed towards the 7775 zone we book out the shorts on the break above 7775 and at day end.
The above Volume at price observations work better if combined with retracement and Vwap. If the market does not trend or trades in a very narrow range then we will end up in loss of few points but it works well when the market trends for 40 to 50 points after an hour of opening range and is useful for people who do not have access to Market Profile charts.
So, to conclude the observation, I have been trading these Peaks and Valleys created on Vertical Volume At Price in lieu of the access to Market Profile charts and it works well if combined with other studies.
Disclaimer : Anything and everything if followed with discipline will work in the markets and I request to do personal observation before trading on the above method as what works for me may be suitable for my nature and may not fit others trading style or nature.
Related Readings and Observations
Didi Index Long only Trading System Didi Index is a positional long only trading system constructed based on three exponential moving averages inspired from mql4 code Didi Index Indicator. Indicator developed by Brazilian […]
Nifty and Bank Nifty Hourly Index Charts – Outlook Nifty and Banknifty hourly Index(spot) chart turned to positional buy mode on the hourly charts and currently the support comes around 6736 and 12785 respectively. Reverse your position to […]
Internal Bar Strength – Mean Reversion Trading AFL code Here is a simple mean reversion system adapted from IBS reversion edge with QuantShare. And our IBS mean reversion strategy is a slight variation of the Internal Bar Strength by taking a […]
Nifty and Bank Nifty Future April Overview – II Currently nifty maintains the positional buy mode on the hourly charts with support zone comes around 6711. Reverse your position to positional sell mode if the support breaks on the […]
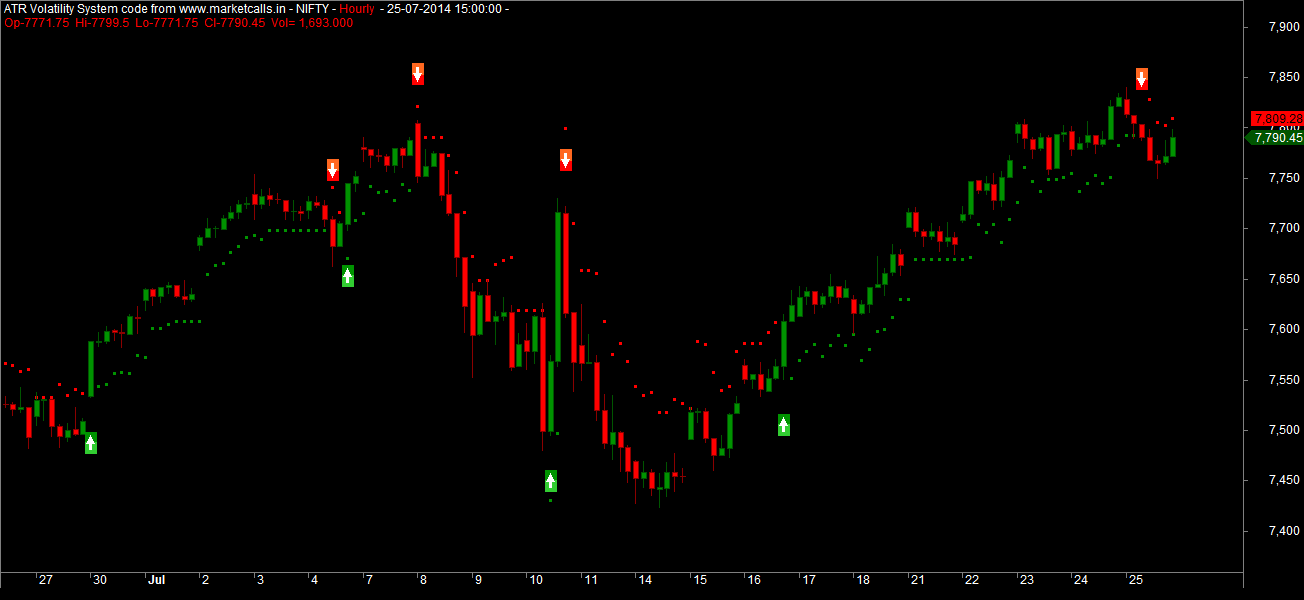
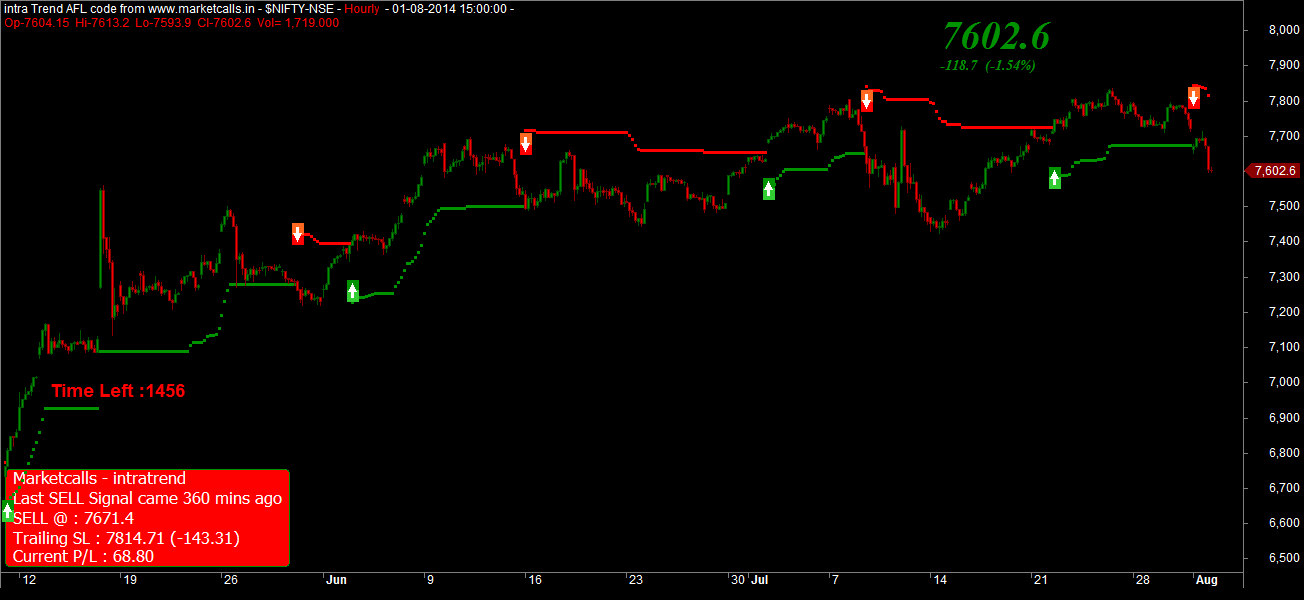
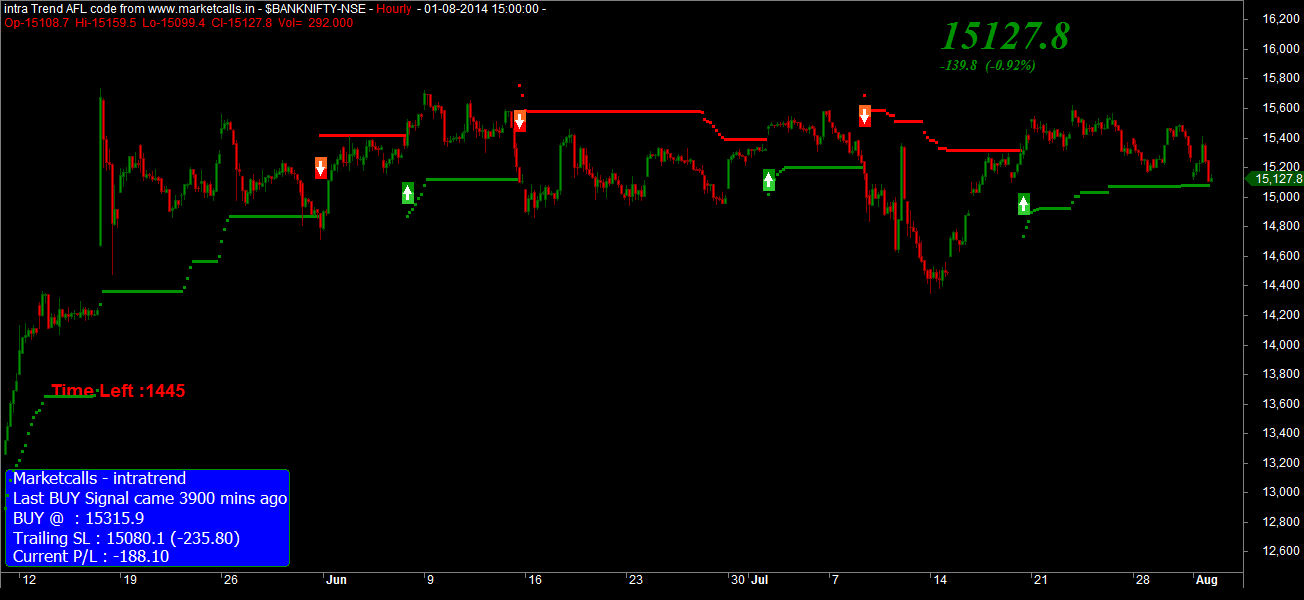
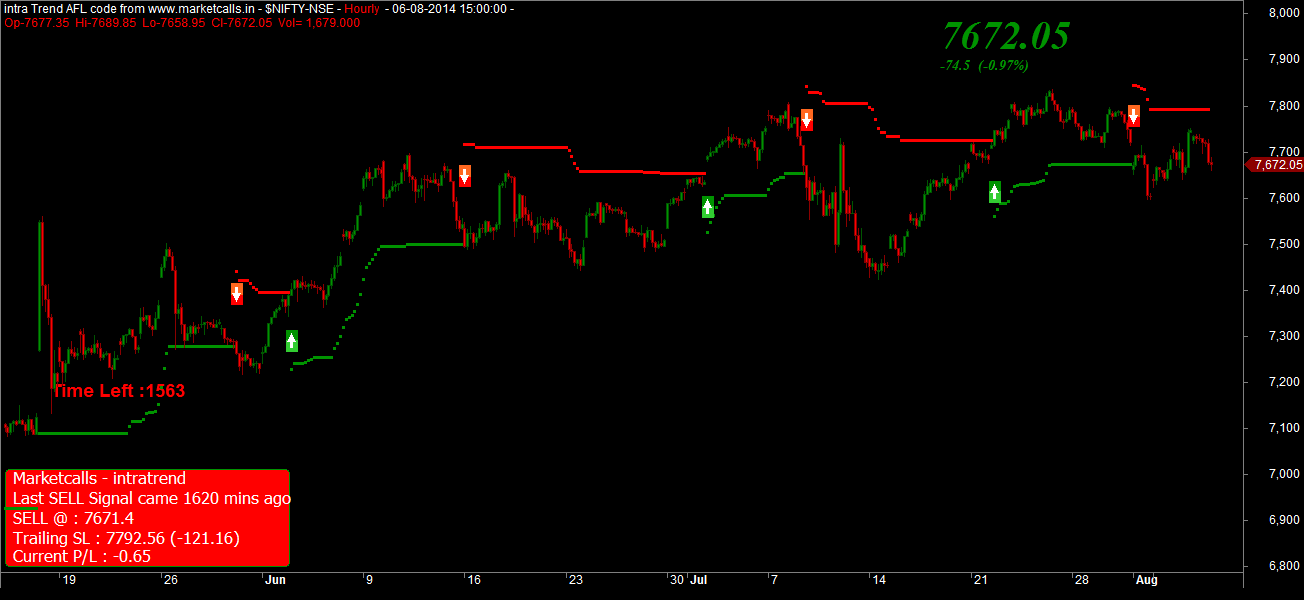
Yet another ATR Volatility based Long only Trading System. ATR Volatility system a mechanical strategy for higher time-frames Written by Tudor Marcelin – Art Invest. Just modified the actual trading system to support trailing stoploss based rather than channel based trading system and added back testing functionality. Tighter trailing stoploss and quicker exit and adaptive revising of trailing stoploss is the one key feature in this trading system especially when trading with higher timeframes.
Indications
1)The green line indicates trailing stop for longs
2)The Red line indicates trailing stop for shorts
3)The Green Arrow indicates longs
4)The Red Arrow indicates shorts
Features
1)Trailing Stoploss based trading system
2)Buy/Sell Signal Added
3)Magnified Market Price at the right top corner
4)Backtesting futures added.
Recommended Timeframes
Preferably higher timeframes like 30min,hourly.etc. Perfectly suits for positional traders who intersted in Long and Exit strategies. And moreover it is a carryforward strategy and not a intra-day strategy though. But work pretty good in high volatile environment.
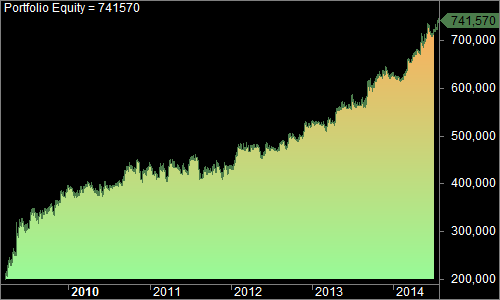
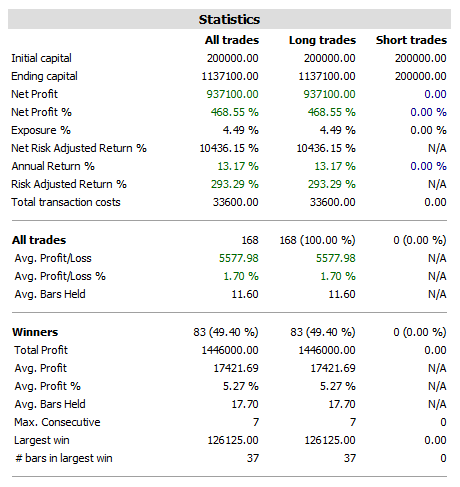
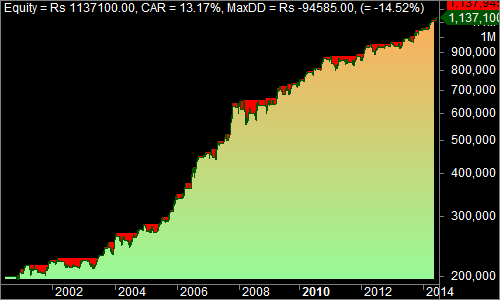
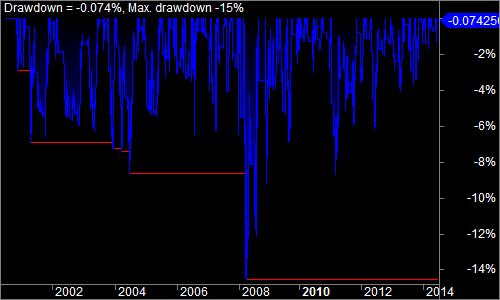
Backtest Results for Nifty Spot Since March 2009 to July 2014 Image may be NSFW. Clik here to view.
Download Backtest report for ATR Volatility Long Only System. Backtesting done for 2 lots of Nifty with 100/leg brokerage included
Steps to Install
1)Download ATR Volatility System
2)Unzip ATR Volatility System.zip to local folder
3)Copy ATR Volatility System.afl file to \\program files\\amibroker\\formula\\basic folder
5)Open Amibroker and Open a New Blank Chart
6)Goto Charts->Basic Charts and apply/drag-and-drop the ATR Volatility System code into the blank chart
7)Bingo you are done. Now you will be able to see the ATR Volatility System indicator with Buy and Sell signals.
Compatibility
Amibroker 5.5 and above
Related Readings and Observations
Bollinger Band Based Trailing Stop Loss – Amibroker BBand TSL or or Bollinger Band based Trailing stop loss trading is once again a mechnaical trend trading system for lower timeframes inspired from mql4 (metatrader). The trailing stoploss […]
Didi Index Long only Trading System Didi Index is a positional long only trading system constructed based on three exponential moving averages inspired from mql4 code Didi Index Indicator. Indicator developed by Brazilian […]
Internal Bar Strength – Mean Reversion Trading AFL code Here is a simple mean reversion system adapted from IBS reversion edge with QuantShare. And our IBS mean reversion strategy is a slight variation of the Internal Bar Strength by taking a […]
Here is a real life example from Gary Chan sharing the way he started running Algorithmic Pair Trading strategies. Its a pretty old video taken from NYC Algorithmic Trading Meetup. It is a must watch if you are algo trading enthusiast and willing to start your game.
Gary Chan gave keynote talk – in this clip he explains his motivation for sharing his work in a public meetup forum:
In this video Gary chan points out the examples he used for what his definitions of Easy vs. Hard are. Spoiler alert: Getting into Harvard is hard. Opening a successful restaurant is hard. Algorithmic trading is (by comparison) easy.
Things you need to know before buying PAID indicators As a trader almost everyone of us who are in the phase of "the search of holy grail" could have tried exploring the so called PAID indicators and often ends with wrong indicators which has […]
Why Algo Traders Stay Away From Traditional Trading Platforms? The so called Quant or Algo traders prefers to stay mostly away from Traditional trading platforms like Amibroker, Ninjatrader, Metatrader, Metastock, Tradestation etc. Do you know why?
The Importance of Benchmarking Selecting the right benchmarking technique and index can be critical for truly understanding your strategy success. In this post we benchmark the Sell in May strategy with the S&P 500 […]
Backtest your Pair Trading Strategies – Amibroker AFL code Today, pairs trading is often conducted using algorithmic trading strategies(Rule based) on an Execution Management System. These strategies are typically built around mathematical models […]
Before getting into the strategy just wanna tell you that amibroker supports two in built functions gapup() and gapdown() to identify gap up and gap down openings.
GapUp() – this inbuilt function Returns ’1′ or ‘true’ on the day a security opens gap up. Rest of the days it returns Zero.
GapDown() – this inbuilt function Returns ’1′ or ‘true’ on the day a security opens gap down. Rest of the days it returns Zero.
Based on this two functions one can easily create a Simple Gapup and Gapdown Strategies.
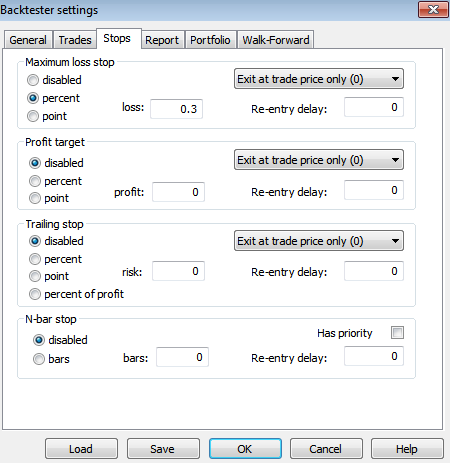
Strategy Rules
Strategy is very simple. when the market open with gap up and at the same time ,it crossed the previous day high then it should be considered as strong buy. When the market open with gap down and while opening if it crosses yesterday low then it should be considered as strong short.
1)Target % parameter Control is given to the user. so user can set the target as required. Default value is 1%
2)Stop loss logic in the AFL code is not added however you can set the stop loss nearly 0.3% in the bactesting settings as shown below. 0.3% if Static stoploss is the minimum risk
3)Tested the strategy with different stocks and its success ratio in between 50 to 60 %
4)On an average you will get the signal 2-4 times in month .
5)Exploration is also added to scan the stocks which meet above requirement
Preferred Timeframe : 5min charts.
One can experiment with high beta stock.The beauty of the system is stop loss is only 0.3 % which is very less .
ATR Volatility Long Only Trading System Yet another ATR Volatility based Long only Trading System. ATR Volatility system a mechanical strategy for higher time-frames Written by Tudor Marcelin - Art Invest. Just modified the […]
ZLEMA ATR Long Only Trading System – AFL code ZLEMA ATR Long only Trailing stop loss trading is a mechanical strategy for higher timeframes. The trailing stop loss is quite adaptive and adjustible in the down trends to revise it […]
Bollinger Band Based Trailing Stop Loss – Amibroker BBand TSL or or Bollinger Band based Trailing stop loss trading is once again a mechnaical trend trading system for lower timeframes inspired from mql4 (metatrader). The trailing stoploss […]
Lead (30.7.2014) moved up with other base metals & topped out at resistance.
Now Lead is trading at 2226 on LME & as we can see on charts, lead was able to produce a negative candlestick pattern after touching the topline of short term channel . The top line was represent 161.8% correction are of last minor bullish wave. However the reversal yesterday already touched the support zone but downtrend probably continue for coming trading session.
On fundamental side,, some off beat data like pending home sales , may put pressure on base metals.
Image may be NSFW. Clik here to view.
Based on above studies, we will prefer to sell lead for some possible targets around 2179 & then 2152. A day close above 2312 will force us to reanalyze the charts.
Related Readings and Observations
Zinc – Major Reversal Chart Pattern in Forming. Now zinc is trading around 2290 on lme & as we can see on weekly chart, there is a strong probability of an ABCD reversal pattern. If we look at daily chart , we find some reversal […]
Will Gold Resume Downtrend Move Again Now gold is trading around $1271 mark & as we can see on charts, gold retested the upper tradeline of minor descending channel & placing a bearish candlestick pattern once again […]
Crude Reaching Reversal Zone Once Again. Now crude is trading around $103.60 & as we can see on charts, crude once again reaching to the resistance zone ,from where we already witness 2 reversal earlier. The candlestick […]
Crude Oil broken Major EOD Support. Now Crude is trading around $100.50 & as we can see on charts crude finally manage to broke below the support trade line holding from start of 2014. The downside breakout came with […]
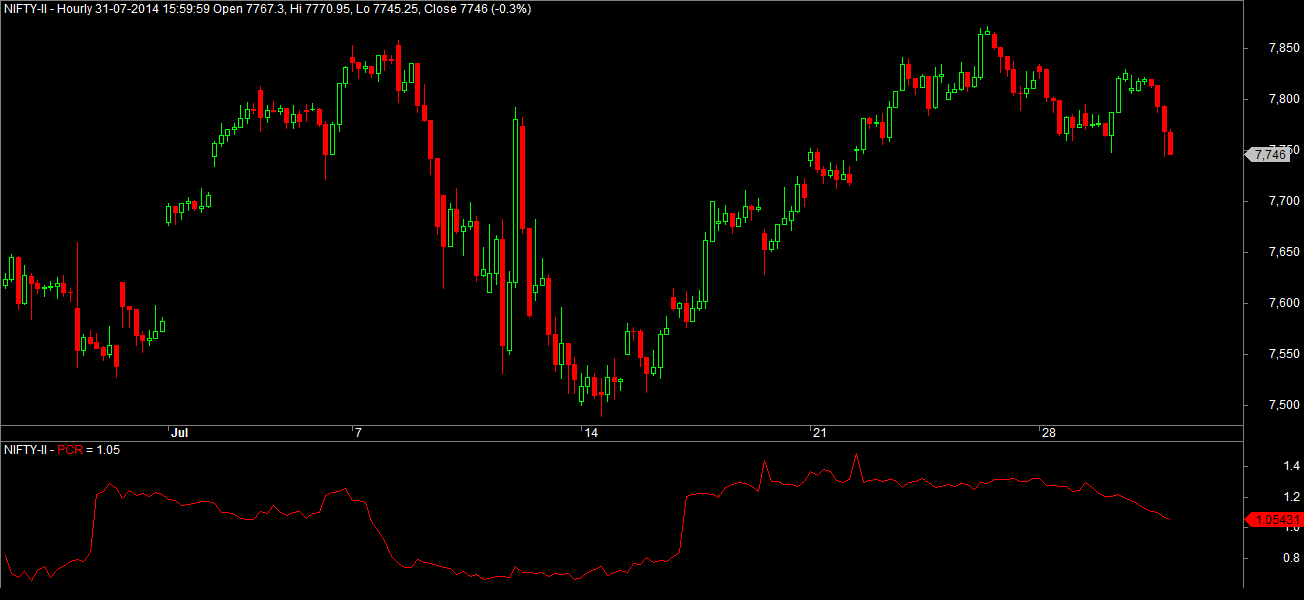
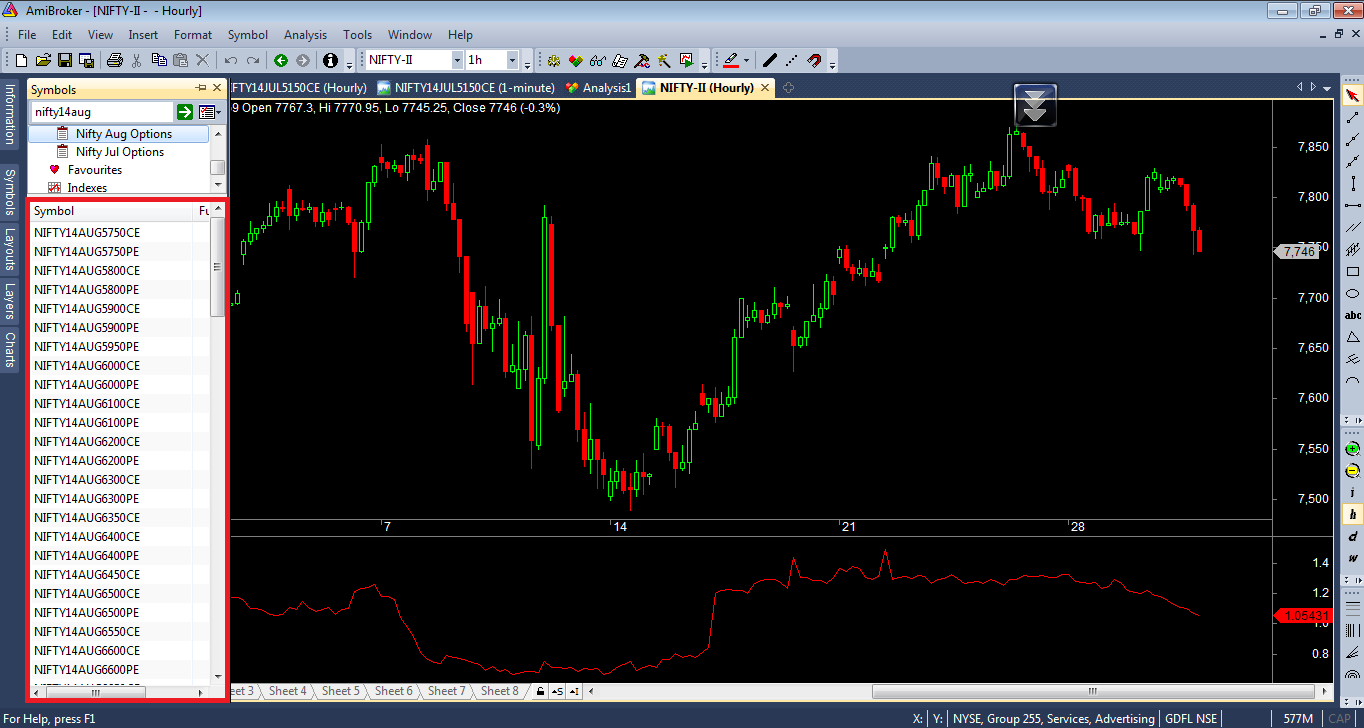
This tutorial explores how to build Put Call Ratio (Open Interest) chart in Amibroker for the any given Option Instrument. Since creating a PCR chart involves multiple Option Strike price and it is a composite indicator it can be achieved in Amibroker using Addcomposite function.
About Addcomposite Function
Bascially the concept behind AddToComposite is that we run our afl code (using Scan feature) through a group of symbols performing some calculations. We will compute some multiple security statistics and store the results in the artificial ticker created using AddToComposite function.
Requirements
Before building the PCR(OI) composite indicator here are some of the prerequisites
1)Amibroker Trial/Licensed Version
2)Realtime Data Subscription / IEOD data for NSE Future and Options Segment which supports Open Interest Data.
3)Knowledge to Create Watchlist and Scanning in Amibroker.
1)We need to calculate the Total Open Interest of Call for the particular option series and push it to the Artifical Ticker ~niftyoice
2)1)We need to calculate the Total Open Interest of puts for the particular option series and push it to the Artifical Ticker ~niftyoipe
3)Now divide ~niftyoipe/~niftyoice and plot the results on the charts.
Create a Watchlist with the Strike Price of Option symbols belongs to the same series(includes PE and CE as shown below). For Ex push all the Nifty Option symbols of August 2014 series in a watchlist. (Manual Work takes lots of efforts the best way is to use the search function and select the list of option symbols and push it to the watchlist).
2.Install the Indicator
i)Download Put Call Ratio – Amibroker AFL code
ii)Unzip Put-Call-Ratio-OI.afl_.zip to local folder
iii)Copy Put-Call-Ratio-OI.afl file to \\program files\\amibroker\\formula\\basic folder
iv)Open Amibroker and Open a New Blank Chart
v)Apply Plain Candle stick chart
vi)Insert PCR chart below the Plain Candle Stick chart (you dont see any charts until you perform scan)
3)Perform Scan
i)Open New Analsis and Select the Put-Call-Ratio-OI.afl file from \\program files\\amibroker\\formula\\basic folder.
ii)Set the timeframe to hourly
Image may be NSFW. Clik here to view.
iii)Set the filter settings as shown below. In this example Nifty August series watchlist is selected. Image may be NSFW. Clik here to view.
iv)Now Press the Scan Button. This attempt will create the Artificial symbols ~niftyoice and ~niftyoipe
Now get back to the chart and you should be able to see the Nifty futures candlestick chart along with August PCR chart below the nifty futures price chart. You can perform an auto scan to update the PCR chart at regular scanning intervals.
Related Readings and Observations
Nifty Vs PCR – 3years Historical Chart Nifty and PCR - 3Year Historical charts are shown. PCR simply reveals investor sentiment. For Nifty PCR above 1.5 indicates optimistic investor sentiment i.e more puts are written when […]
Modified Nifty Options Tracker Here is a modified Nifty Options Tracker. PCR(OI) for current series had been added
for Nifty and Reliance Charts with auto update feature
Intraday Gap Up and Gap Down – Amibroker Strategy Strategy is very simple. when the market open with gap up and at the same time ,it crossed the previous day high then it should be considered as strong buy. When the market open with gap […]
ATR Volatility Long Only Trading System Yet another ATR Volatility based Long only Trading System. ATR Volatility system a mechanical strategy for higher time-frames Written by Tudor Marcelin - Art Invest. Just modified the […]
Last friday nifty lost close to 118 points intraday due to fears of a decline in global money flows if the United States, increases interest rates and due to Argentina’s second default in 13 years. The RBI’s monetary policy review on Tuesday could guide us the further direction and could give us clear cut view on the market direction. It should be noted that FIIs infuse over $26-billion so far in 2014; $6-billion in July alone but still USDINR trading below 4 month low.
Nifty on the hourly charts turned to Positional Sell mode with resistance zone around 7814 on contrast Bank Nifty maintains the Positional Buy mode and trading very close to the support zone near 15080. Any breakdown below 15080 on hourly close could turn bank nifty into positional sell mode.
India VIX Hourly Charts
India VIX still maintains the positional sell mode since mid of july 2014 and currently the resistance zone comes under 15.73. Any breakout would like to show increased volatility in the market.
Currently 7300PE holds the highest open interest amoung the strike price. Its quite early to point of that 7300 could act as a support zone as the August Option series just started.
Nifty and Bank Nifty June Expiry Overview Nifty and Bank Nifty maintains the positional sell mode with resistance zone coming around 7673 and 15569 respectively. Reverse your position to positional buy mode if the resistance […]
Increased Volatility and Flipping Option Writers Market fallen down 100+ points and once again there is a flip in open interest 7600CE and 7700CE writers taken advantage by building higher open interest. There is a confused state among […]
Nifty Surges despite option writing at 7500CE Open Interest built up is still higher at 7500CE and despite call option writing at 7500 nifty surges and closed with a weekly return of 4.88%. 7500CE and 7600CE are the highest open […]
Technical Update : Nifty Future has been facing stiff resistance at 7830 levels. As updated in previous nifty future report weekly view 7745 below bear’s got active and market cracked to 7611.25. Global weakness was one of the added reason’s for the steep fall on Fridays trading session in market. Going ahead in coming week all eyes are set for Tuesday’s RBI’s monetary policy review.
Price : Nifty Future closed the week at 7622.60. Nifty Future closed weak with a bearish note with bearish bar’s on daily charts as well as weekly charts.
RSI : 14 day RSI is trading @ 47.55 with downside momentum as updated in previous nifty future weekly update to go with cautious approach had proved very valuable for trader’s.
Trend: Nifty future Short term trend down, medium term neutral, primary trend up with major supports @ 7586 (50 DMA).
Stochastic : The stochastic Indicator also given sell signal on daily charts.
Volume: There has been increase in nifty future volume on decline in markets.
Trading Strategy : Day trader’s & Positional Trader’s for Nifty future can on Monday’s trading session open shorts in pullback till 7690 with a protective stop loss of 7725 above close for a target of 7585-7470. If RBI disappoint on Tuesday the fall will be sharp and swear. Low risk traders enter 7700 Strike Nifty Options Puts with same stops in pullback.
Nifty Future Hurdle 7715 Resistance 7755 7790 Support 7586 7480
Related Readings and Observations
Nifty Future Report Weekly View 26th July 2014 Price action still suggest a buy in dips market as bulls come at every support with buying. No major correction has been seen this past week. Short term traders watch 7790 and 7745 […]
Nifty Future Report – Weekly View – 21st July 2014 Nifty Future breakout from a rising wedge and made lows of 7445 this past week and made the Intraday high of 7692 and closed the week at 7669.35. For week starting Monday 21 July 2014 […]
Nifty Notes for 11th July 2008 Index : CNX Nifty Open : 4166 High : 4215.5 Low : 4014.45 Close : 4049 Avoid trading near Fibo level - 4214 and day high is 4215.5If you are a clever trader, what you […]
Rediff Launched Realtime News – Search the News as it happens Rediff has launched a realtime news search service announced asRediff RealTime News.According to the report, around 35,000 Indian and global news websites are being crawled by Rediff and […]
We read and follow countless trading strategies for day trading, position and many more.You find trading strategies for break out, momentum and trend following trading strategies or procedures.We have Bollinger band or Rsi based strategies and MA cross over or candlestick strategies and tutorials available in youtube for future or stock trading.Inspite of all these strategies we fear to trade or if we do trade,we end up in loss.Are those strategies and implementation faulty or is there errors in our understanding and assumptions which are responsible for bad results?Well to give one example.Can you keep 11KVA high tension line lying on ground? Can you lay high pressure gas line exposed or laid underground ? Certainly not.High pressure gas line sometimes have pressure 4 times as high as that in domestic gas cylinder.Potential danger is incredible.But does the lay people know that?Or does he have competency know that ? His understanding is sense of indifference or at best a perspective of an harmless water carrying pipeline.Just seethe difference of perception between the assumption and reality.Lifeand death.Only a qualified and competent engineer understands and realizes this reality.Yes trades and trading are no less dangerous as compared to exposed high tension line or high pressure gas trunk line in terms of their immense suffering.Trenching is equally important for HT lines and trades to keep them at arms length from human life – in case of trade it your and your family life.Qualification and competency matters in trading .Volatility and manipulations ,now HFT and Algos have rendered trading more like 11KVA three phase high tension wire which are to be understood and handled by experts .Just blindly implementing strategies is fatal.
STARTING WITH BREAKOUTS OF TOMATO PRICE
LITTLE EXPLOSIVE TOMATOES
I am trying to investigate one common strategy as part of understanding the idea of the topic.When you buy a break out and it fails and falls back through the lows of the previous day it is time to get out. If the lows of the break out day are held that is a good chance of a new range and trend beginning. It is like inflation of commodities.Once price of certain commodity breaks a level ,it stays there for good length of time.Take price of tomatoes now which is ruling at Rs 120.00 per Kgs .Just watching its progress from range to range ,it provides objective lessons to trading in stocks in phenomenal way.From 15 to 20 range to 40 to 60 range and finally jumped to 100 to 120 range in less than couple of weeks.This is break outs in our day to day life but gives important lessons to sophisticated trading as to the power of breakouts .Merchants are enjoying these frequent break outs now days at the expense of common man and consumers .This is political part of breakouts and news papers calls them inflation and volatility.But it is combination of supply and demand dynamics plus sentiments.Or due to black marketeers and hoarding or simply manipulations.
Yes breakouts are driven by consumption demand ,speculation due to sentiments such as greed and manipulation.Price breakouts and greed feed each other and price gains further traction to next range or to next resistance level.So this is high probability trade.In theory ,every thing sounds fine and sure way to make profits.But based on this assumptions ,you trade – you end up in loss.So what went wrong?
UNDERSTANDING CYCLIC SYSTEM OF PRICE
Trend following as a trading strategy has pitfalls and trades if not handled technically like applied engineering..the net result is going to be zero.This is because price has cyclic property like a typical processing cycle in refinery. Faulty engineering leads to wasteful internal recirculation within the system with net output zero or less than expected due to passing valves. Therefore understanding engineering of equipment cycle and their functioning can only help achieve successful trouble shooting and desired results. Grasping the concept of wave nature of price and proper engineering of trades can produce desired result .Lack of it leads to internal recirculation with no net result. Imagine using a common ring instead of a split ring in an electric generator with net result of no current in galvanometer. Just refer to your high school physics. Understanding principle and engineering of mechanism is as much critical to trading not a common sense thing always.
ORBITING STOCK PRICES
stock prices tend to rotate and have rotational motion. It takes the form of wave in charts, Wave is graphical or schematic representation of rotating motion of prices like rotation of moon around the earth.so our common tendency to expect linear trend with no volatility is based on ignorance and illusive byproduct of greed and false assumption. This is like assuming moon would one day go tangentially off the orbit around the earth.Rotating motion is reduced to or …represented by sinusoidal waves for oscillators .But to predict that this sinusoidal wave would someday get converted to a parabola for an oscillator is absurd and wishful thinking. Rotation for oscillators are a hard fact and reality. So is volatility of stocks.
But chart is sum of its parts. Each phase, up or down is followed by obedient and loyal medium term and long term averages like 50 and 35DMA and can be used as trend reversal.
However momentum is different cup of tea.Infact even when trend remains firmly up ,momentum or relative change could be zero or negative. You can not rely on trend for day trade or position trade. So it is important to distinguish between trend and momentum. Momentum is net directional velocity at the end of a wave, If price makes back and forth moves by 200 points , relative change is zero despite the trend being up.So one has to trade from level to level to catch relative change. Just you trade a trend as is done trend following strategy ,net gain going to be zero at the end of wave.Engineering matters her as does in refining or current generator.
WISDOM OF OIL AND GAS INDUSTRY AND GAME OF CHESS
Working in hydrocarbon industry carries life risk forever as oil and gas are highly inflammable substances .Therefore safety precautions and control measures carries premium here in terms of responsibilities.Heads rolls and criminal proceedings are initiated in case of negligence ,incompetencies and dereliction of duties responsibilities.It is chess board where well calculated strategies are played profitably.In spite of these serious consequences and possible lapses and costs .the industry is thriving in last century. In fact Banks and hydrocarbon sector share many risk aspects and impacts.Financial markets have crashes ,depressions ,bankruptcies or simply volatility and manipulation and hot or smart money.Well ,the prime responsibility in trading is to control the impact of twin risks such as manipulation and traps by cartels for both small and big traders.This is giant chess boards and some times decks are stacked against you as part of routine.Remember the risk of Chess.
HOW TO KNOW WHEN YOU ARE BEING GAMED ?
For example ,As described in above strategy,if after break outs price can not sustain the move and falls below previous day low ,your trade is up against manipulators and you got to exit which normally one does.This is controlling the risk before disaster buffet you and your account.In oil and gas industry decision making is quick and clear.The first person responsible has to stop the welding jobs in case of gas leaks or uncontrolled fire and call the tender .Simple direction is given to stop gas supply to consumers even for minor leaks due to potential nature of risk to people’s lives.Business and profit takes back seat.
With my limited perspective of market,potential risk or hazard it trades and stock market is rampant manipulations like match fixing in cricket matches and chess game tactics of smart money and cartels.As in case of gas leaks ,you are alerted of the potential danger and control It by by cutting off supply,in trading and stocks ,once yesterday’s low is taken or some other such things happened you should be alerted of manipulators ,pirates gaming you and exit.This is rationale behind exits of various strategies and sensitization of RISK.Risk is not just nearest level but lively creatures haunting you at some hidden and remote terminal targeting your trading account and balances in it.
VOLATILITY Vs GAMING
Trendlines ,patterns breakouts,moving averages and indicators ,resistance and support levels or pivots or fibs all do have real impacts on sentiment and actions of traders and people as vouched for in TA books to create bullishness or bearishness or neutral.They do imply and induce emotions such as greed or fear or nothing.One has to merely observe oneself and verify their authenticity.It does not take much.Then price gains traction either way or contracts.One can rightly anticipate or predict the future course to a certain degree by looking at the chart features and combining with sentiment.However most fail to profit as we tend to ignore volatility which is reality of random nature of market due to noise.Market is unique as it is random yet predictable so nicely.This is beauty.Harmless noise only when you learn to cohabit with it.Noise disturbs ,distracts and destroys trades if not planned and creates doubts and confusions.This is not safety issue and one should not exit due to noise or volatility or trades should not lost to whipsaw.
On the other hand,fatalities and losses occurs when your trades are gamed as in chess game.In chess like scenario ,there is no safety ,you are up against someone formidable like match fixers.You have to quit then.
RESPONSIBILITY IN TRADING
Responsibility in trading is exactly that in Hydrocarbon industry.Safety is primary concern in oil and gas sector and business values take back seat.Be it refining, drilling ,processing or transportation and handling ,unsafe conditions and unsafe practices can cause immeasurable losses to human lives and property and have serious legal implications.So the industry has huge responsibility in terms of handling these risk and conducting its business.
Two aspects are important and common to oil industry and trading.one -There are huge risk associated to both businesses.Second both business have to be conducted to make profits to make economic sense.So both business have to be vigilant and put in place robust contols to make business meaning fully.
To give a sense , BLOW outs happens in oil drilling rigs sometimes when drilling is in progress and causes losses to lives and resources.But oil companies can not stop drilling.Prvention mechanisms and continuous high tech monitoring have resulted in high performance drilling despite the monster of disaster forever lurking.The drillers lives are always in line.Yet a good driller goes about doing his job always following the operating or strategy manual and keeps safety manual handy for contingencies.
In gas transportation ,there is risk of pipeline leaks and big blast and fire as recently happened in Taiwan when many died.Due to this potential danger ,pipelines are monitored real time and in case of minor leaks ,gas supply is cut off which means loss to company.Here I am talking of responsibility –responsibility not only to make profit but responsibility to prevent dangers or risk.TWIN RESPONSIBILITY are applicable to trading as much as to oil industry.
BIFURCATION OF QUALITY AND SAFETY OBJECTIVES- HOLISTIC MANAGEMENT
Any professional has to follow the quality operating procedures called various strategies to execute the job he is assigned to and refer to the Risk register to control or prevent contigent risks or hazards.Both together constitute the management manual but not only those strategies peddled in net.This is where most of us are wrong and getting poor results ultimately.Major disaster happens both in trading and oil industry only when quality objective and procedure manual or trading strategy is blindly followed and safety bench marks are overlooked and hazard aspects are neglected due to ignorance,incompetencies and mismanagement or personal character and profile.
So it is important to have sense of both Job quality objective and Risk awareness or sensitization.In fact it is more important to have sense of risk and danger involved or else one fails in one’s responsibility criminally.Now imagine a lines man not knowing danger of 11KVA High tension line and going to work.Death trap.A sensible trader should be aware of all hazards and also the risk of predators and manipulators in Chess board called market before executing a strategy as Good driller would always go about his drilling job fully aware of the potential blow out conditions waiting and timely quit to save his life.Learn strategy but learn to detect blow outs.Follow APEX manual ,of which trading strategies are only part.
Now start drilling and watch out for Blow outs.Our oil companies have drilled many.
Related Readings and Observations
How to Do Intraday Trading in Stocks? It is a well known fact that most intraday traders don’t make money in the market. One day they book a profit but the very next day they incur a loss because either the market goes into […]
Nifty Hourly Chart Update for 20 Oct 2010 Trading Nifty Hourly sell signal continued for the third day and the trailing stop loss updated to 6134. While trading with Optimized Ichimoku Trading System the following things needs to be taken into factor
CCI-4 Strategy Next to RSI-2 My eyes are always around CCI-4 Strategy. Unfamiliar with the CCI? Read this StockCharts.com primer. In a nutshell, CCI looks at how far an asset has diverged from […]
Here is the simple smoothed RSI crossover Long only strategy can be practiced on higher timeframes especially with daily timeframe with controlled risk. It catches the big trends and gets little losses during sideways movement with a descent amount of winning ratio. Strategy suits for Nifty and Bank Nifty future traders willing to take positional trades based on EOD chart.
Buy or Sell Rules
1)Buy on Positive Smoothed RSI crossover.(indicated by Green Arrow)
2)Exit on Negative Smoothed RSI crossover.(indicated by Red Arrow)
It is recommended to take Buy or Long Exit decision should be taken close to EOD (between 3:20p.m-3.30p.m). To take decision on the next day after the signal settradedelays(1,1,1,1) should be defined in the afl code.
Recommended Timeframe
Daily – Long and Exit Strategy
StopLoss
Preferred static Stoploss(intraday Exit Stop) is 2.5*ATR of the close price.
Backtested Results (Nifty Futures EOD-timeframe)
Backtesting done for the 14years of nifty futures with Initial Capital of Rs2,00,000 , 2 lots of fixed nifty lot size with Rs100/leg brokerage included.
Intraday Gap Up and Gap Down – Amibroker Strategy Strategy is very simple. when the market open with gap up and at the same time ,it crossed the previous day high then it should be considered as strong buy. When the market open with gap […]
ATR Volatility Long Only Trading System Yet another ATR Volatility based Long only Trading System. ATR Volatility system a mechanical strategy for higher time-frames Written by Tudor Marcelin - Art Invest. Just modified the […]
ZLEMA ATR Long Only Trading System – AFL code ZLEMA ATR Long only Trailing stop loss trading is a mechanical strategy for higher timeframes. The trailing stop loss is quite adaptive and adjustible in the down trends to revise it […]
Gold (06.08.2014) traded lower & retested the support zone once again.
Now gold is trading around $1301 & we can see on charts, gold was able to provide a triangle breakout. This breakout was very much awaited after gold placed a bullish candlestick pattern just above the 61.8% feb correction level. However today breakout confirm the upside move for coming trading weeks. RSI oscillating just below 50 mark which will provide more strength if crossed.
On fundamental side, Russia Ukraine is issue is again coming radar & may support safe haven buying.
Image may be NSFW. Clik here to view.
Based on above studies, we expect gold to move higher & reach to $1320 & $1344 level respectively. Only a fall & close below $1278 will force us to reanalyze the charts.
Note – Above view is based on technical studies & do not represent our buy-sell recommendation. For recommendations Contact Us
Related Readings and Observations
Will Gold Resume Downtrend Move Again Now gold is trading around $1271 mark & as we can see on charts, gold retested the upper tradeline of minor descending channel & placing a bearish candlestick pattern once again […]
Gold technical analysis – Will Weakness Continue? Gold (28.3.2014) traded higher as per previous report & extended target area. However it reverse quickly from an unexpected level later on. Now gold is trading around $1296 & as we can see […]
Will Gold Continue to Rally in 2014? Now gold is trading around $1343 & as we can see on charts, gold was able to provide a day close above 61.8% feb correction level of last long descending move from $1433 to $1182.
Gold Bullish Breakout Ahead – Technical Outlook Now gold is trading around $1245 & as we can see on chart it is reaching to the minor parallel resistance area at $1254. we have witness a major bull bear fight in this $1217 - $1254 range […]
Any persons today involved in buying and selling stocks or future or commodity calls themselves traders. If you are someone who is been involved in stock market trading be it from a week ,a month or a year or many years if u have not been able to profit or make consistent returns from your trading here is a reality check to find out why?
Image may be NSFW. Clik here to view.
In this article we discuss the key factors which can help you become better traders and also a profitable trader.
Most people come in stock market looking for easy money, the trading is a side business for them never a primary source of income and hence there is only a wish to make money but never the burning desire, a goal to make constant money or be a successful trader.
Usually 1st of the few trades are the happy go lucky trade’s either be it from their own gut feeling, some hot tip they saw over the internet or advice from there broker or relationship manager. If the trade turns out profitable the feeling of happiness and thrill along with a mindset that just one click and a profit of xyz number is been made makes a new trader thinks it’s pretty easy and he/she can do this if every day for x number of days can make an additional income.
But that’s just the beginning of the big hole one digs without even knowing the depth how far they will fall. Often these trader’s have no idea of money management, risk management, position size models and nor they are interested in learning these forget technical analysis or fundamental analysis to even consideration.
After the initial phase the trader here who had just made some big bucks on his few trade’s witness 1st time a stock going against and is holding on to the loss even further once stop loss hits he continues to hold on hope that market will bounce back and some over smart people will just average more on margin on their own or advice from there guru’s. Hence just adding to the loss now the whole profit is eroded and net loss just from 1 position devastates them.
The outside influence is so much that they fail to give up and again repeat same mistake over & over of big positions, poor risk rewards, getting in and out of the trades and major losses keep fighting the market or the stock. But remember in stock market one’s ego is not bigger than the trend and if one is caught on wrong side it will just lead to broke.
Many of the trader’s start looking for sure shot tips and FII operator news thinking some short cut to success is there and these kind of insider news or hot tip will make them rich quick, get back there capital make them highly profitable. Internet sites, Google ad’s, rediff shout outs and most campaigns are filled with such promises, but again nothing works cause most people are looking at wrong places and following the wrong people.
Often these kind of tips giver with FII , Operator, Insider marketing gimmicks and sure 2lakh, 5lakh profit a month are losing trader’s who are now giving tips or fake analyst’s without having proper skill or knowledge of markets. But the messages said are so strong that the new trader who wants a quick fix for his problem is lured in to it. But they never make profits from them also and just add to the emotional and financial loss during the whole period.
Apart from the above most traders’ just want it for free and hence they spend their entire trading carrier taking free trials from every advisory or tips company they could see on the internet. Day after day they will log in to some xyz website fill the trial form and take free trials and are never satisfied with the services cause 1 day trial or 3-4 trades are no way to long term success in markets.
Going against trend – Shorting just because its high and should fall is one belief most new traders carry within their mind and buying just because it is cheap and should bounce is another belief most new traders hold due to which they lose their capital.
What is the possible solution for all this, and how one can actually make the most of the opportunities stock market & any specific queries new traders have can be reached via comment section or on mail : mohitjhanji@gmail.com
Related Readings and Observations
Shanon’s Daemon : Profit from Randomness Shanon's Daemon is based on the theory manifested by Claude Shannon. In the 1940s, the great genius conducted an experiment also known as Shannon’s Demon and it proved that it is possible […]
Understanding The Background Of Random Price Behavior Random-walk theorists usually start from the premise that the major security exchanges are good examples of “efficient”markets. An “efficient” market is defined as a market where there are […]
When Day Trading Turn into Boxing My good friend Mr Murthy asked me one day to advise him what to do with 3000 Tata power stocks he purchased at Rs 90 and now that it fell to 79/-.Dilema and confusion have paralyzing […]
Nifty fell on late wednesday and banking stocks led the decline.The Bank Nifty fell 1.9% as yields on bonds rose, heightening concerns over the lenders’ debt holdings. Banking stocks such as ICICI Bank, State Bank of India (SBI), Punjab National Bank, Bank of India, Axis Bank and Canara Bank are down 2% each. IDBI is the top looser and lost more that 6%. It should be noted that Reserve bank of India on Tuesday cuts banks’ statutory liquidity ratio by 50 bps to 22.00 pct of deposits from August 9 and leaves repo rate unchanged at 8 percent
Nifty and Bank Nifty hourly charts currently in positional sell mode. And bank nifty very recently turned to positional sell mode on the later half of the wednesday trading session. Currently the resistance zone comes very close to 7792 and 15585.7 respectively. Reverse your position to positional buy mode if the support zone breaks on hourly basis.
India VIX still maintains the positional sell mode since mid of july 2014 and currently the resistance zone comes under 15.73. Any breakout would like to show increased volatility in the market. Currently no much significant movement in India VIX.
Nifty Open Interest Lookup
Currently both 7300PE and 8000CE holds equal amount of open interest indicates market for current expiry close is likely to be little broad ranged. And option writers are expecting nifty to show volatility and it could trade in the range of 7300-8000 range. Lot of Volatility expectation from option writers for current month expiry. Image may be NSFW. Clik here to view.
Related Readings and Observations
Will the Volatility in the Market Increase? Indiavix on the hourly spot charts is in positional Buy mode with supports coming around 15.22. Reverse your position to positional sell mode if the support breaks on the hourly charts. […]
Nifty and Bank Nifty August Overview Last friday nifty lost close to 118 points intraday due to fears of a decline in global money flows if the United States, increases interest rates and due to Argentina's second default in […]
Nifty and Bank Nifty Very Close to All time High Nifty and Bank Nifty currently trading very close to its all time high made on the Union Budget 2014 event 7809 and Bank Nifty made a All time high around Election 2014 results 15742.
Does Shorting Favors Nifty and Bank Nifty Traders? On the Weekly charts Bank Nifty turned to long term sell mode and nifty still trading below 5EMA(High) and nifty still holds the long term buy mode. Currently the long term resistance zone […]
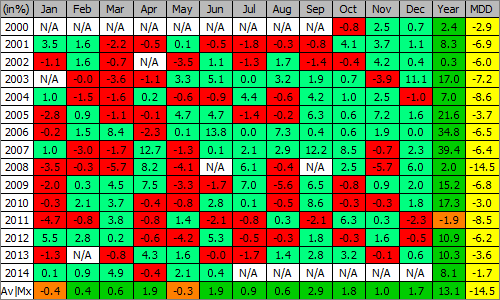
Over the last 15 years the economy of India has boomed and it has been reflected in the NIFTY index. The NIFTY has grown 7x since 1998 as the country has grown its exports. According to the UN the one of the primary exports of India are high value services which contributes 30% to their GDP.
We developed a hypothesis that as the strength of the NIFTY grew, the strength of the currency would follow as it is a primarily export economy. As the INR strengthens the ratio to USD falls making it an almost ideally inversely correlated asset.
We first tested this hypothesis treating the USDINR FX pair as a hedge against the NIFTY, but found there were periods where they were positively correlated and the hedge did not work.
Pivoting slightly we experimented with rotating the holdings of the portfolio to focus on the peak performing asset. We used a fixed rolling window to determine the peak performance and then swapped our holdings to focus on that asset.
We used the QuantConnect LEAN 2.0 backtesting engine which allowed us to import financial data from any source to run our analysis. The backtests were conducted over a 16 year period and were completed in 5-10 seconds. We saw phenomenal performance due to the strongly trending nature of the NIFTY and USDINR, achieving a Sharpe Ratio achieving 1.3 vs the NIFTY 0.7, and 42x returns vs 7x of the NIFTY.
To test the resilience of the strategy we experimented with the rolling window period to determine if this was critical to the success of the strategy. We used a rotating window from 3 days up to a 30 day window to optimize the variable for the best performance: Image may be NSFW. Clik here to view.
The resulting Sharpe Ratio is fairly robust regardless of the precise value of the rotating window period.
We believe there are many potential future improvements to the strategy to be explored; such as using a dynamically determined rolling window to avoid curve fitting. You could also experiment with different portfolios of inversely correlated assets to pick the best basket of assets.
This post originally appeared on the QuantConnect Blog. QuantConnect is a free online back-testing solution, seeking to democratize finance and make algorithmic trading accessibly to all investors.
The Importance of Benchmarking Selecting the right benchmarking technique and index can be critical for truly understanding your strategy success. In this post we benchmark the Sell in May strategy with the S&P 500 […]
Banking stocks Leads the Decline Nifty fell on late wednesday and banking stocks led the decline.The Bank Nifty fell 1.9% as yields on bonds rose, heightening concerns over the lenders' debt holdings. Banking stocks such […]
Nifty and Bank Nifty August Overview Last friday nifty lost close to 118 points intraday due to fears of a decline in global money flows if the United States, increases interest rates and due to Argentina's second default in […]
Learning from Gary Chan – How to Start with Algo Trading? Here is a real life example from Gary Chan sharing the way he started running Algorithmic Pair Trading strategies. Its a pretty old video taken from NYC Algorithmic Trading Meetup. It is a […]
Detailed analysis on Software Vendor Empanelment at NSE India.
India Delhi (7/1/2014) : SEBI allowed all exchanges to go for online trading in year 2000.After that NSE release his Circular no. NSE/CMO/0029/2000 dated December 19, 2000 regarding Empanelment of Vendors for CTCL facility / Internet Based Trading Services. After release of this circular various software company apply for empanelment & first one is Financial Technology Odin product.
To enable the vendors/members to utilize the Program Trading/ CTCL / Internet based trading facility, the Exchange provides technical specifications (message formats/protocols etc) for the interface with the Exchange’s trading system in the form of a NNF document separately for CM and F&O segments. The NNF documents will now be made available to all members free of cost. This NNF document is used by the trading system to build tools for analysis, risk management and decision support for their own trading activities.
IN year 2003 NSE revise their fee for Empanelment & is now for commercial purpose – 22500$ USD one time & 5600$ USD per annual & for In House development is 3400$ USD one time & 1120$ USD per annual. Above mention charges are valid for both segments. Time taken by NSE to approve Software Vender Under empanelment is near about 3 to 4 Months.
Now the important point If your Algo/DMA/CTCL software provider does not have their registered office in India Then they can not be part of Indian NSE empanelment list. But you can use them as they fall under Circular No. 003 / 2011 Registration of Foreign Independent Software Vendors (ISVs).According to this circular fee is same as Empanelment Venders.
There are some laws related to selling of AlgoTrading Platform for empanelment or In-house Vendors may sell source code / APIs to trading members only after securing prior written approval of the NSE India for the same.
After Empanelment Vendors shall provide a complete list of user ids to the Exchange on an half yearly basis (on or before 10th July for the six months Jan – June and 10th January for the six months July – Dec).
In case of Empanelment Venders Sale of unlimited licenses shall not be permitted by NSE India. In starting But from 2005 NSE released circular that Empanelment Vender can sell unlimited licenses but they have to intimate Exchange.
Right Now there are only 13 Empanelment Software’s Vender under NSE List. List as follows: M/s. 3i Infotech Technologies Ltd, M/s. Dion Global Solutions Ltd, M/s. Financial Technologies (India) Ltd, M/s. Geojit Technologies Pvt. Ltd, M/s. Greeksoft Technologies Pvt. Ltd, M/s. Marketplace Technologies Pvt. Ltd., M/s. NSE.IT Ltd , M/s. Omnesys Technologies Pvt. Ltd., M/s. SunGard Solutions (India ) Pvt. Ltd, M/s. Tata Consultancy Services Ltd & M/s. Techspan India Ltd.
List of NSE Members those are using In House & ISV Foreign is very big right now its near about 345.
For Reference
The Exchange has issued circular no.NSE/CMO/0235/2005 dated Aug 24, 2005 (Download No.NSE/CMTR/6552) regarding detailing requirement and procedures to be complied with by members desirous of using the CTCL facility.
Vendors desirous of being empanelled with the Exchange for providing CTCL solutions to the trading members of the Exchange can refer to circular no.NSE/CMO/0029/2000 dated December 19, 2000 (Download No.NSE/CMT/2174), circular no.NSE/CMO/0039/2001 dated December 14, 2001 (Download No.NSE/CMTR/3054) and circular no.NSE/CMO/10 dated January 28, 2003 (Download No.NSE/CMTR/3896) detailing the requirements and procedures to be complied with by vendors for empanelment.
Related Readings and Observations
Ichimoku Cloud Scanner v2.0 – AFL Code The Demerit with the older version of Ichimoku cloud scanner is that there is too much of difference between the cloud(stop loss) and the candle which is overcomed by introducing stop loss […]
Nifty Options Short Strangle Strategy for March Option Expiry This Short Strangle option strategy is for medium risk takers who is bullish on nifty and those who believe that nifty will trade in a range between 5200-5900. If you are the one then you […]
Nifty hourly trading and Trin Charts Nifty hourly trading shows the continuation of the buy mode with hourly supports near 5456. Also the rising trin charts shows that recently there are more declining stocks than the […]