Quantcast
Channel: Market Calls
Viewing all 2070 articles
Browse latest View live

Why Algo Traders Stay Away From Traditional Trading Platforms?

$
0
0

The so called Quant or Algo traders prefers to stay mostly away from Traditional trading platforms like Amibroker, Ninjatrader, Metatrader, Metastock, Tradestation etc. Do you know why?

These traditional trading platforms are designed to meet retail level expectation i.e you can connect up to various brokerages, downloading data, charting, customer indicators, backtesting..etc. It is relatively easy to understand their programming language and you can easily automate any simple trading strategies. Retail traders mindset is to create a simple plain vanilla trading algorithm and to find a edge in the trading system.

R-Python

Retail traders prefer to stay away from trading strategies like Pair Trading, Options Mispricing…etc. Retail traders prefer Data management, coding indicators/signals, charting , backtesting and performance evaluation to be easier, They prefer to concentrate more on trading than their algorithms.

What are the issues with Traditional Trading Platforms?
1)Your trading algorithms are not cross portable. If you are writing a trading algorithm in one trading platform and tomorrow you willing to test another trading platform then you cannot easily port your trading system easily.

2) You cannot code complex mathematical models into traditional trading platforms. For example performing Co-integration between two trading pairs i.e ADF root test or performing complex statical models, implementing feed forward models , machine learning models is quite challenging in traditional trading platforms.

3)Most of the traditional softwares lack multithreaded backtesting capabilities.

4)Performance degradation of your trading system becomes poor when you are planning to test your models on bigger portfolio size.

5)Retail traders are dependent on trading system providers for support, bug fixes and updates.

6)Performing Monte Carlo testing is difficult in most of the trading softwares.

How does the quant traders solve such issues?

Generally most of the quant traders prefer trading programs like C, Python, R, Matlab,FPGA. They build their own data connectors, Order Management, Risk Management, Execution Mechanism, Data managament, backtesting/Optimization/Walkforward testing modules. Programs and modules/packages in python, C are open source and completely free, even for commercial use, as are many of the key scientific libraries. Building complex statistical models are quite easier which the retail level trading platforms are not able to solve. Parallelization and ability to hand huge computational power are another key to depend on such programming models which gives the scalability to your portfolio.

If you ask me to rate the retail level trading platforms for algo trading then multicharts comes at first as it support for backtesting portfolio of strategies, pair trading backtesting, optimization etc which lacks in most of the traditional trading software.

Related Readings and Observations

The post Why Algo Traders Stay Away From Traditional Trading Platforms? appeared first on Marketcalls.


Will this Pre Budget Rally continues?

$
0
0

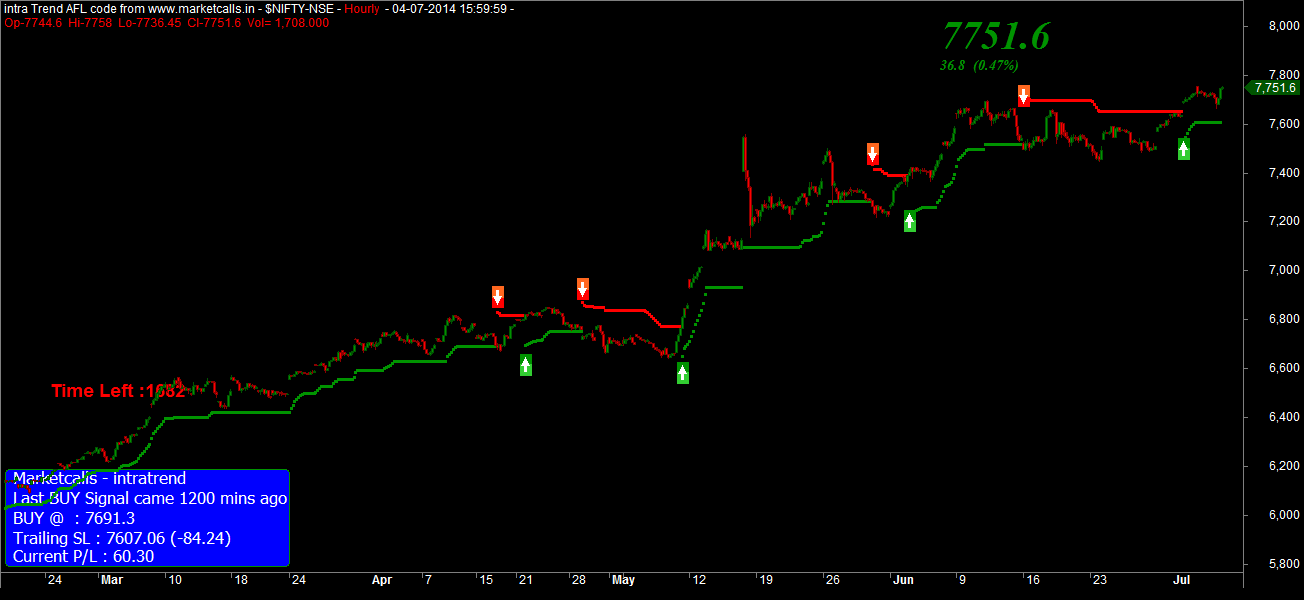
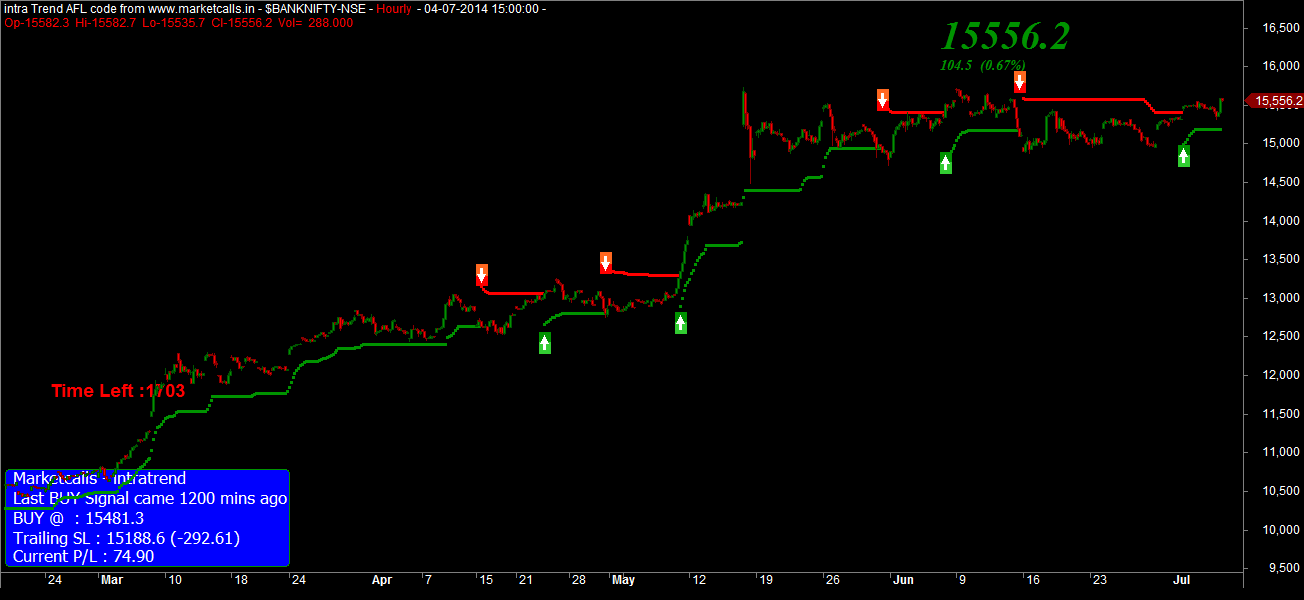
So the Pre budget rally is here and last week nifty bounced off from the low and made a fresh all time high and currently closed at 7753. Also it closed above the Weekly 5EMA(High) which indicates a firm long term trend intact. However it should be noted that Banknifty havent crossed yet the previous all time high and trading very close to the previous high.

Nifty Hourly Charts

NIfty Hourly Spot

On the hourly charts nifty and bank nifty both turned to positional buy mode with support zone comes around 7607 and 15118. Reverse your position to positional sell mode if the support breaks on the hourly charts.

Bank Nifty Hourly Charts
Bank Nifty Hourly

India VIX Hourly Charts
India VIX

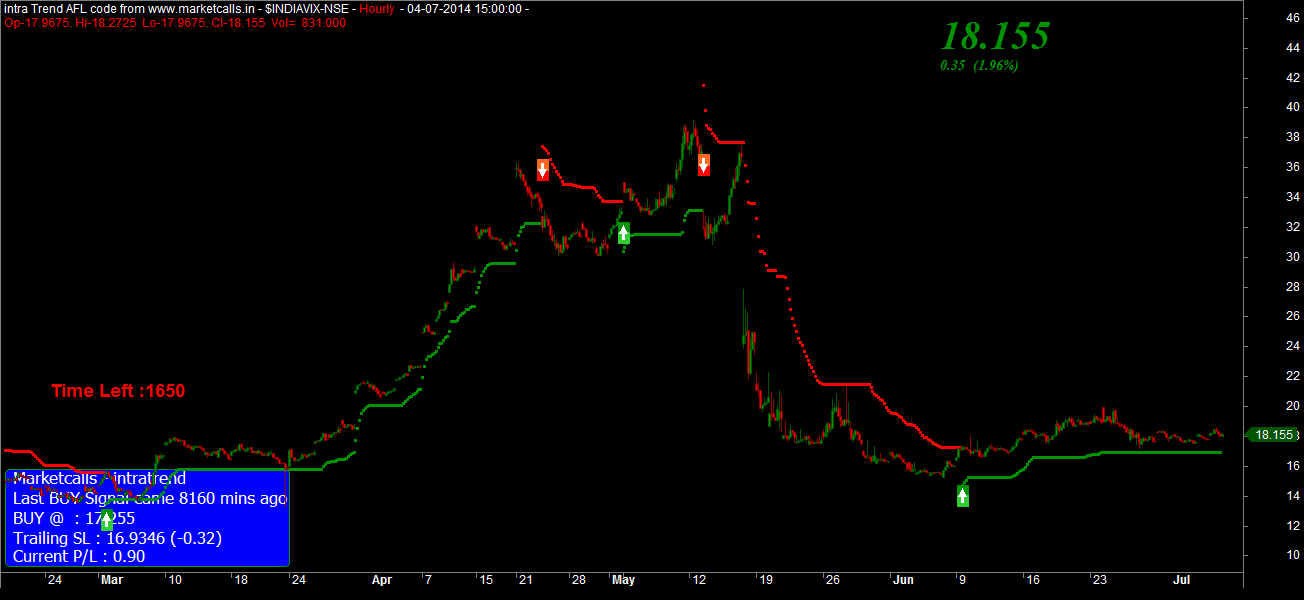
India VIX still maintain the positional buy mode with the support zone comes around 16.93 and reverse your position to positional sell mode if the support breaks on the hourly charts.

Nifty Open Interest Lookup
Nifty OI Pre Budget

The open interest picture shows 8000CE has higher open interest built up however it could not be witnessed as call writers as major news is around the corner and call/put writers might not be strongly confident enough to write puts/calls at this point of time. We could get more clarity once the finance minister start delivering his budget presentation.Let see what actually the Finance Minister delivers on July 10th.

Related Readings and Observations

  • Nifty and Bank Nifty June Expiry Overview Nifty and Bank Nifty maintains the positional sell mode with resistance zone coming around 7673 and 15569 respectively. Reverse your position to positional buy mode if the resistance […]
  • Increased Volatility and Flipping Option Writers Market fallen down 100+ points and once again there is a flip in open interest 7600CE and 7700CE writers taken advantage by building higher open interest. There is a confused state among […]
  • Call writers take advantage post IIP results Industrial production grew at 3.4 per cent in April after contracting for two months in a row mainly due to improved performance of manufacturing, mining and power sectors and higher […]
  • Will the Volatility in the Market Increase? Indiavix on the hourly spot charts is in positional Buy mode with supports coming around 15.22. Reverse your position to positional sell mode if the support breaks on the hourly charts. […]

The post Will this Pre Budget Rally continues? appeared first on Marketcalls.

Railway Budget 2014 Summary

$
0
0

Railway Minister D.V. Sadananda Gowda presents the NDA government’s maiden Rail Budget. Check out the long list of Raiway Budget 2014 summary.

railway budget

Railway Budget Summary So Far

E-ticketing system to be improved to support 7200 tickets per minute as against 2000 tickets at present

Cleanliness is Godliness. HIGH emphasis is to be given to improve cleanliness at stations & trains.

Introduction of women RPF constables, coaches meant for women to be escorted for greater safety.

High-speed trains proposed to connect major cities

Railways to go PPP way to set up solar panels on the train roofs (PIB)

Total PPP investments in FY15 estimated at ₹6,005 c

Express trains and 4 premium express trains to be introduced. Bangalore to get suburban trains.

Important tourist destination Kodagu will get Railway facility.

Summer internships for under-graduates of engineering & management studies

Innovations Incubation Center to be set up to leverage talents, harness staff potential in creating new ideals

High speed trains on Kanpur-Nagpur, Mysore-Bangalore-Chennai.

To create urban transport infrastructure to boost traffic

To allocate ₹5,116 cr for projects in NorthEast

Aim to spend Rs 40,000 cr to lay new track this fiscal

RO drinking water units, mechanised laundry & outsourced cleaning activities to be introduced

94 paisa of every rupee earned is spent by Railways

Cleaning services to be outsourced to specialist agencies

Proposes automatic closing of doors before the train leaves platform.

Reservation system will be revamped & ticket booking through mobile phones and post offices popularised

Bio toilets in trains

To encourage corporates to adopt stations for improvement

CCTVs at stations would be used to monitor station cleanliness activities

Passengers can order food through sms/phone; severe action against vendors delivering unhygienic food

IVRS system for feedback on catering. Food courts at major stations

Proposes ready-to-eat meals from brands to be served in trains

Through PPP route, we want to provide foot-over bridges, escalators and lifts across all stations

Online booking will be made easier

See pension provision at ₹28,850 cr in FY15

See Plan outlay at ₹47,650 cr for FY15 | Scales down FY15 IRFC mkt borrowing to ₹11,790 cr

Better amenities and passenger services. Escalators and lifts through PPP

Estimate Passenger ticket sales at Rs 44,645 cr in FY15

Fare revision was a tough but necessary decision, Rs 8,000 crore of additional revenue will come

Fares, more investments in the form of FDI and private investment will ramp up railways

Expect to get total receipts of Rs 1,64,370 crore this year

Bulk of future projects to be financed via PPP route

Spent Rs18,400 cr on doubling 5,050 km tracks in 10 years | Had a surplus of ₹3,783 cr last fiscal

Seeking Cabinet nod to allow #FDI in Railway sector but not in railway operations.

Prioritising time lines to finish pending projects | Passenger earnings fell short by ₹968 cr vs Estimates

Recent fare revision to net ₹8,000 cr to Railways | Bulk of future projects to be financed via PPP route

Need ₹9 lk cr for funding Diamond Quadrilateral

Indian Railways spent Rs 41,000 crore on laying of 3,700 km of new lines in last 10 years

FY14 Gross Traffic Receipt at Rs 1.39 lakh crore | FY14 operating ratio at 94%; 6% is surplus

Require five lakh crore to finish ongoing projects

Four projects are 30 years old which are yet incomplete

FY15 Estimate for surplus seen at ₹602 cr

Propose FY15 market borrowing at Rs 11,790 crore

Managing the Railways takes most of our resources. We spend 94% of our earnings. Left with just 6%

Target to become the largest freight carrier of the world

We carry 23 million passengers a day, over 1 billion tonnes of freight every year

Railways will play a role in building a dynamic India

Related Readings and Observations

  • Will this Pre Budget Rally continues? So the Pre budget rally is here and last week nifty bounced off from the low and made a fresh all time high and currently closed at 7753. Also it closed above the Weekly 5EMA(High) which […]
  • Nifty and Bank Nifty Future March Overview – III Nifty and Bank Nifty turned to hourly charts on 4th march onwards currently the support zone comes around 6253 and 10837 respectively. Reverse the position to sell mode if the support zone […]
  • Motilal Oswal assigns 'buy' to ITC for target Rs 242 Motilal Oswal has maintained a 'buy' on ITC for a target price of Rs 242, an upside of 14 per cent to the market price of Rs 213 considered by the brokerage. ITC reported sales of […]
  • MCX-SX to launch FNO Trading in SX-40 MCX Stock Exchange (MCX-SX) today said it will introduce trading in derivative contracts on its flagship index SX40 .SX40 is a free float based index of 40 large cap - liquid stocks […]

The post Railway Budget 2014 Summary appeared first on Marketcalls.

Amibroker AFL coding – Photo Gallery

$
0
0
Click to view slideshow.

First of all I personally thank Mr Jagdish Ahuja(ATMA organizer) for providing oppurtunity and organizing this Amibroker AFL coding to make this event successful one. The event is less of PPT and more of a live afl coding event. Lots of like minded people in the crowd. Nice to meet all you guyz and thanks for coming down to listen us

Checkout the Amibroker AFL coding Presentation

Related Readings and Observations

The post Amibroker AFL coding – Photo Gallery appeared first on Marketcalls.

ZLEMA ATR Long Only Trading System – AFL code

$
0
0

ZLEMA ATR Long only trading system is a mechanical strategy for higher time-frames. The trailing stop loss is quite adaptive and adjustible in the down trends to revise it stoploss downwards on its own and the buy or sell decision is taken only at the end of the candle. visit here to know more about Zero Lag EMA indicator

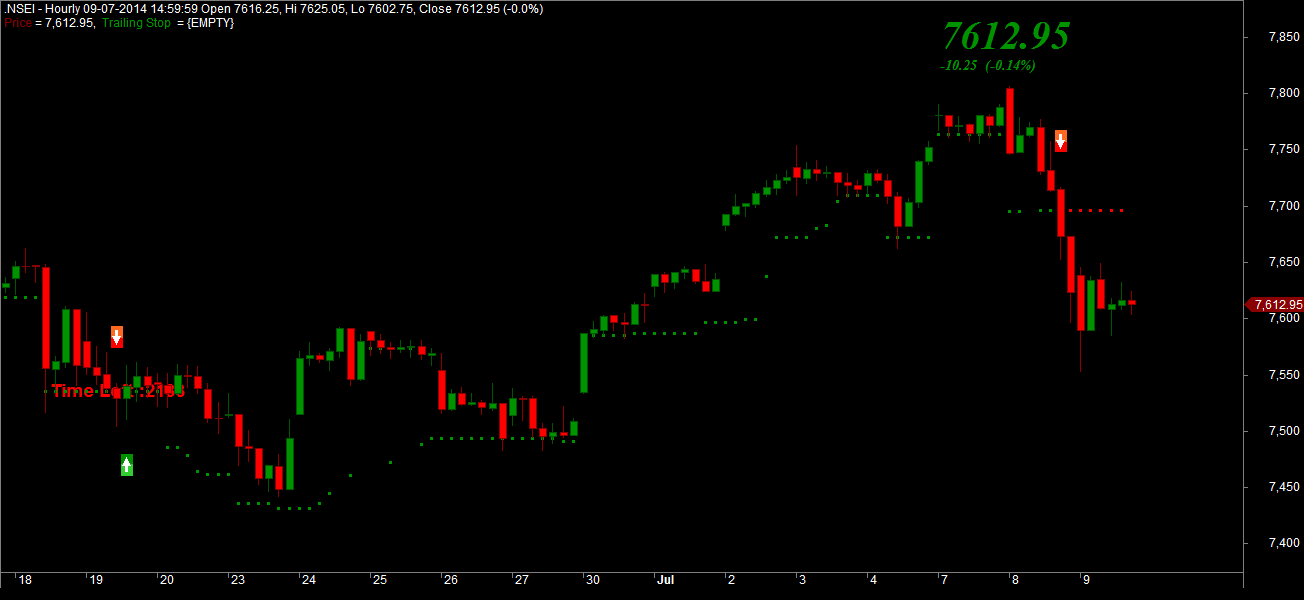
Nifty Spot Hourly Charts
Nifty Spot

Indications
1)The green line indicates trailing stop for longs
2)The Red line indicates trailing stop for shorts
3)The Green Arrow indicates longs
4)The Red Arrow indicates shorts

Features
1)Trailing Stoploss Lines
2)Buy/Sell Signal Added
3)Magnified Market Price at the right top corner
4)Timeleft counter to idenfity the end of the candle
5)Non Repainting – Arrows will form only after the end of the candle. No arrows will disappear once the signal formed.

Recommended Timeframes
Preferably higher timeframes like 30min,hourly.etc. Perfectly suits for positional traders who intersted in Long and Exit strategies. And moreover it is a carryforward strategy and not a intra-day strategy though. But work pretty good in high volatile environment.

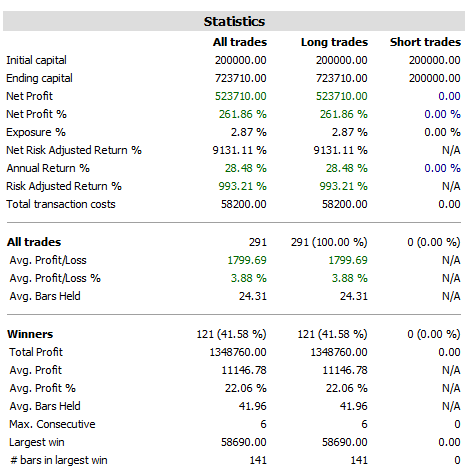
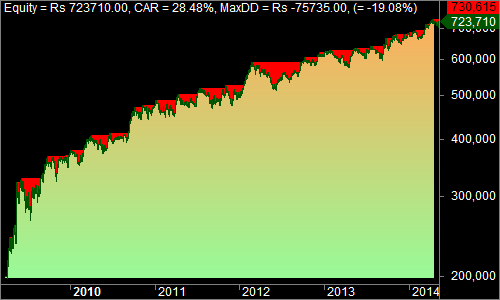
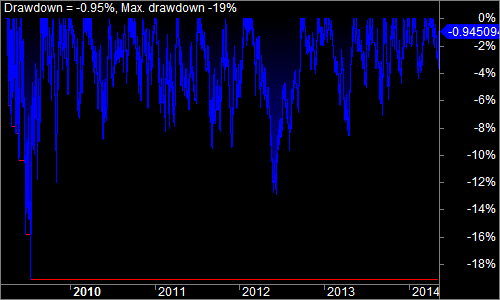
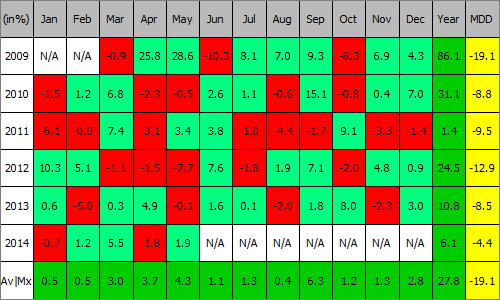
Backtest Results for Nifty Spot Since March 2009 to May 2014
Backtest Results
Tested with 2 lots of Nifty and with per leg brokerage/slippage of Rs100 included.

Equity Curve
Equity Curve

Drawdown
Drawdown

Profit Table
Profit Table

Steps to Install
1)Download ZLEMA ATR AFL code
2)Unzip ZLEMA ATR Trading System to local folder
3)Copy ZLEMA ATR.afl file to \program files\amibroker\formula\basic folder
5)Open Amibroker and Open a New Blank Chart
6)Goto Charts->Basic Charts and apply/drag-and-drop the ZLEMA ATR Trading System code into the blank chart
7)Bingo you are done. Now you will be able to see the ZLEMA ATR Trading System indicator with Buy and Sell signals.

Compatibility
Amibroker 5.5 and above

Related Readings and Observations

The post ZLEMA ATR Long Only Trading System – AFL code appeared first on Marketcalls.

Does the Union Budget gives boost to the Market?

$
0
0

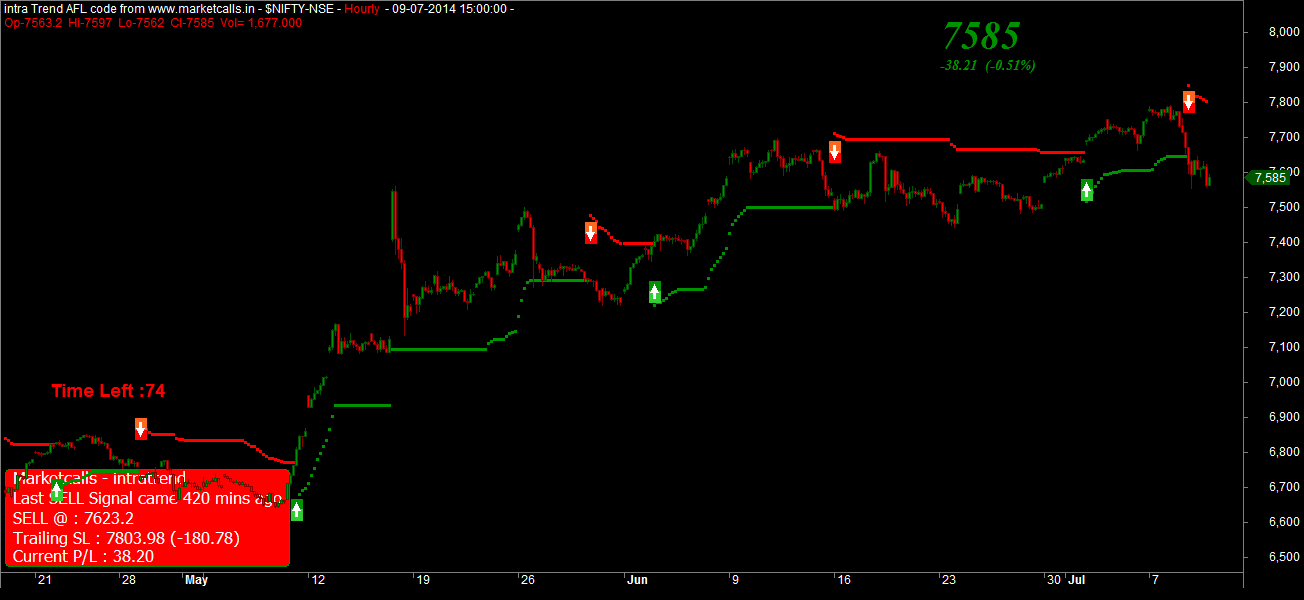
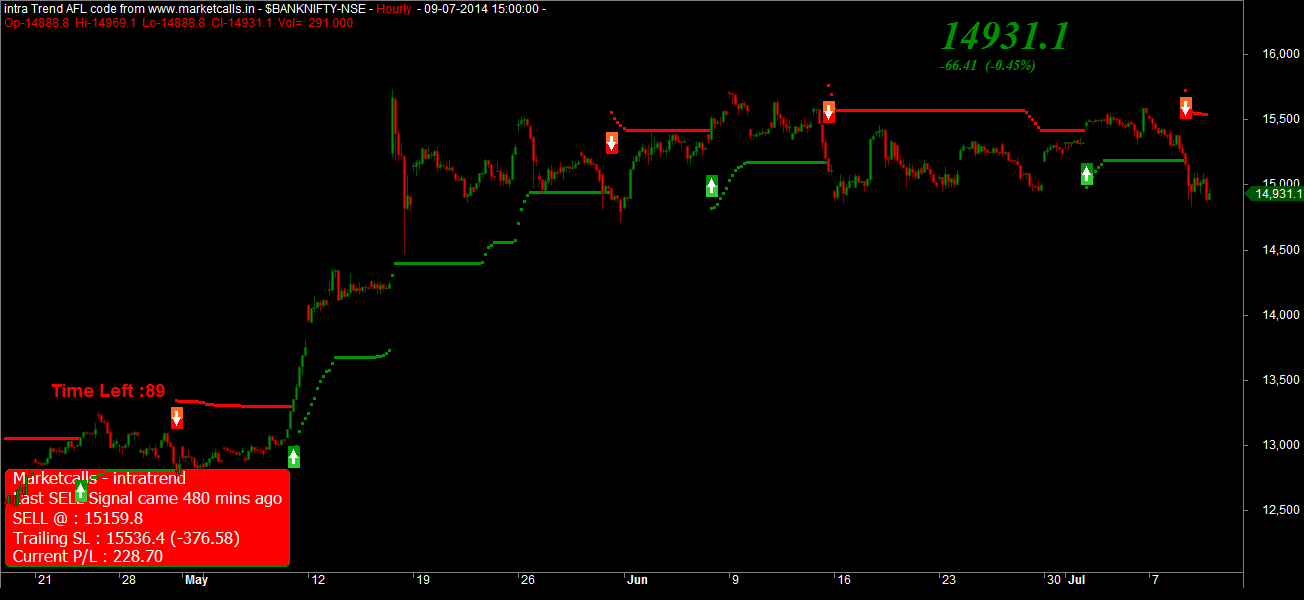
Railway budget brings a big disappointment in the stock market. Indices slipped from its all time high and nifty and banknifty currently trading around 7585 and 14931 respectively. Union Budget had set very high expectation amoung investors,traders, middle class people and industrialists.

Key Expectations

- Tax sops for the salaried people
- dumping of the controversial retrospective tax
- For boosting investment, tax incentives for industry
- gold import duty cuts
- road map for roll out of the Good and Services Tax(GST)
- The government may set up a price stabilisation fund
- Provide relief to farmers to help them tide over the impact of deficient monsoon

Nifty Hourly Charts
Nifty Spot Budget

Nifty and Bank Nifty hourly charts is currently in sell mode right from the railway budget event. Currently the resistance zone comes very close to 7803 and 15536 respectively. Reverse your position to positional buy mode if the resistance breaks on the hourly charts.

Bank Nifty hourly Charts
Bank Nifty Budget

India VIX hourly charts

India VIX very recently turned to positional downtrend which could probably result in lower participation in the nifty options market and currently the resistance zone comes around 20.26. Only a close above the resistance zone on hourly charts could fuel further momentum in the volatility index.

Indix VIX Budget

Nifty Spot Weekly Charts
Nifty on the weekly charts currently trading below 7683 5EMA(high) and currently the intermediate support zone comes around 7469 5EMA(low). A weekly close below 7683 could bring more weakness in nifty and any close above 7683 on weekly basis fuels further moementum in nifty and could take nifty towards 8000 levels.

Nifty Weekly Long term charts

Related Readings and Observations

  • Railway Budget 2014 Summary Railway Minister D.V. Sadananda Gowda presents the NDA government's maiden Rail Budget. Check out the long list of Raiway Budget 2014 summary.
  • Will this Pre Budget Rally continues? So the Pre budget rally is here and last week nifty bounced off from the low and made a fresh all time high and currently closed at 7753. Also it closed above the Weekly 5EMA(High) which […]
  • Nifty Trend for 23rd Jan 2009 Trend is negative with resistance at 2757.6 Source: www.marketcalls.in
  • Nifty Trading Notes on 18th July,2008 Nifty is not giving any clear until 1.p.m. See the EMA setup formed after 1.P.M which tell us to long the day.Where the candle surpasses above the 13 EMA which leads to buy signal in […]

The post Does the Union Budget gives boost to the Market? appeared first on Marketcalls.

Little Market Wizards : Jay Chandran – Market Profile Trader

$
0
0

Jay Nifty Wizard Trading World is filled with lots of exciting stories and not everyone in this world are successful. There is a saying that “95% of the traders loose money“. And everyone of us want to be a part of the remaining 5% and every trader takes necessary steps to ensure that he moves towards that remaining 5%. A common man learns from his own experiences while the sharper and wise men learn from the front runners.
So to help my very enthusiastic followers take a step ahead of others, I plan to interview successful traders across the globe so that we get to know the path they have traveled to reach that successful trader position. In this interview series, you can be assured to get an insight of their trading styles, discipline and models. I hope that this question answer session with successful traders will benefit my readers.

This time I am going to interview Mr.Jay Chandran (aka niftywizard) one of the top successful Market Profile trader from South India. He is a pure intraday trader and a very active person in social networking sites like Facebook and Twitter and people love him because of his information sharing nature.

Here is the question and answer series with him.

Jay Chandran, first of all I would like to say warm welcome on Marketcalls.

Rajandran, Its my pleasure to get interviewed on Marketcalls.

What makes you to get into the trading career. I know you are from engineering Background

Yes I did Btech Bioinformatics in Satyabama University and Iam a 2006 Passed out. I worked in Verizon as a test Engineer and later by 2008 I left my job to start trading as my full time career.

During my college days I used to stay in my cousins home here in Chennai where I met couple of my cousins friend who talks about stocks and stock markets which rose / fall that day.

I was little eager in understanding how to trade/invest in stock market. My cousins friend given me the profit/loss statements and he explained a little brief about how the stock market functions. So I was following him for couple of days to understand things better.

Did you started your trading during college days? When was your first trade?

During my college days I was just watching my cousin friend trading. Once he left the room I didn’t had a chance to see markets so left that time !!

After my college I was recruited by verizon as a test engineer . That time everyone in office used to trade. so I thought to put old learning now. During 2007 End I started my first trading.

For every trader their first trade set the tone for their career for me same thing happened. It was a CE option (I didn’t remembered which strike price) where my colleague asked me to buy . Without doing any analysis I bought that option for 10000 rs premium. During that time I even even dont know where to keep a stoploss or where to book the profits.

My Colleague told to buy I just bought . Later two days the total Rs10000 premium gone down to Rs900. Then I asked him “what to do now” as the value of my account gone to 900. he said “it not worked book your losses”. I booked @ loss with Rs900 left in account.

Then my brother told me to buy a Put option for that remaining Rs900 which was trading around Rs15. After taking the trade my trading account reached Rs8000. That was the sparking moment in my trading career this is where I thought to leave my job and start digging markets little more deeper. Its started all here after this trade.

And I had taken a payout of Rs8000 and left 500 in account which I bought a stock named Visu international around 9 rs and left it.

What make you to turn as a professional trader?

Passion first , then the profitable factor in trading ! Everyday market puts you in test only a trader with good mindset and continuous learning can overcome day to day test. I feel my passion towards trading and Learning new stuff every day put me at this place.

And What are the Tools/Studies you are using currently? How much you are spending on your trading infrastructure

I am currently using Market delta & Amibroker right now for my Market profile studies and Esignal for Datafeeds. Every month i use to spend merely around Rs20,000 rupees (includes Software, Datafeed, Internet) as i feel right tools are the key to run your trading as a business. Currently most of the Software, Datafeeed cost is paid in USD. And the pricing is highly volatile due to USD-INR movement. And there is not good datafeed provider in India with eSignal quailty. It would be great boon for traders like me if people in India are coming up with such solutions.

What are the tools you initially adopted in Trading and Why you shifted your studies to Market Profile?

As every trader at initial stage of my career I ran for so called readymade Afl Trading systems and day by day used to jump from one system to system. Then I thought by this way I am not going to make anything in trading. only it can lead to collection of fancy afl’s :) There are tons of ready made trading systems which have simple concepts but sold for higher price.

Those days I used to register in every trading forum. Int the Trading Laboratory forum I found a thread named market profile where everyone giving their interest. there was a stmt ” Market profile is been used by institutions “ which pulled my interest towards it. Then I started digging deeper into market profile. Thats how my professional career in trading starts.

Apart from Market Profile do you use any other studies for your Buy or Sell Decision?

I generally stick to price action studies as my secondary confirmation for any trigger which Market profile throws.

Did you tried fundamental analysis in your trading career?

yep I traded one fundamental call with my own self analysis. Don’t laugh it was just too fundamental when I picked it. The stock was Jublilant foodworks and it was trading around Rs400. By that time lot of pizzas where consumed and lot pizza shops where setting up all over the country. Then I thought this stock will hit 1000 plus in next 2 years due to their sales. I bought it around 430. but luckily it went to Rs1000 in just few months and where i sold the stock. I should say, I am lucky as move happened very quick.

As a Professional Intraday trader how do you manage risk in your trades?

I give more weightage to index trades on my trading. Always I go for intra trades which have 1:1 Risk reward. what I do usually is I always book partial profits i.e 50% on my intial quantity for 1:1 reward. Then ride the rest with moving trailing stoploss to cost. By that way ensure that I am not gonna give anything back to markets as well as to my broker.

What is the worst case scenario you face so far in your trading career?

The worst case was the first trade that gave me all the lesson what I should not do being a trader. Its rather good to focus on your studies and take a decision rather than depending on someone else.

When I started trading full time few years ago there was sudden dip during intraday where I was just freeze & not able to take decision to cut down my position or not. I could be a severe loss if i booked it out but luckily market bounced back from the lows. Then I noted in my trading diary take positions till it doesn’t hurt your trading capital even in a worst case scenario.
Also from that day I started book partial profits.

What are your future plans?
To trade for an institution and help newbie traders what not to do in this markets.

What is the general mindset of today’s newbie traders?

They want very quick money. They want a black box system which they think it should be an ATM for them . Worst thing is they go broke in their mindset when they saw some loss.

What advice would you give to non-professionals who would like to start trading?

If you dont have a family business don’t leave your job . Just start learning trading after office hrs . Try to start trading higher time frame signals initially then you can learn to trade lower timeframe signals. Learn how not to make losses rather than how to make profit.

Before finishing this interview i would like to add a quote “If you cannot make money with $100 what in the world makes you think you can with $100,000. it will only be 1000 times worse.”

Thanks Jay for your Brief interview. My Best wishes for your future plans and Would like to do a deep interview in the future.

Related Readings and Observations

The post Little Market Wizards : Jay Chandran – Market Profile Trader appeared first on Marketcalls.

Union Budget 2014 – Simplified Infographic

$
0
0

Union Budget is over now check out the Infographic has been created by futureadvisor.in and it gives a simplified insights of this Union budget2014.

Budget2014-Simplified-Infographic

So how do you rate this Budget 2014. Put your comments here.

Related Readings and Observations

  • Does the Union Budget gives boost to the Market? Railway budget brings a big disappointment in the stock market. Indices slipped from its all time high and nifty and banknifty currently trading around 7585 and 14931 respectively. Union […]
  • Railway Budget 2014 Summary Railway Minister D.V. Sadananda Gowda presents the NDA government's maiden Rail Budget. Check out the long list of Raiway Budget 2014 summary.
  • Will this Pre Budget Rally continues? So the Pre budget rally is here and last week nifty bounced off from the low and made a fresh all time high and currently closed at 7753. Also it closed above the Weekly 5EMA(High) which […]
  • Gold Vs Bitcoin Comparison : Infographic Which one will be consider as the alternative currency Gold or Bitcoin in the future? Will a physical gold will be the future currency or the virtual currecy like bitcoins. The following […]

The post Union Budget 2014 – Simplified Infographic appeared first on Marketcalls.


Nifty and Bank Nifty – Post Budget Outlook

$
0
0

Nifty Hourly charts
Nifty Spot

Nifty and Bank Nifty on the hourly charts maintained the positional sell mode currently the resistance zone come around 7808 and 15452 respectively. It should be noted that there was a clear divergence between nifty and bank nifty as nifty was making high in the past bank nifty was lagging and unable to break the newer highs. Reverse your position to positional sell mode if the resistance zone breaks on the hourly charts.

Bank Nifty Hourly Charts
Bank Nifty

India VIX Hourly charts

India VIX on the hourly charts maintains the positional sell mode and currently the resistance zone comes very close to 18.78 respectively. Reverse your position to positional long if the resistance zone breaks on the hourly charts.

India VIX

Open Interest Build up

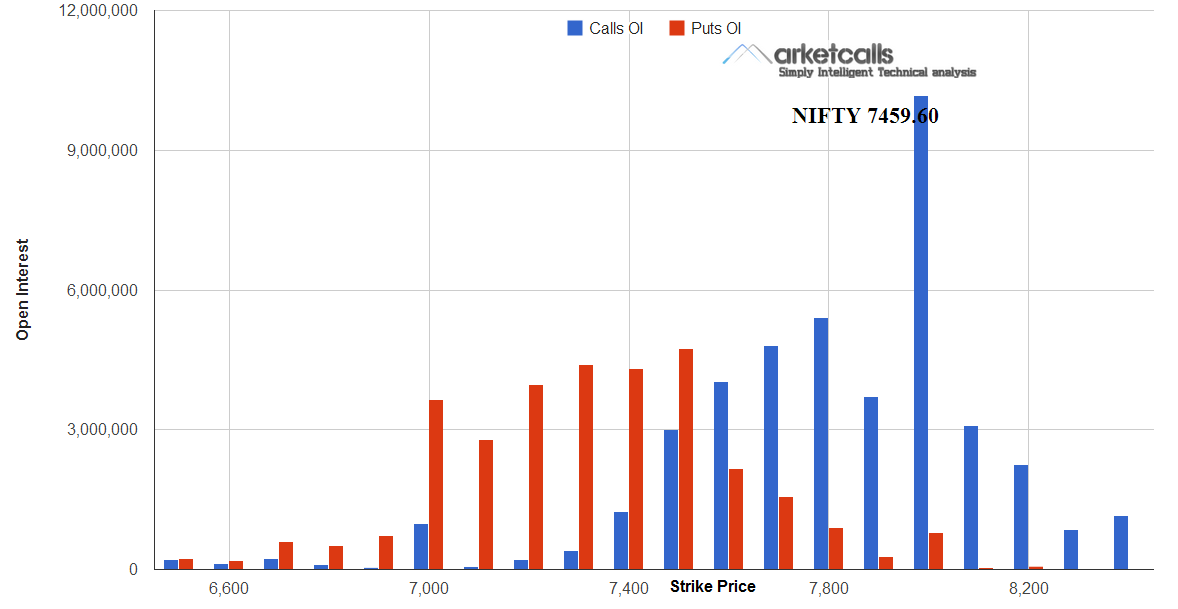
It should be noted that open interest built up in 8000CE strike price crossed the 1 crore mark. Active call writing seen in 7800CE and 8000CE. Options writes are betting that nifty will close below 7800 for the current option series.

Open Interest

Exchange Turnover
Most of the exchanges Shows a improved turnover due to high participation in the market. And NSE FNO on the union budget day recoreded a highest turnover of 4.4 lakh crores.
Exchange Turnover

Related Readings and Observations

  • Newbie Traders feels the Euphoria got Burst And the traders whomever traded one sided fashion could have busted in this volatile market which fizzle out the weaker hands. Market once again given a sign that the market is much […]
  • Nifty and BankNifty Fires before Election Results Nifty on the hourly charts turned to positional buy mode yesterday with a whooping 2.98% and currently the support zone comes around 6684. And Banknifty which is currently outperforming […]
  • Nifty and Bank Nifty Hourly Charts May 2014 Overview Nifty on the hourly charts is in sell mode since 29th April 2014 and currently the resistance zone comes around 6766. However on contrary Banknifty still maintaining the positional buy […]
  • Nifty and Bank Nifty Hourly Charts Overview Nifty hourly charts is in positional sell mode since 28th April and currently the resistance zone come near 6845. However Banknifty on the hourly charts still manage the positional buy […]

The post Nifty and Bank Nifty – Post Budget Outlook appeared first on Marketcalls.

PIN Bar detector – Amibroker AFL code

$
0
0

Pin Bar Detector – (Amibroker Indicator) is pin bar pattern detection system inspired for Earnforex – Pin Bar Detecor mql4 code. Pin Bar is a bar with a long upper or lower “tail”, “wick” or “shadow” and a much smaller “body” or “real body”, you can find pin bars on any plain candlestick chart. The Pinbar (also known as “Pin-bar” or “Pin bar”) pattern was first introduced by Martin Pring in his Pring on Price Patterns.

pinbar

It is a pure price action based indicator and in this indicator marks the bullish pin bar and bearish pin bar on the charts and also one scan use the exploration to find out the pin bar patterns from the list of stocks.

Recommended Timeframe
Higher timeframes like Hourly, 4 hourly, Daily, Weekly timeframes

pin-bar-trading-strategy

Bullish Reversal Pin Bar Formation

In a bullish pin bar reversal setup, the pin bar’s tail points down because it shows rejection of lower prices or a level of support. This setup very often leads to a rise in price.

Bearish Reversal Pin Bar Formation

In a bearish pin bar reversal setup, the pin bar’s tail points up because it shows rejection of higher prices or a level of resistance. This setup very often leads to a drop in price.

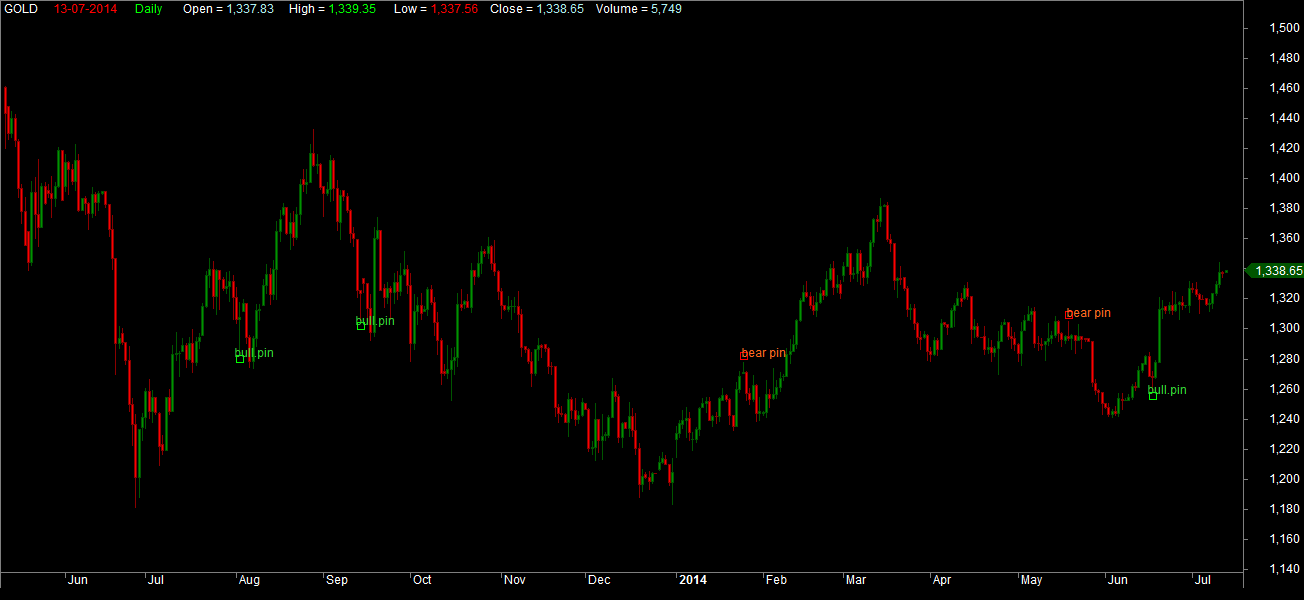
Pin Bar Patterns in Gold Daily Charts
Pin Bar Detector

Input Parameters for Pin Bar

MaxNoseBodySize (default = 0.33) — maximum allowed body/length ratio for the Nose bar.

NoseBodyPosition (default = 0.4) — Nose body should be position in top (bottom for bearish pattern) part of the Nose bar.

LeftEyeOppositeDirection (default = true) — tells the indicator that the Left Eye bar should be bearish for bullish Pinbar, and bullish for bearish Pinbar.

NoseSameDirection (default = true) — tells the indicator that the Nose bar should be of the same direction as the pattern itself.

NoseBodyInsideLeftEyeBody (default = false) — tells the indicator that the Nose body should be inside the Left Eye body.

LeftEyeMinBodySize (default = 0.1) — minimum size of the Left Eye body relative to the bar length.

NoseProtruding (default = 0.5) — minimum protrusion of the Nose bar relative to the bar length.

NoseBodyToLeftEyeBody (default = 1) — maximum size of the Nose body relative to the Left eye body.

NoseLengthToLeftEyeLength (default = 0) — minimum Nose length relative to the Left Eye length.

LeftEyeDepth (default = 0.2) — minimum depth of the Left Eye relative to its length. Depth is length of the part of the bar behind the Nose.

Note : This strategy doesnt detects a perfect pin bar however some manual intervention is necessary to spot pin bar patterns accurately

Steps to Install Pin Bar Detector Afl Code
1)Download PIN BAR Detector afl code
2)Unzip Pin Bar Detector.zip to local folder
3)Copy PIN Bar Detector.afl file to \program files\amibroker\formula\basic folder
5)Open Amibroker and Open a New Blank Chart
6)Goto Charts->Basic Charts and apply/drag-and-drop the Pin Bar detector code into the blank chart
7)Bingo you are done. Now you will be able to see the Pin Bar Detector indicator with Buy and Sell signals.

Referrence
Pin Bar Trading System – Earnforex
Characteristic of Pin Bar formation – Learn to Trade the Market

Related Readings and Observations

  • VBA Macro to Download Bhavcopy Here is a initiative from me to automate the NSE EOD data in ASCII format using simple VBA Scipts in MS Excel. The following MS Excel VBA macro copies the Getbhavcopy zip file […]
  • Marketcalls @ Nokia Ovi Store A Simple Marketcalls Apps now available for your Nokia Smartphones @ Ovi Store for free download. Just Experience it
  • The Death of 25 Paisa From June 30 2011, 50 paise will be the minimum coin accepted in the markets as all denominations below it will cease to be legal currency. Also, the entries in books of accounts, pricing […]
  • Market future movements and The next big thing : Reliance industrial infrastructure   Market outlook-Global markets, FII inflow and quarterley numbers will dictate trend on the domestic bourses in the coming days.Results will continue to pour heavily next week as […]

The post PIN Bar detector – Amibroker AFL code appeared first on Marketcalls.

Things you need to know before buying PAID indicators

$
0
0

As a trader almost everyone of us who are in the phase of “the search of holy grail” could have tried exploring the so called PAID indicators and often ends with wrong indicators which has no edge in the market. Probably 98% of the PAID indicator providers are snakeoil vendors who polish a open source code by changing the color of the indicators and some little tweaks in the codings and parameters and present it as a colorful, exotic future forecasting stuff by guaranteeing enormous amount of returns (Most of the times it beats Warren Buffets CAGR record).

snake-oil

If you are still in the stage here are some of the ways where you can protect yourself from end in wrong hands

1)Ask the PAID indicator provider to provide backtest report for the past 5 years for your favorite instrument which you are willing to trade. Most of the snakeoil vendors dont even have enough data.

2)Take a Demo of the PAID indicator and backtest yourself (or ask him to backtest in-front of you) across your favorite timeframes you are willing to trade. Make sure you are adding all the trading cost(Brokerage, Slippage, Turnover Charges…etc). Most of the cases the snake oil vendors doesn’t have enough skill to do even a simple backtest.

3)Observing a trading system live for 3 days or a month will not going to help you to fully understand the nature of the trading system. And if you are going to judge the system based on the short span results of-course you are making a big mistake.

4)If the PAID indicator provider is going to backtest only for the past month with 15 or 20 trades and claiming more than 75% winning ratio and probably you insist him to provide results for last 500 trades or last 1000 traders. Only observing a huge number of trades can give you an overall idea of the trading strategy performance across different style of markets(Bullish,Bearish, Sideways) and its riskiness involved in trading it.

5)If the PAID indicator provider is showing your only the snapshots of the indicator which shows that it predicted the future perfectly then you have the repeat the steps 1-4 again. Most of the cases if he is guaranteeing you a sure shot returns after trading his system then most probably he is a snake oil vendor.

6)The one who is not speaking about losses or risk involved in a trading system is a snake oil vendor. Neither you are not interested in understanding the risky nature of the trading system nor the PAID indicator provider doesn’t want to reveal you the risk involved or dont have sufficient knowledge to explain you the riskiness in the trading system.

7)Its quite easy to figure out a snake oil vendor who generally show various charts that made huge profits with their contact numbers embedded over the charts.

8)Now there are enough snake oil vendors entering into the Algo trading segments as newbie traders feels the algo trading can be the real money making machine as it can forecast better than him. He feels he can sit back and relax , do shopping ,concentrate on his day job or attend family functions during trading hours. Which is ideally not going to be that easy unless you have enough experience with Statistics, Programming, Understanding the nature of Market dynamics and of course Trading Experience.

If you have any other snake oil vendor prediction mechanism you can write it down here :)

Related Readings and Observations

The post Things you need to know before buying PAID indicators appeared first on Marketcalls.

Copper technical analysis – Time to sell?

$
0
0

Copper (15.07.2014) moved higher in last few weeks & topped 7211 on LME.

Now copper is trading around 7120 area on London Metal Exchange & as we can see on charts , with a top (probably false) above the tradeline copper trimmed its rally & looking for some downside move ahead. A number of doji, shooting star etc says that trend is slowing down now.As we see on charts the top placed was almost at 161.8% feb correction level & after that we have witness some negativity on indicators too.

On fundamental side, not much appreciating news from world economy & continue global tension may reduce the industrial metal demand while inventory are still on higher side.

copperdaily
Based on above studies, we will prefer to sell copper for possible targets around 6980 & then 6840 in coming weeks, while a day close above 7240 will force us to reanalyze the charts.

The post Copper technical analysis – Time to sell? appeared first on Marketcalls.

The 7 Golden Principles of Stock Selection

$
0
0

A seasoned investor has to invest time and effort into evaluating the real value of a stock. Making a wise and informed choice has a lot to do with a holistic research and trend analysis of the particular company that is being considered as a possible investment. These 7 principles of stock selection help you in making wise choices in the stock trading world.

stocks

When investing in stocks, it is essential to consider certain parameters before taking the plunge. Making a wise and informed choice has a lot to do with a holistic research and trend analysis of the particular company that is being considered as a possible investment. Let’s call these parameters the 7 principles of stock picking. And these are-

1) Price and Performance :  This parameter helps analyzing the current technical levels of the company by looking at the current and past price movement and the stock’s performance in weekly and monthly charts.

It includes the major high and low points the stock made in the past, such as:

  • 52 Week high/Low or life time high/low
  • Average daily volumes for the last 20 days.
  • Average daily movement (ADM).
  • The percentage of shares pledged by the promoters.

2) Product/Service : This criteria includes the study of the company’s profile and it’s main line of business. It helps the investor to understand the business model of the company and the products and services it has to offer. It gives an idea of the company‘s business activity to the investor. And it is always good to know what you are working with. You shouldn’t invest in a company whose work you don’t understand.

3) Profitability : This factor studies the performance of the company over the years and quarter on quarter (QoQ) by looking at its sales, net profit, earnings, and any other exceptional items thus allowing the investor to understand the past and current performance of the company and reasons behind increase/decrease in its revenues.

4) People : This part of the strategy allows the investors to study:

  • the current management
  • share holding pattern of the company
  • Percentage of FII /DII investments in the stock over Year on Year(YoY) and  Quarter on Quarter(QoQ).

The increase and decrease in FII’s or DII’s is a very important factor as it gives a clear indication of the demand of the stock in the market.  Studying investors holdings of more than 1 % stake in the company (apart from promoter holdings) gives an idea if any High Net worth Individual (HNI) or some big fund house has a stake in the stock. This adds credibility on the returns of the stock.

5) Peers : The word Peers is self explanatory as a competitive analysis of other companies within the sector adds more clarity to the picture. Studying the market capitalization, sales, profit margins, earnings, market share and the returns of its peers has gives a snapshot of the various players in the market and helps the investor understand the sector he/she is investing in.

6) Philanthropy : Most of the leaders of successful organizations give weight to the ideology that to attain long term success, it is necessary to have some genuine social responsibility. Studying a company’s philanthropic activities can also give an insight into the overall financial health of the organization.

7) Prospects : This is the last and most important part of the strategy as it indicates the future potential of the company. Studying the future aspects of the company and its sustainability in the market is crucial to stock selection. These include directors / management reports, annual reports, future orders, current overall performance, any current or future news updates, bulk &block deals, strengths and growth of the firm.

Therefore, with the help of this strategy one can understand the company’s past, current and future workings in a snapshot and allow the investors to take better and informed decisions.

Related Readings and Observations

The post The 7 Golden Principles of Stock Selection appeared first on Marketcalls.

Nifty Elliott Wave Short Term and Medium Term View

$
0
0


Nifty short term view


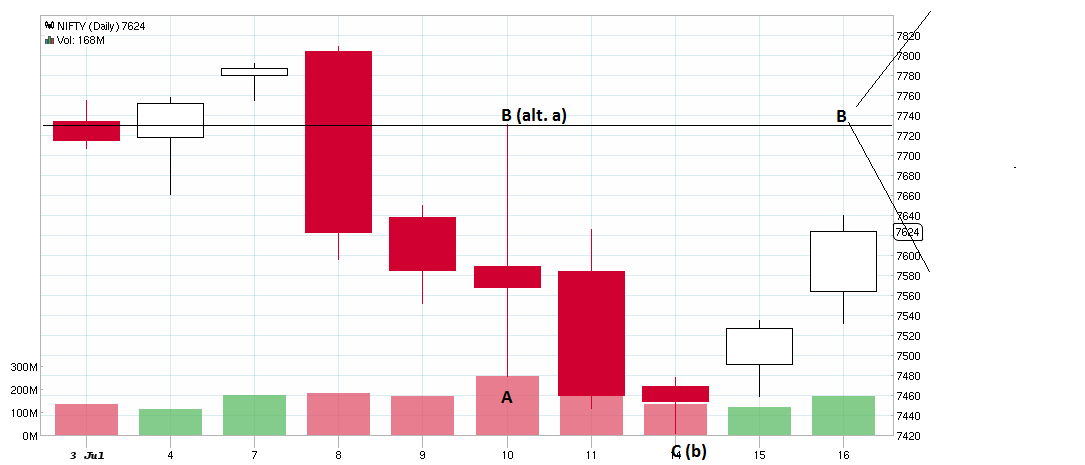
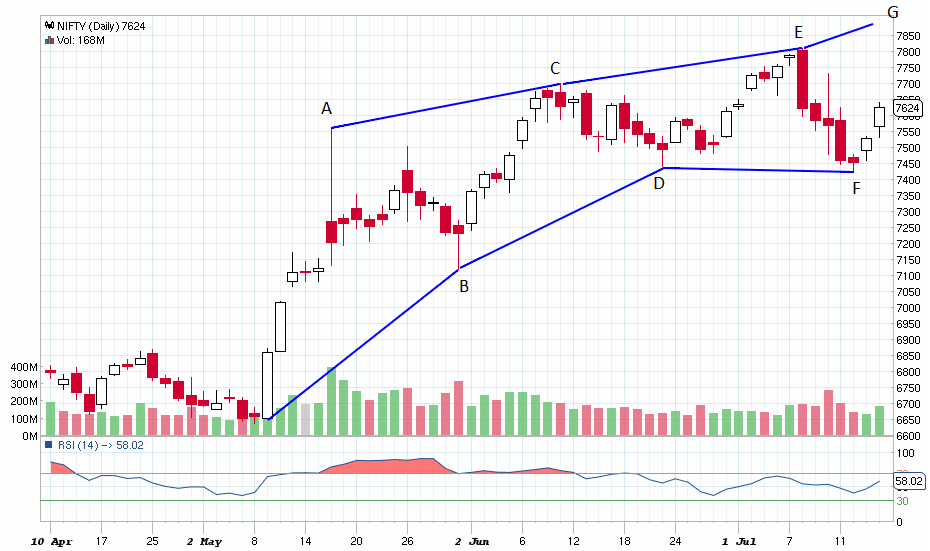
Next 2 sessions will be critical for nifty. Strength above 7730 is likely to open higher levels like 7920-8000.. On the other hand, if nifty weakens below todays low of 7532,we may see 7300. wave counts are depicted in the chart and alternate counts are in the bracket.

NIFTY_Daily_16-07-2014 (1)


Nifty could possibly be making a diametric as depicted in chart. therefore strength above 7730, likely to take market to 7920-8000 to complete G leg. And after that once again correction is likely..


NIFTY_Daily_16-07-2014 (2)


Nifty medium term view


At 7920-8000 Nifty is likely to complete 3rd wave and possibly making 4th towards 7300 for next 2 months.
NIFTY_Daily_16-07-2014
 

Disclaimer- Elliott waves to be effective,should be used with other studies Like supertrend,SAR. If markets are hinting towards some other possibility, then one needs to rework on wave counts.

Related Readings and Observations

  • Nifty – Probable Flat Formation As we can see in the daily chart,If we label 6342 (3 Nov 2013) to 5972 ( 22 Nov 2013) as wave A, gradually wave has to be labeled at 6415 (9 Dec 2013). The C wave has been confirmed when […]
  • Medium Term View Of Indian Equity Markets The Nifty is presently in minor wave 5 of Intermediate wave  (1) of Primary wave  (I) of a new cycle which started in March 2009.  It completed minor wave 1 at 4693 in June 2009, followed […]
  • Does Shorting Favors Nifty and Bank Nifty Traders? On the Weekly charts Bank Nifty turned to long term sell mode and nifty still trading below 5EMA(High) and nifty still holds the long term buy mode. Currently the long term resistance zone […]
  • Nifty and Bank Nifty – Post Budget Outlook It should be noted that open interest built up in 8000CE strike price crossed the 1 crore mark. Active call writing seen in 7800CE and 8000CE. Options writes are betting that nifty will […]

The post Nifty Elliott Wave Short Term and Medium Term View appeared first on Marketcalls.

Does Shorting Favors Nifty and Bank Nifty Traders?

$
0
0

Nifty Hourly Charts
Nifty Spot

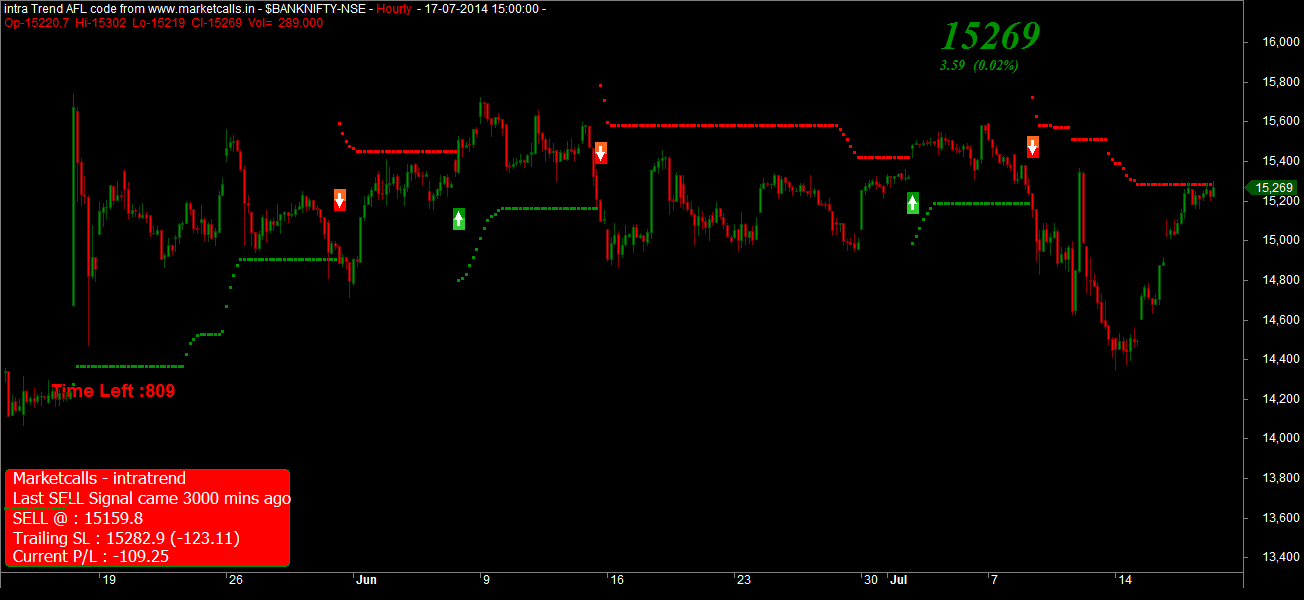
Nifty and Bank Nifty hourly spot charts maintains the positional buy mode right from the railway budget 2014 event. Currently nifty and Bank Nifty trading very close to the resistance zones comes around 7719 and 15282 respectively. Reverse your position to positional buy mode if the support zone breaks on hourly charts.

Bank Nifty hourly charts

India VIX Hourly

India VIX Hourly Charts

India VIX maintains the positional sell mode since the railway budget and currently the resistance zone comes near 17.14 Reverse your position to positional buy mode if the VIX levels breaks the resistance on the hourly charts.

Bank Nifty Hourly Charts
Bank Nifty

Nifty Weekly Charts
Nifty Weekly Charts

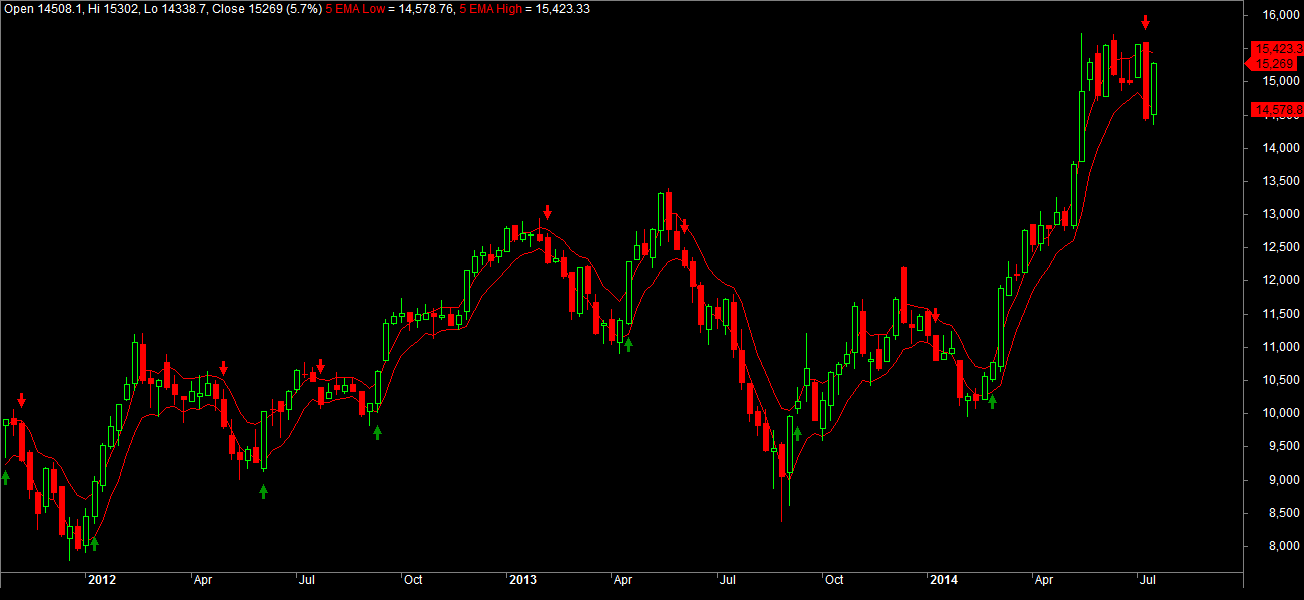
On the Weekly charts Bank Nifty turned to long term sell mode and nifty still trading below 5EMA(High) and nifty still holds the long term buy mode. Currently the long term resistance zone for Nifty and Bank Nifty comes around 7677 and 15423 respectively. Reverse your position to fresh longs if the long term zone breaks on the weekly charts.

Bank Nifty Weekly Charts

Related Readings and Observations

  • Nifty and Bank Nifty June Expiry Overview Nifty and Bank Nifty maintains the positional sell mode with resistance zone coming around 7673 and 15569 respectively. Reverse your position to positional buy mode if the resistance […]
  • Increased Volatility and Flipping Option Writers Market fallen down 100+ points and once again there is a flip in open interest 7600CE and 7700CE writers taken advantage by building higher open interest. There is a confused state among […]
  • Call writers take advantage post IIP results Industrial production grew at 3.4 per cent in April after contracting for two months in a row mainly due to improved performance of manufacturing, mining and power sectors and higher […]
  • Will the Volatility in the Market Increase? Indiavix on the hourly spot charts is in positional Buy mode with supports coming around 15.22. Reverse your position to positional sell mode if the support breaks on the hourly charts. […]

The post Does Shorting Favors Nifty and Bank Nifty Traders? appeared first on Marketcalls.


10 Rupee Coins to be issued on Diamond Jubilee of Coir Board

$
0
0

10 rupee coin

Coir Board, which has been engaged in activities of turning coconut fibres in to the money yielding ‘golden fibres’ enters into sixty years of service. When Coir Board came in to existence in 1953 started in Kerala and currently stretched over 14 states and the Board have selling counters all over India.

To Commemorate Diamond Jubilee of Coir Board the Reserve Bank will soon put to circulation Rs 10 denominated coins on the occasion of diamond jubilee of Coir Board. “The Government of India has minted the above mentioned coins which the Reserve Bank of India will shortly put into circulation.” the RBI said in its press release yesterday.

RBI said the details regarding design, shape of these coins have been notified in the gazette of government of India, dated February 20, 2014.

“These coins are legal tender as provided in The Coinage Act 2011. The existing coins in this denomination shall also continue to be legal tender.” – the press release said.

Related Readings and Observations

The post 10 Rupee Coins to be issued on Diamond Jubilee of Coir Board appeared first on Marketcalls.

Zinc – Major Reversal Chart Pattern in Forming.

$
0
0

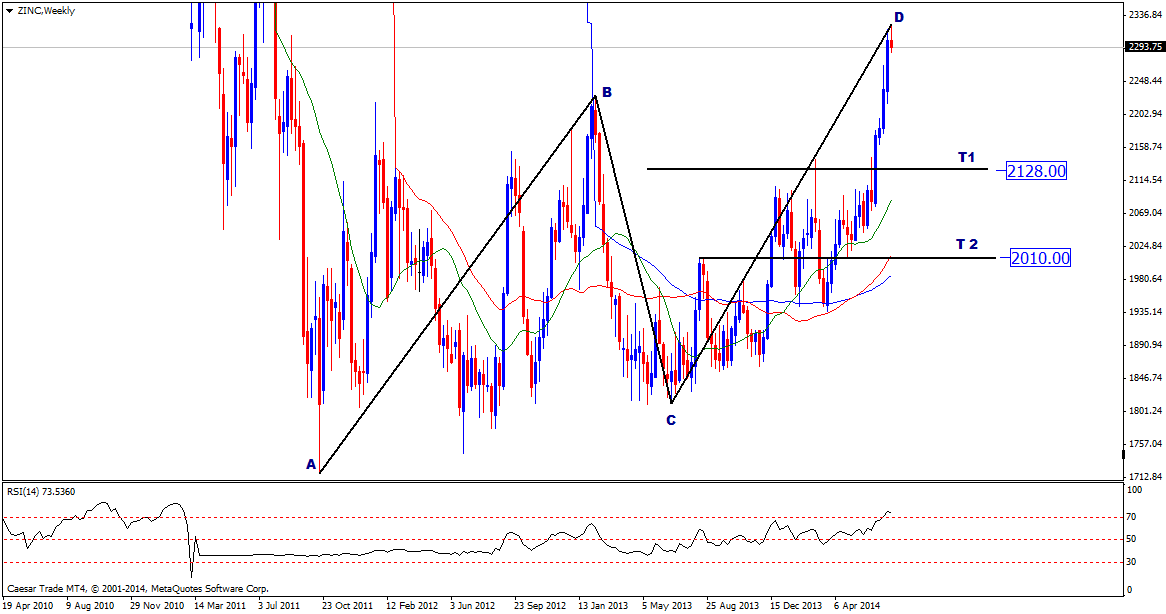
Zinc (18.07.2014) given major upside movement in last few weeks & probably its time for reversal.

Now zinc is trading around 2290 on LME & as we can see on weekly chart, there is a strong probability of an ABCD reversal pattern. If we look at daily chart , we find some reversal candlestick pattern also as well as indicators trading in over bought zone. We also witness a 261.8% feb correction just above the ABCD pattern finishing line. We probably use it as stoploss.

On fundamental side , mix global cues & fair level of inventory showing no rush move ahead.
zincweekly

Based on above studies, we will prefer to sell zinc for possible targets around 2128 & then may be 2010 in coming weeks. A day close above 2380 will force us to reanalyze the charts.

The post Zinc – Major Reversal Chart Pattern in Forming. appeared first on Marketcalls.

Nifty Future Report – Weekly View – 21st July 2014

$
0
0

Nifty Future Hurdle 7710
Resistance at 7750 7800
Supports 7645 7615

Nifty Future Report

 Nifty Future Daily Chart.


Technical Update: Nifty Future breakout from a rising wedge and made lows of 7445 this past week and made the Intraday high of 7692 and closed the week at 7669.35. For week starting Monday 21 July 2014 Nifty Future Will face stiff Hurdle at 7710 once sustain this level expect a rally towards 7750 7800 in coming days. The support for market is at 7645 7615. The 50 day SMA is @ 7489

Price: Price closed strong, with an outside bar bullish reversal pattern on daily charts. Also the price is just facing resistance around the trend line. Nifty Future is positive on daily , weekly and monthly time frames.

RSI : 14 day RSI is @ 57.38 the same bounced from 44.38 levels this past week. (Positives) From chart above its clearly seen the previous trend also took support at 46.13 (14 day RSI)  and trend continued upward to life time high’s for Nifty future. On 8th July Nifty Future Made all time high’s but there was a divergence in RSI the price made all time high’s but the momentum indicator made lower high’s hence there was a correction indicated.

Trend : Short term, medium term, primary trend are up with strong support at 7615 Levels. Till this level holds close base for the month the short term trend is up. The dips shall be bought.

Volume : The volume expanded thou on rally’s this past week but has been low as per average volume. Sign of been cautious at higher levels. Avoid making higher exposure’s.

Trading Strategy : Intraday trader’s be buyer’s in dips till 7645 with a protective stop of 7615 below sustain(or close) for upside targets of 7750-7800, Bear’s will be active once Nifty close below 7615. The trader’s carrying longs from previous week can book profits partly around hurdle 7710 once and modify there stops to 7615 for the remaining position.

Related Readings and Observations

  • Bihar Tubes to evaluate fund Raise options Script : Bihar Tubes CMP : Rs 161 Target : Rs 200   Bihar Tubes Expansion Plans :   As you know, the steel industry is passing through a very good phase all over the […]
  • ETC Networks:-The scrip with multibagger potential   "BUY IT NOW"The scrip was recomended by me at 150rs and from there it hit a high of 375rs.Target was acheived butdue to the market volatility its presently quoting at […]
  • Trin Declines from 1 strongly TRIN declines from 1 shows easing of negative sentiment.Market also comeback after a strong bounceback from 4359 levels. Now the buy signal continues. Also the minimum criteria for the […]
  • Things You Need To Know About Virtual Credit Cards There are several mean of keeping your online transaction safe and secured, although it is not really safe when payments are being made to sites, that could be insecure. In order to […]

The post Nifty Future Report – Weekly View – 21st July 2014 appeared first on Marketcalls.

Small Banks and Payment Banks Explained

$
0
0

A Brief Overview On Small Banks And Payment Banks

The reserve bank of India has recently announced the draft guidelines on two new types of banks. To achieve the financial targets of the government plans of launching small banks and payment banks are underway. The primary aim of launching these banks is to provide credit to the poor and help the marginal farmers improve their financial condition. As per the guidelines financial services will be provided to that section of Indian population who do not access to a bank. It is being planned that small banks will be operating in specific areas while payment banks would be mobilizing deposits.

RBI

An insight into payment banks

In the near future, payment banks would be providing small savings to households with low income and the migrant labours. However, payment banks will not be able to carry out lending activities. RBI has stated that among applicants who wish to set up the payment bank preference will be given to those who will set up access points of the payment bank in under-banked states. As per the draft guidelines payment banks will have to invest all the money in government securities. They will be allowed to keep some amount of money in the vault in order to meet customer requirements. You will need at least a capital of Rs.100 crore to launch the payment bank.

A small bank model

Small banks which are being launched will provide credit to both small enterprises and agricultural services which are located in under-banked areas. Most of the lending activities will cater to small enterprises and farmers where the loan amount is less than Rs.25 lakhs. All regulatory requirements such as SLR and CRR will have to be kept up to by the small banks. As these two new categories of banks have low-entry barriers, they will catch the attention of several promoters.

Operating in remote areas

The main goals of launching these differentiated banks are financial inclusion. According to the plans, payment banks will have their access points in remote areas of the country which do not have banking facilities. These banks will have a wider network either trough their bank branches or through business correspondents. With RBI releasing the draft guidelines of these niche banks, several companies are turning their dreams into reality. They had been harbouring ambitions of entering the banking industry. As doors open for the niche banks, these companies are making a grab for licenses.

According to draft guidelines

After the plans of these two differentiated banks have been announced by RBI according to the draft guidelines promoters will have to contribute 40% while setting the bank up. The central bank is open to comments till August 28th, 2014. You can put in your views and ideas on the draft rule. This plan of launching the differentiated banks will threaten the oligopoly which the existing banks enjoy. However this initiative will improve the lives of millions who do not have access to banks. The aim of providing formal financial services in remote areas should turn out a success.

Related Readings and Observations

  • Single Address Proof To Open A Bank Account Your identity proof is not the first thing anyone asks for, when you meet unknown people for the first time. You say your name and start exchanging words, but this is not so simple if you […]
  • Make Your Mobile Phone Your ATM Card ICICI Bank's smsNcash, an online service facility is quite a secure, convenient and user-friendly method of sending money in forms of cash to any other person, located anywhere in India.
  • No Penality on non-maintenance of minimum balances – RBI RBI on it Circular stated that from now onwards Banks cannot levy penality charges on non-maintenance of minimum balances in inoperative Accounts.
  • 10 State-Run Banks With Most Bad Loans This infographic shows the increasing number of borrowers struggling to repay their loan which resulting in bad loans for the state run banks. Among the state run banks State Bank of India […]

The post Small Banks and Payment Banks Explained appeared first on Marketcalls.

USDINR Long Term and Short Term : July Month Overview

$
0
0

USDINR Weekly Spot Charts
USDINR Long Term Update

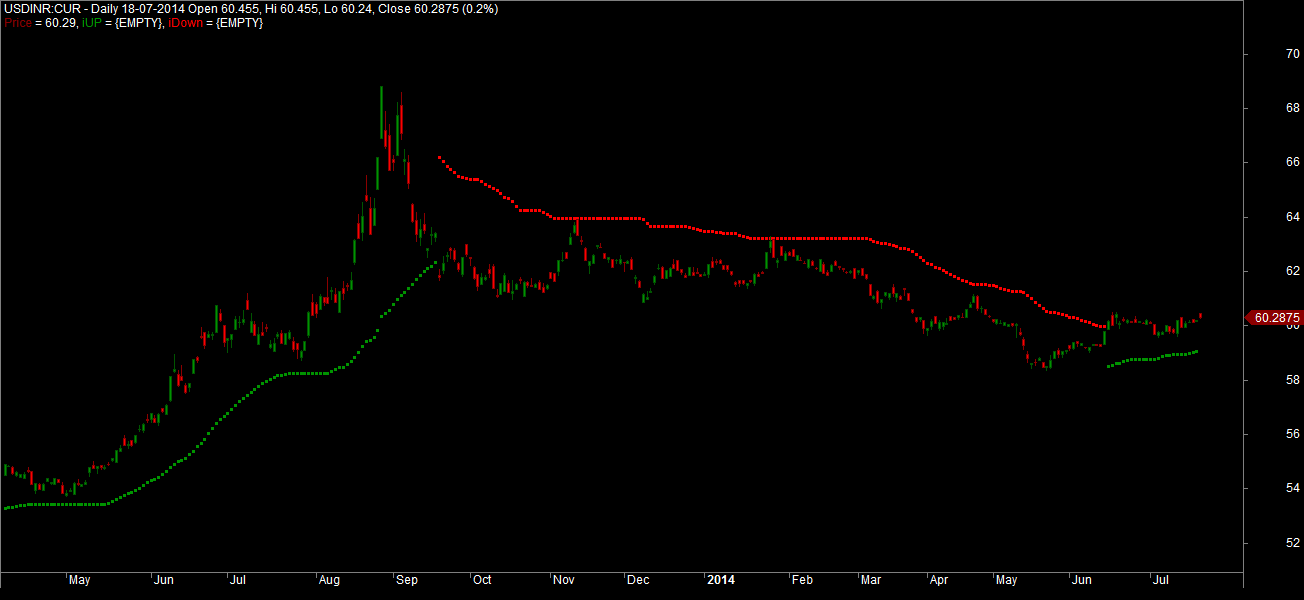
USDINR on the daily charts very recently turned to long term buy mode since 16th June 2014. Currently the EOD support comes near to 59.06. USDINR will turn to long term sell mode if the support levels breaks on the weekly charts.

USDINR MCX-SX July Futures Hourly Charts
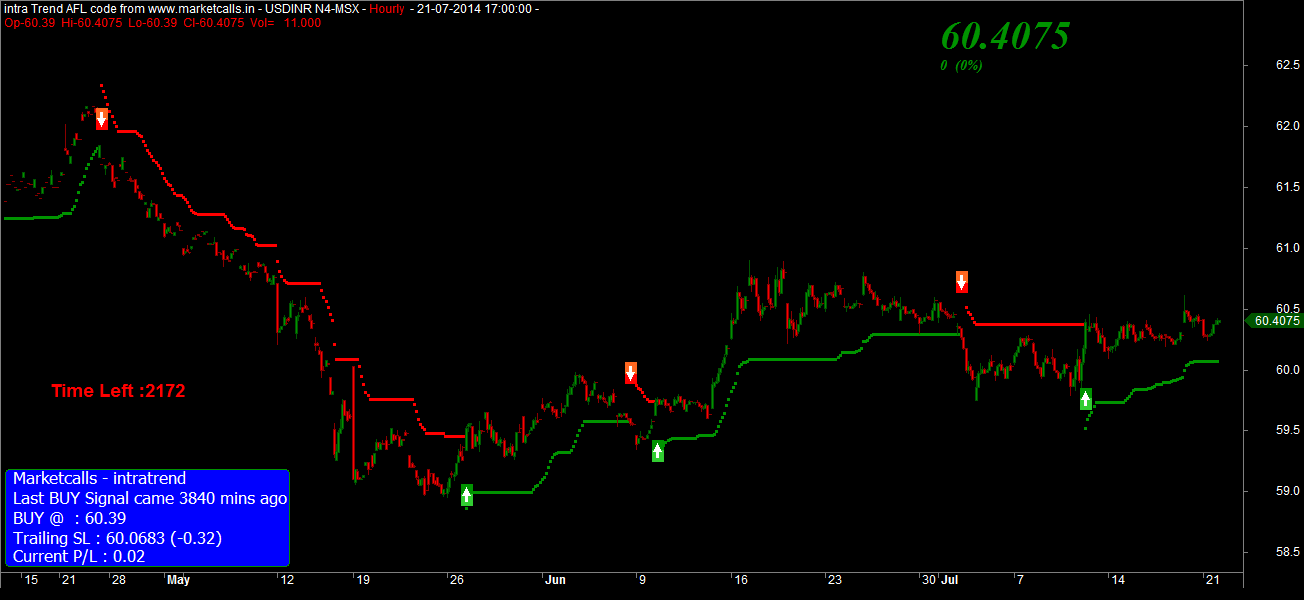
USDINR Short term Update

USDINR July Futures on the hourly charts is in positional buy mode and currently the hourly support zone comes near 60.06. Reverse your position to shorts if the support zone breaks on the hourly charts.

Related Readings and Observations

  • USDINR Long Term and Short term Overview USDINR on the daily charts is in long term sell mode since Sep 2013. Currently the EOD resistance comes near to 60.49. USDINR will turn to long term buy mode if the resistance levels […]
  • USDINR Hourly Future Charts March Overview – I The recent strengthening of the USDINR currency is due to the continuous buying of FII's for the past 15 days into India Equity Market. Interestingly FII's are the net buyers for the past […]
  • USDINR Long term Charts Overview USDINR daily charts are shown with Intratrend indicator. Currently charts are in sell mode since September 2013 and the long term resistance zone comes near 63.19. Breaking this 63.19 on […]
  • USDINR trend analysis using Andrew Pitchfork USDINR trend turns up on weekly basis.  USDINR close above WHEMA.  Next trend line hurdle near 55.30.  Close above that TL breakout possible.  RSI breakout gives early indication.

The post USDINR Long Term and Short Term : July Month Overview appeared first on Marketcalls.

Viewing all 2070 articles
Browse latest View live