Quantcast
Channel: Market Calls
Viewing all 2070 articles
Browse latest View live

Is Solar Power a “Good” Investment?

$
0
0

The idea that solar power may soon be everywhere isn’t nutty anymore. The price of solar panels has plunged more than 80 percent in the past five years and is expected to keep falling.Global output from photovaltics,panels that convert light directly into electricity, has increased 40 percent every year for the past decade. The industry is drawing more than $140 billion in annual Investment.In some places where the price of power is high, solar already is able to compete with fossil fuels on cost. But the idea, pushed by some environmental groups, that solar could soon meet the world’s energy needs seems far less likely For one thing, those big increases come on top of a tiny base — in 2011, solar accounted for only a fraction of 1% of the world’s electricity supply.There are still nights and cloudy days to deal with. Since we like our power always on, that means that cost versus coal isn’t the only hurdle — there’s figuring out how to feed a lot of intermittent power into a system meant for steady production. That could make the outlook for solar partly cloudy.

Profit Making Boom

Regardless of all these hurdles political leaders are working toward a global agreement next year in Paris on fighting climate change, there’s a lively debate about how much subsidy, if any, solar should get. Solar’s price is dropping, and many nations, led by Germany and Spain have scaled back lucrative incentives.Worldwide, installations are highest in China (including their dream of becoming a global superpower) where government want to reduce dependence on fossil fuels,In India many politicians of  BJP particularly Modi wants to make renewables more competitive  so action is happening at the state level Many Government have adopted standards for how much power should come from renewable sources the goal is 33 percent of power by 2020 up from 20 percent current reading. In my  practice, where we work with power investors, utilities, private equity funds, and independent power producers, my colleagues and I were pursuing fossil-fuel projects almost exclusively five years ago. Renewables represented less than 10 percent of our clients’ deal flow. Since then renewables deals have become our most common transactions.What’s driving the deals? New technologies that have pushed down the cost of renewables, for starters. Add to that crucial global Yield seeking investors  financing, which has multiplied due to ZIRP from G5 Central banks. Perhaps most importantly, the mindset of the energy prospector has changed. We see it in our clients; people who once chased oil and gas rights and traditional power deals are now going after solar contracts.

Rapid Growth

The U.S. invented solar cells but never had the determination to commercialize them. AT&T’s Bell Labs in New Jersey made the first photovoltaic cell in 1953.For decades, solar only made economic sense in satellites. Oil companies led by Exxon and Arco invested in solar panels — arrays of photovoltaic cells — following the oil crisis in 1973, then backed out when the price of crude crashed in the 1980s. Japan kept the industry alive through the 1990s, when Sharp, Kyocera and Sanyo were producing the majority of the world’s cells.Solar installations soared, and for several years Germany led the world in solar panel manufacturing.The model was copied in other countries and so many new solar panel makers sprouted up that a Price war followed and the concentration of the industry in China, where companies led by govt financing and cash from foreign investors — support that allowed them to survive a winnowing that shut many manufacturers elsewhere.Solar panels cost 60 percent less than they did just two years ago. Residential installation costs for solar panels in California now run about $4.25 per watt; in three years, says the U.S. Energy Information Administration (EIA), that number will be $2.88 per watt (we believe it could get there even sooner). Costs for utility-scale solar installations have fallen just as drastically, dropping from over $7.00 per watt to $2.50 per watt in the last five years. Total U.S. solar installations now produce 14 gigawatts of electricity, a five-fold increase from 2010. That’s equivalent to 23 billowing coal-fired power plants. Another 10 gigawatts are expected to come online in 2015 

solar-chartFINAL-01

How to Profit from it?

Simple-An average retail investors may buy solar company stocks from a speculation perspective and make sure you get paid dividends, good enough to hold the stocks for at least next couple of years this isn’t any sought of short term plays, Here we are going with boom and bust sequence that creates a speculative profits for selling at bust and buying in the middle or bottom of the boom. Similar to dot-com bubble during 1990’s, the solar boom itself is created by the same reinforcing structure- technology and appetite for replacement of classic energy system, we need to be careful at buying good companies with efficient dynamics which can sustain in the business even after the bubble is busted .

Not a profitable Investor? Want to learn new methods in trading?Be different from the crowd- Learn Institutional trading strategies and methods to capture market profits- to know more contact arulbalaji184@yahoo.com

Related Readings and Observations

  • Indian Elections 2014 Explained – Infographic Indians have begun voting in the world's biggest election, with the ruling Congress party pitted against the Hindu nationalist BJP opposition.The nine-phase ballot begins on Monday and […]
  • The State of the Farmers in India – Infographic Here is a infographic explaining the state of the farmers in India a survey conducted by the Centre for the Study of Developing Societies (CSDS) for Bharat Krishak Samaj, a farmers’ […]
  • Interim Railway Budget 2014 – Brief summary The railways budget of 2014 has created much buzz in the recent times. The new railways budget has just appeared the charts. The brief points of the railway budget for 2014 are as follows
  • State GDP Growth Rates in India – Infographic The Central Statistical Organisation (CSO) has released a revised state level GDP data for the last three years. The below infographic shows Which state have done worst and which have […]

The post Is Solar Power a “Good” Investment? appeared first on Marketcalls.


Trading Economic Indicators : CPI Inflation

$
0
0

CPI Inflation
[Image Source : CapitalMind]

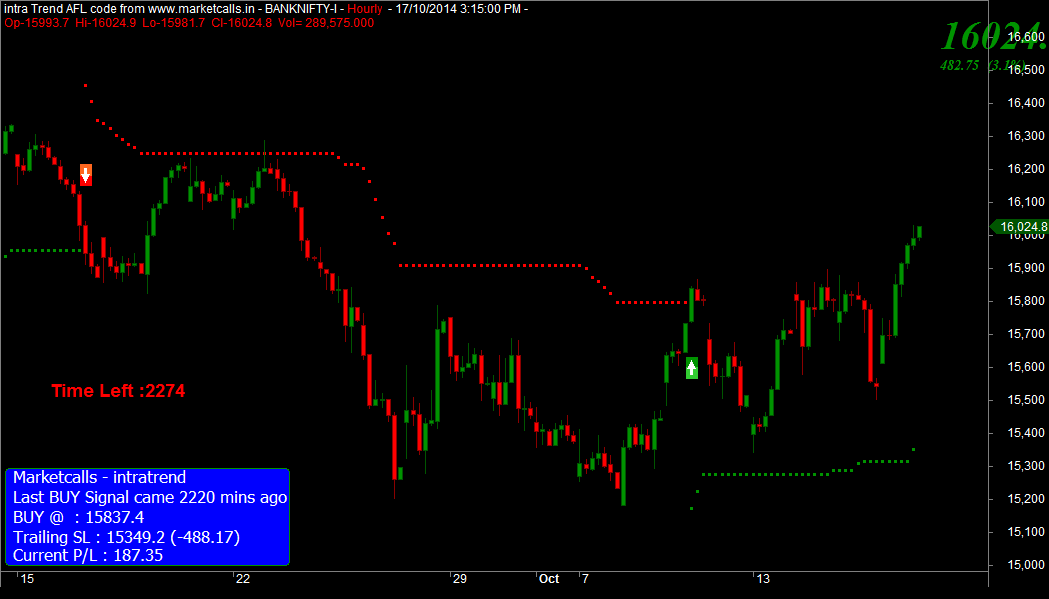
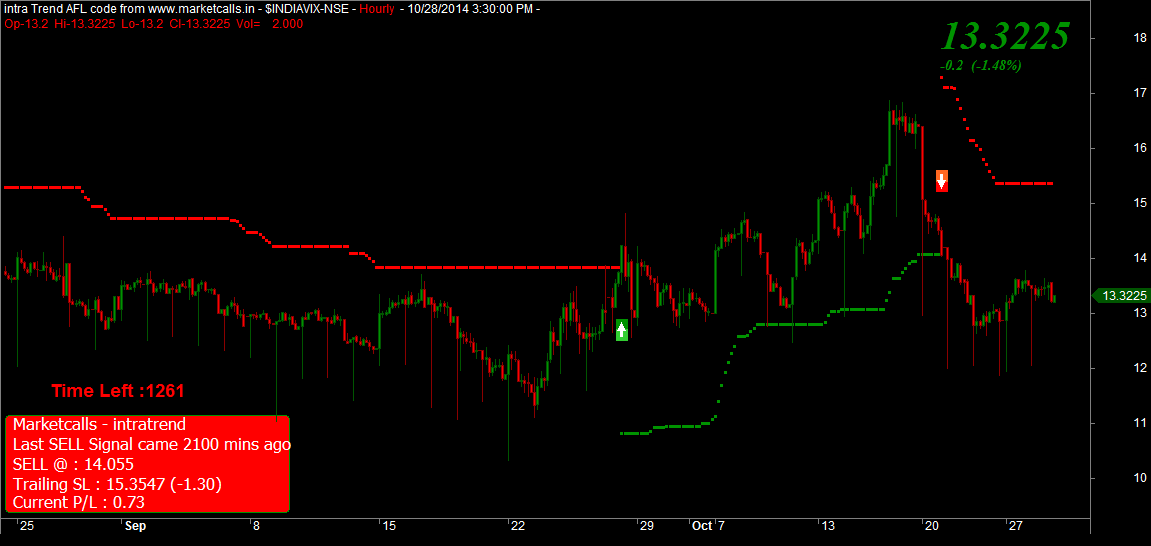
Trading Inflation CPI number is very big fundamental economics indicator for trading NSE.But according to our complete analysis it shows. Trading on CPI number depends upon various factors i.e expectation of market CPI Number & Its future projection for Year by Top Investing companies & Stable Govt. & their policies.

So what we see there is not major impact on Indian market as per Inflation number trading is concern.i.e from last 2012 now on 13 oct 2014 inflation no comes down But shows not good sign of recover in market & close by 20 points down.

INFLATION

Inflation tells us the changing (increasing) price of a range of goods or services; basically how much of something we can get for our money. The rate of change of prices – the speed at which the price of goods and services that are bought by households or businesses alter – is called inflation. But prices can also fall, in a process called deflation, sometimes termed negative inflation.

Inflation is more common than deflation, or at least it has been in the last 50 years or so, and so it has become associated with changes in the price of goods and services. Historically, however, price falls were as common as price rises, as we will see later.

Both inflation and deflation have advantages and disadvantages.

CAUSES OF INFLATION

Price inflation is caused when there is an excessive increase in money supply relative to the demand for it in the economy. In effect, too much money chasing too few goods. As a result of views like these, the INDIA had a monetary target for 2013 – 14 because it was thought that the best way to control price inflation (the 2008 – 13 was a period of particularly high inflation) was to control the increase in the quantity of money.

However, although there is a relationship in the long run, and at times the INDIA has seen close short-term links as well, the lags can be ‘long and variable’ and so targeting money supply eventually fell out of vogue in favor of targeting inflation itself.

Over the last few years, for instance, the INDIA has seen consumer price inflation well above the 3 – 4 per cent inflation target (10 – 12%), and yet money supply growth has been excessively slow. There are good reasons for this, but what it shows is that money supply itself is not that good a target for controlling inflation.

In fact, the detail of what is causing which components of money supply to change and why, is crucial in working out cause and effect. Of course, it could be argued that the economy was so weak that raising interest rates to control inflation would have just caused more damage to the economy. And in this sense, it is correct, as policymakers (RBI) did not raise interest rates because consumer inflation was above target, but cut them instead, because the economy was so weak, as suggested by the weak growth of money supply. So it would be true perhaps to argue that money supply has been correct, but the point is that it is not a good variable to use to target inflation, because it can send misleading signals.

Inflation can be thought of as being derived from the costs of producing domestic goods and services and the imported prices of goods and services. In fact the RPI is split into goods prices and services prices, and includes estimates of imported goods. Domestic costs can be measured through the GDP deflator, which does not include imported goods prices. It can be broken down into broad categories such as profits and rents (40 per cent) and wages (about 60 per cent). Import prices are paid on the basis of the currency that the goods originate from and so the value of the Rupees will vary between these currencies and so will impact the price of those inputs.

These goods can rise or fall in price for other reasons (such as crop failure or a rise in demand or costs), of course, but the change in the Rupees value against Dollar will also influence domestic price changes. A rise in the Rupees could push down imported prices; a fall will push prices up.

Consumer price inflation was so low between 2008 and 2013. It seems it was not about monetary policy, but the effect of global economic competition stemming from the inclusion of China and India, which drove down internal goods prices.

Oil prices played a role, as did services goods prices and a strong sterling exchange rate. The latter, in particular, would have pushed down imported price inflation. But this means that to understand INDIA inflation you do have to look at the detail of the inflation data, particularly goods price inflation. In terms of domestic prices, the main focus should be on services prices, which do appear to be remarkably stable, and high, at 5–6 percent a year, almost irrespective of what is happening to the wider economy. This implies that domestic INDIA prices are sticky downwards.

If we focus on just goods prices and compare those with INDIA import price inflation, we see that there is a very good fit. In other words, one of the key drivers of INDIA import prices inflation, and hence consumer price inflation, was goods prices. The period between 2007 and 2013 shows a negative inflation influence from goods prices. The fit between goods prices in the CPI and imports is strong over time, and their volatile trends tend to track each other well. Recently, INDIA goods price inflation has been rising gain, perhaps due to the influence of the weaker currency. For inflation watchers, particularly those looking at fixed income investments; these are critical trends to explore when analyzing the inflation data, for investors in those types of assets lose out when inflation accelerates.

What we see by analyzing complete data – Inflation rises when the Rupees falls and vice versa. The period between 1998 and 2013 is one where the relationship held but in a rising trend for inflation and the Rupees. One underlying reason why inflation may have risen is the length of the Indian economic boom (16 years), which gathered particular pace during that period, driven by consumer borrowing. Price inflation would probably have been even higher, had the exchange rate not appreciated.

Indian producer prices tend to move with CPI and RPI and the foreign exchange rate. As the name implies, it the measures firms’ prices, both their input prices and their output prices. The gap between the two is sometimes referred to as an implied profit margin, but of course a firm’s costs are much more than just raw material costs, which are what producer prices are trying to take into account.

Another way of thinking about the causes of inflation is in the following terms:

Cost-push inflation – inflation derived from a sharp rise in a key cost of firms.

Demand-pull inflation – occurs when demand in the economy exceeds its ability to supply that demand (too much money chasing too few goods).

Built-in inflation – due to the effects of past inflation persisting into the present.

Cost-Push Inflation

Cost-push inflation is derived from a sharp rise in a key cost of firms. This produces a ‘supply side’ shock that results in an expectation of inflation that helps create a wage-price spiral, producing a long-lasting effect. The example most often quoted is the oil price shock of the August 2013 Syria’s Oil Crisis , because of that it creating widespread inflation in all oil-associated sectors and products. By that their is a rise in the price level, which then results in a real output decline.

Not everyone agrees with this analysis, however.

Monetarists argue that inflation became a problem because central banks ‘accommodated’ it by allowing money supply to rise in response.

Where as some experts argument centers on the fact that increases in the cost of goods and services do not lead to inflation unless the government and its central bank cooperate in increasing the money supply. The argument is that, if the money supply is constant, increases in the cost of a good or service will reduce the money available for other goods

and services, and therefore the price of some of those goods will fall and offset the rise in price of those goods whose prices have increased. One consequence of this is that Monetarist economists do not believe that the rise in the cost of oil was a direct cause of the inflation of the 2013. They argue that, when the price of oil went back down in the 2014 there was no corresponding deflation, so, therefore, they state, how can you argue that an increase in the price of oil causes inflation?

What the central bank (RBI ) should have done was not to accommodate the increase in price pressure and raise interest rates, tightening monetary policy.

In that case some expert argue that in a modern industrial economy, many prices are sticky downwards or downwardly inflexible, so that instead of prices for non-oil-related goods falling in this story, a supply shock would cause a recession, i.e. rising unemployment and a drop in gross domestic product (GDP). It is the costs of such a recession that most likely cause governments and central banks to allow a supply shock to result in inflation. Otherwise, in order to control the inflation being generated they would have to reduce GDP by even more and so make the recession even worse. In addition, although prices did not fall outright, the rate of price inflation eased back. If the fact that inflation is driven by a number of factors – not just supply – is taken into account, the picture changes.

Demand falls back in a recession and so inflation eases; alongside that, as prices fall, so wage expectations ease as well, creating a virtuous cycle of expectations adapting to the reality of falling prices, i.e. a negative price/wage spiral.

Demand-Pull Inflation

Demand-pull inflation occurs when demand in the economy exceeds its ability to supply that demand.

Demand-pull inflation is considered to arise when aggregate demand in an economy outpaces aggregate supply. It involves inflation rising as real GDP rises and unemployment falls. This is commonly described as ‘too much money chasing too few goods’. This assumes that all available resources in the economy are fully utilized,including employment and investment and raw materials.

According to Expert theory, the more firms that are prepared to employ people, the more people will be employed. The aggregate demand (AD) will become greater and will make firms employ more people in order to produce more output. Due to capacity constraints, this increase in output will eventually become so small that the price of the good will rise. At first, once this occurs, unemployment will go down, shifting AD1 to AD2, which increases demand (Y) by (Y2 – Y1). This increase in demand means more workers are needed, and thus AD will be shifted from AD2 to AD3. However, this time, much less is produced than in the previous shift, but the price level has risen from P2 to P3, a much higher increase in price than in the previous move. This increase in price is called inflation.

Demand-pull inflation is in contrast to cost-push inflation, when price and wage increases are being transmitted from one sector to another. However, these can be considered as different aspects of an overall inflationary process: demand-pull inflation explains how price inflation starts, and cost-push inflation demonstrates why inflation, once begun, is so difficult to stop.

Built-In Inflation

Built-in inflation is due to the effects of past inflation persisting into the present. Experts believes that built-in inflation originates from either persistent demand-pull or large cost-push (supply-shock) inflation in the past. It then becomes a ‘normal’ aspect of the economy, via inflationary expectations and the price/wage spiral.

Inflationary expectations play a role because, if workers and employers expect inflation to persist in the future, they will attempt to increase their (nominal) wages and prices now. This means that if people expect inflation to be high, it is high, because they behave in a way that confirms it. For instance, they will accept higher prices being charged for goods rather than shun them, which would force firms to lower prices. Part of the reason why they will accept a higher price is because they will push for and get higher wages to compensate them. This then creates an inflationary cycle that is difficult to stop.

Expectations and behavior are therefore capable of being inflation drivers in the way described. So inflation happens now simply because of subjective views about what may happen in the future. Of course, following the generally accepted theory of adaptive expectations, such inflationary expectations arise because of persistent past experience with inflation.

The price/wage spiral refers to the adversarial nature of the wage bargain in modern capitalism. (It is part of the conflict theory of inflation, referring to the objective side of the inflationary process.) Workers and employers usually do not get together to agree on the value of real wages. Instead, workers attempt to protect their real wages (or to attain a target real wage) by pushing for higher money (or nominal) wages. Thus, if they expect price inflation – or have experienced price inflation in the past – they push for higher money wages. If they are successful, this raises the costs faced by their employers.

To protect the real value of their profits (or to attain a target profit rate or rate of return on investment), employers then pass the higher costs on to consumers in the form of higher prices. This encourages workers to push for even higher money wages to meet the rising prices, and so begins the cycle of inflation.

In the end, built-in inflation involves a vicious circle of both subjective and objective elements, so that inflation encourages inflation to persist. It means that the standard methods of fighting inflation, using monetary policy or fiscal policy to induce a recession, are extremely expensive, i.e. they can cause large rises in unemployment and large falls in real GDP. This suggests that alternative methods such as wage and price controls (incomes policies) may also be needed in the fight against inflation.

EARNINGS/WAGE INFLATION

Inflation can be broadly split into two categories – price inflation and earnings inflation. Earnings inflation is important in terms of its impact on the labour market and company profitability.

Lower earnings growth has been recorded across many sectors in Year 2012 – 13. The consequences for this are reductions in disposable income, expenditure and economic growth.

Earnings inflation is also relevant as a labour cost for businesses. It has an impact on firms’ profitability and thus on the equity and bond markets.

PRICE BASKET

Price changes, inflation or deflation, are measured from a basket of goods and services that are based on what is typically bought by the average consumer, either household or business. An index is created that is based on a summary of the total price changes in this basket of goods and services. The change in this index is then taken as the inflation or the deflation rate, depending on whether it is going up or down. This is based on an estimate of the index over time.

HOW IS PRICE INFLATION MEASURED?

At the last count there were about 5 major different measures of consumer price inflation in the India (Food, beverages and tobacco , Fuel and light , Housing , Clothing, bedding and footwear & Miscellaneous )

In addition to publishing the Consumer Price Indices (CPI) in the Indian on a monthly basis, the Govt. Of India Central Statistics Office (CSO), Ministry of Statistics and Programme Implementation publishes a number of other indices.

(www.mospi.gov.in).

All India Weights of different Sub-groups within Consumer Food Price Index Sub-groups

Description Rural Urban Combined
Cereals and products 36.71 28.51 34.16
Pulses and products 6.25 6.11 6.20
Oils and fats 8.98 9.44 9.13
Egg, fish and meat 6.50 7.38 6.77
Milk and products 16.53 21.59 18.10
Condiments and spices 4.10 3.79 4.00
Vegetables 12.64 12.93 12.74
Fruits 3.65 6.14 4.43
Sugar etc. 4.64 4.11 4.47
Total Weights 100.00 100.00 100.00

WHY IS INFLATION IMPORTANT?

As a target for official monetary policy setters, inflation is a key statistic for traders and investors. Inflation can have a detrimental impact on living standards if the prices of goods and services are rising beyond those of incomes.

Higher inflation can also erode the income to be gained from fixed assets, which creates issues for those dependent on fixed assets, i.e. pensioners. On the flip side, inflation means that firms can earn higher profits from their goods or services without actually doing anything further. This, of course, has a knock-on effect on the equity markets.

However, too much inflation can be a bad thing as it can make investments increasingly unpredictable and erode confidence in the markets, making investors less likely to invest, which is ultimately bad for economic growth.

Essentially, it makes calculating the rate of return on an investment uncertain because of the effect that inflation can have on eroding real returns. This unpredictability of future inflation is what can be so damaging for investment, and one of the reasons that policymakers are keen on keeping inflation low and stable, i.e. predictable, is because it makes for stronger investment and so economic growth.

Advantages of Inflation

Increased profitability for firms.
Strengthening of the equity markets.
It can be argued that targeting a higher inflation rate could boost growth, particularly in a prolonged recession.

Disadvantages of Inflation

Detrimental impact on fixed incomes.
Can cause standard of living to decline.
Can be destabilizing as it creates uncertainty.
Inflation can lead to a boom-and-bust scenario.
Discourages investment and long-term growth.
Can make exports uncompetitive although this depends on one country’s inflation rate compared with others.
It may devalue the exchange rate, creating further uncertainty.
Changes ‘real interest rates’ and so impacts on real returns for investors such as pension funds and insurance companies.
This, in turn, has an impact on the real economy.

DEFLATION

As we’ve mentioned, when prices are rising it erodes real income. Similarly, when prices are falling, in a deflationary environment, it erodes real value. The common perception is that this discourages people from spending. Although this is certainly the case for items of large capital expenditure and short-term hold, if prices are falling then real incomes are increasing and so households and businesses might actually be encouraged to spend.

The Japanese economy, for example, has faced a persistent deflationary environment. Despite this, real per-capita income is holding up, although growth has slowed as people delay purchases.

Deflation also means that companies earn less profit, so they in effect have to run faster just to stay still. Over the long term this is not tenable.

Advantages of Deflation

Can encourage spending as people have more money in their pocket as prices fall.
Lower prices.
Real wages may rise as workers resist employers’ attempts to reduce wages (an advantage for employees).

Disadvantages of Deflation

Firms’ profits impacted.
Value of assets eroded.
Discourages spend on non-essential or large-ticket items.
Increases the value of debt, making it more difficult to pay down.
Can erode the value of monetary policy as interest rates cannot fall below 0 per cent.
Real wages may rise as workers resist employers’ attempts to reduce wages (a disadvantage for employers and investors).

OTHER MEASURES OF INFLATION TARGETING

Inflation targeting is an economic policy in which a central bank estimates and makes public a projected, or ‘target’, inflation rate and then attempts to steer actual inflation towards the target through the use of interest rate changes and other monetary tools.

The RBI, for example, has an inflation target of 6 per cent but it has not hit that target since 2014.Does this mean that it has given up on inflation? That would be the easy reading. But in fact, with the economy having been in and out of recession since then, arguing that it should have raised rates to hit an inflation target with the effect of damaging an already weak economy is not one anyone accepts would have been the correct response.

Pulling all of the Indian main indices of inflation together, whether wages, prices CPI or CFPI, shows the same sort of trend, up or down, over any length of time. This means that they are closely linked and that to understand what the inflation pressures are in the economy, one must analyse all of them when they are released, in a broad way. Doing that means that maximum benefit will be derived.

Because interest rates and the inflation rate tend to be inversely related, the likely moves of the RBI to raise or lower interest rates become more transparent under the policy of inflation targeting.

For example:

If inflation appears to be above the target, the Bank is likely to raise interest rates. This usually (but not always) has the effect over time of cooling the economy and bringing down inflation.

If inflation appears to be below the target, the Bank is likely to lower interest rates. This usually (again, not always) has the effect over time of accelerating the economy and raising inflation.

Under the policy, investors know what the Bank considers the target inflation rate to be and therefore may more easily factor in likely interest rate changes in their investment choices. This is viewed by policymakers who target inflation directly as leading to increased economic stability.

HOW CAN WE EXTRACT VALUE FROM THIS?

Trends in inflation tell us about the direction of interest rates and policy. But they also tell us about the stresses and strains in the economy between demand and supply and between relative bargaining power and the different agents and sectors that make up the complex system that is a modern economy. Rising inflation matters because it means the official interest rate (cost of money) may go up or that fiscal policy might be toughened. It erodes the real value of wealth, so it informs people to push into products that protect them from its corrosive effects on wealth. The opposite is also true, of course: it could herald boom time as inflation falls if it also means a fall in interest rates. So it clearly matters that we get the analysis of the direction of inflation right.

Trading CPI Figure.

Release date of CPI data (5:30 PM evening so effect of next day) & their effects on NSE Index.

SNo. Subject Press Release Date
1 Press Release on New CPI for September, 2014 13/10/2014
2 Press Release on New CPI for august 2014 12/09/2014
3 Press Release on New CPI for July 2014 12/08/2014
4 Press Release on New CPI for June 2014 14/07/2014
5 Press Release on New CPI for May 2014 12/06/2014


NSE

12 June 2014 Data release Next day effect

May Data :

Provisional annual inflation rate based on all India general CPI (Combined) for the month of May, 2014 on point to point basis (May 2014 over May 2013) is 8.28% as compared to 8.59% (final) for previous month of April 2014 (Annex II). The corresponding provisional inflation rates for rural and urban areas for May 2014 are 8.86% and 7.55%.Inflation rates (final) for rural and urban areas for April 2014 are 9.17% and 7.69% respectively.

Provisional annual inflation rate based on all India CFPI (Combined) for the month of May, 2014 on point to point basis (May 2014 over May 2013) is 9.56% as compared to 9.83% (final) for previous month of April 2014. The corresponding provisional inflation rates for rural and urban areas for May 2014 are 10.27%and 7.98%respectively. Inflation rates (final) for rural and urban areas for April 2014 are 10.53% and 8.35% respectively.


Date Open High Low Close Shares Traded Turnover (Rs. Cr)
12-Jun-14 7641.3 7658 7593.8 7649.9 148207144 8187.49
13-Jun-14 7668.2 7678.5 7525.35 7542.1 174522339 11254.75

14 July

June Data :

 Inflation rates based on CPI (General) and CFPI Indices June 2014 May 2014 June 2013
Rural Urban Combd. Rural Urban Combd. Rural Urban Combd.
CPI (General) 7.72 6.82 7.31 8.86 7.55 8.28 9.63 10.13 9.87
CFPI 8.68 6.57 7.97 10.27 7.98 9.56 11.52 12.74 11.93
Date Open High Low Close Shares Traded Turnover (Rs. Cr)
14-Jul-14 7469 7478.45 7422.15 7454.15 135231220 6659.48
15-Jul-14 7491.3 7534.9 7459.15 7526.65 122068670 6124.15

12 August

July Data

 Inflation rates based on CPI (General) and CFPI Indices July 2014 June 2014 July 2013
Rural Urban Combd. Rural Urban Combd. Rural Urban Combd.
CPI (General) 8.45 7.42 7.96 7.87 6.82 7.46 9.14 10.18 9.64
CFPI 9.85 8.45 9.36 8.83 6.57 8.05 10.66 12.52 11.22


Date Open High Low Close Shares Traded Turnover (Rs. Cr)
12-Aug-14 7688.8 7735.75 7654.8 7727.05 120611660 6181.17
13-Aug-14 7717.3 7757.1 7695.7 7739.55 154083920 8030.41

12 Sep

 Inflation rates based on CPI (General) and CFPI Indices August 2014 July 2014 August 2013
Rural Urban Combd. Rural Urban Combd. Rural Urban Combd.
CPI (General) 8.35 7.04 7.80 8.37 7.42 7.96 8.93 10.32 9.52
CFPI 9.83 8.40 9.42 9.78 8.45 9.36 10.54 12.58 11.11
Date Open High Low Close Shares Traded Turnover (Rs. Cr)
12-Sep-14 8087.05 8114.3 8071.6 8105.5 111444349 6156.73
15-Sep-14 8070.35 8077.3 8030 8042 96502556 5387.06

13 Oct

 Inflation rates based on CPI (General) and CFPI Indices September 2014 (Prov.) August 2014 September 2013
Rural Urban Combd. Rural Urban Combd. Rural Urban Combd.
CPI (General) 6.68 6.34 6.46 8.27 7.04 7.73 9.71 9.93 9.84
CFPI 7.78 7.45 7.67 9.75 8.40 9.35 11.79 11.50 11.75

HISTORCAL CPI INDIAN DATA.

Table – 2014 inflation India (CPI)

 inflation (monthly basis) inflation   inflation (yearly basis) inflation 
 january 2014 – december 2013 -0.84 % january 2014 – january 2013 7.24 %
 february 2014 – january 2014 0.42 % february 2014 – february 2013 6.73 %
 march 2014 – february 2014 0.42 % march 2014 – march 2013 6.70 %
 april 2014 – march 2014 1.26 % april 2014 – april 2013 7.08 %
 may 2014 – april 2014 0.83 % may 2014 – may 2013 7.02 %
 june 2014 – may 2014 0.82 % june 2014 – june 2013 6.49 %
 july 2014 – june 2014 2.44 % july 2014 – july 2013 7.23 %
 august 2014 – july 2014 0.40 % august 2014 – august 2013 6.75 %
 september 2014 – august 2014 - september 2014 – september 2013 -
 october 2014 – september 2014 - october 2014 – october 2013 -
 november 2014 – october 2014 - november 2014 – november 2013 -
 december 2014 – november 2014 - december 2014 – december 2013


Table – 2013 inflation India (CPI)

 inflation (monthly basis) inflation   inflation (yearly basis) inflation 
 january 2013 – december 2012 0.91 % january 2013 – january 2012 11.62 %
 february 2013 – january 2013 0.90 % february 2013 – february 2012 12.06 %
 march 2013 – february 2013 0.45 % march 2013 – march 2012 11.44 %
 april 2013 – march 2013 0.89 % april 2013 – april 2012 10.24 %
 may 2013 – april 2013 0.88 % may 2013 – may 2012 10.68 %
 june 2013 – may 2013 1.32 % june 2013 – june 2012 11.06 %
 july 2013 – june 2013 1.73 % july 2013 – july 2012 10.85 %
 august 2013 – july 2013 0.85 % august 2013 – august 2012 10.75 %
 september 2013 – august 2013 0.42 % september 2013 – september 2012 10.70 %
 october 2013 – september 2013 1.26 % october 2013 – october 2012 11.06 %
 november 2013 – october 2013 0.83 % november 2013 – november 2012 11.47 %
 december 2013 – november 2013 -1.65 % december 2013 – december 2012 9.13 %


Table – 2012 inflation India (CPI)

 inflation (monthly basis) inflation   inflation (yearly basis) inflation 
 january 2012 – december 2011 0.51 % january 2012 – january 2011 5.32 %
 february 2012 – january 2012 0.51 % february 2012 – february 2011 7.57 %
 march 2012 – february 2012 1.01 % march 2012 – march 2011 8.65 %
 april 2012 – march 2012 1.99 % april 2012 – april 2011 10.21 %
 may 2012 – april 2012 0.49 % may 2012 – may 2011 10.16 %
 june 2012 – may 2012 0.97 % june 2012 – june 2011 10.05 %
 july 2012 – june 2012 1.92 % july 2012 – july 2011 9.84 %
 august 2012 – july 2012 0.94 % august 2012 – august 2011 10.31 %
 september 2012 – august 2012 0.47 % september 2012 – september 2011 9.14 %
 october 2012 – september 2012 0.93 % october 2012 – october 2011 9.60 %
 november 2012 – october 2012 0.46 % november 2012 – november 2011 9.55 %
 december 2012 – november 2012 0.46 % december 2012 – december 2011 11.17 %


Table – 2011 inflation India (CPI)

 inflation (monthly basis) inflation   inflation (yearly basis) inflation 
 january 2011 – december 2010 1.62 % january 2011 – january 2010 9.30 %
 february 2011 – january 2011 -1.60 % february 2011 – february 2010 8.82 %
 march 2011 – february 2011 0.00 % march 2011 – march 2010 8.82 %
 april 2011 – march 2011 0.54 % april 2011 – april 2010 9.41 %
 may 2011 – april 2011 0.54 % may 2011 – may 2010 8.72 %
 june 2011 – may 2011 1.07 % june 2011 – june 2010 8.62 %
 july 2011 – june 2011 2.12 % july 2011 – july 2010 8.43 %
 august 2011 – july 2011 0.52 % august 2011 – august 2010 8.99 %
 september 2011 – august 2011 1.55 % september 2011 – september 2010 10.06 %
 october 2011 – september 2011 0.51 % october 2011 – october 2010 9.39 %
 november 2011 – october 2011 0.51 % november 2011 – november 2010 9.34 %
 december 2011 – november 2011 -1.01 % december 2011 – december 2010 6.49 %


Table – 2010 inflation India (CPI)

 inflation (monthly basis) inflation   inflation (yearly basis) inflation 
 january 2010 – december 2009 1.78 % january 2010 – january 2009 16.22 %
 february 2010 – january 2010 -1.16 % february 2010 – february 2009 14.86 %
 march 2010 – february 2010 0.00 % march 2010 – march 2009 14.86 %
 april 2010 – march 2010 0.00 % april 2010 – april 2009 13.33 %
 may 2010 – april 2010 1.18 % may 2010 – may 2009 13.91 %
 june 2010 – may 2010 1.16 % june 2010 – june 2009 13.73 %
 july 2010 – june 2010 2.30 % july 2010 – july 2009 11.25 %
 august 2010 – july 2010 0.00 % august 2010 – august 2009 9.88 %
 september 2010 – august 2010 0.56 % september 2010 – september 2009 9.82 %
 october 2010 – september 2010 1.12 % october 2010 – october 2009 9.70 %
 november 2010 – october 2010 0.55 % november 2010 – november 2009 8.33 %
 december 2010 – november 2010 1.65 % december 2010 – december 2009 9.47 %


Table – 2009 inflation India (CPI)

 inflation (monthly basis) inflation   inflation (yearly basis) inflation 
 january 2009 – december 2008 0.68 % january 2009 – january 2008 10.45 %
 february 2009 – january 2009 0.00 % february 2009 – february 2008 9.63 %
 march 2009 – february 2009 0.00 % march 2009 – march 2008 8.03 %
 april 2009 – march 2009 1.35 % april 2009 – april 2008 8.70 %
 may 2009 – april 2009 0.67 % may 2009 – may 2008 8.63 %
 june 2009 – may 2009 1.32 % june 2009 – june 2008 9.29 %
 july 2009 – june 2009 4.58 % july 2009 – july 2008 11.89 %
 august 2009 – july 2009 1.25 % august 2009 – august 2008 11.72 %
 september 2009 – august 2009 0.62 % september 2009 – september 2008 11.64 %
 october 2009 – september 2009 1.23 % october 2009 – october 2008 11.49 %
 november 2009 – october 2009 1.82 % november 2009 – november 2008 13.51 %
 december 2009 – november 2009 0.60 % december 2009 – december 2008 14.97 %


Table – 2008 inflation India (CPI)

 inflation (monthly basis) inflation   inflation (yearly basis) inflation 
 january 2008 – december 2007 0.00 % january 2008 – january 2007 5.51 %
 february 2008 – january 2008 0.75 % february 2008 – february 2007 5.47 %
 march 2008 – february 2008 1.48 % march 2008 – march 2007 7.87 %
 april 2008 – march 2008 0.73 % april 2008 – april 2007 7.81 %
 may 2008 – april 2008 0.72 % may 2008 – may 2007 7.75 %
 june 2008 – may 2008 0.72 % june 2008 – june 2007 7.69 %
 july 2008 – june 2008 2.14 % july 2008 – july 2007 8.33 %
 august 2008 – july 2008 1.40 % august 2008 – august 2007 9.02 %
 september 2008 – august 2008 0.69 % september 2008 – september 2007 9.77 %
 october 2008 – september 2008 1.37 % october 2008 – october 2007 10.45 %
 november 2008 – october 2008 0.00 % november 2008 – november 2007 10.45 %
 december 2008 – november 2008 -0.68 % december 2008 – december 2007 9.70 %


Table – 2007 inflation India (CPI)

 inflation (monthly basis) inflation   inflation (yearly basis) inflation 
 january 2007 – december 2006 0.00 % january 2007 – january 2006 6.72 %
 february 2007 – january 2007 0.79 % february 2007 – february 2006 7.56 %
 march 2007 – february 2007 -0.78 % march 2007 – march 2006 6.72 %
 april 2007 – march 2007 0.79 % april 2007 – april 2006 6.67 %
 may 2007 – april 2007 0.78 % may 2007 – may 2006 6.61 %
 june 2007 – may 2007 0.78 % june 2007 – june 2006 5.69 %
 july 2007 – june 2007 1.54 % july 2007 – july 2006 6.45 %
 august 2007 – july 2007 0.76 % august 2007 – august 2006 7.26 %
 september 2007 – august 2007 0.00 % september 2007 – september 2006 6.40 %
 october 2007 – september 2007 0.75 % october 2007 – october 2006 5.51 %
 november 2007 – october 2007 0.00 % november 2007 – november 2006 5.51 %
 december 2007 – november 2007 0.00 % december 2007 – december 2006 5.51 %


Table – 2006 inflation India (CPI)

 inflation (monthly basis) inflation   inflation (yearly basis) inflation 
 january 2006 – december 2005 -0.18 % january 2006 – january 2005 4.37 %
 february 2006 – january 2006 0.00 % february 2006 – february 2005 4.57 %
 march 2006 – february 2006 0.00 % march 2006 – march 2005 4.57 %
 april 2006 – march 2006 0.84 % april 2006 – april 2005 4.65 %
 may 2006 – april 2006 0.83 % may 2006 – may 2005 5.93 %
 june 2006 – may 2006 1.65 % june 2006 – june 2005 7.27 %
 july 2006 – june 2006 0.81 % july 2006 – july 2005 6.33 %
 august 2006 – july 2006 0.00 % august 2006 – august 2005 5.94 %
 september 2006 – august 2006 0.81 % september 2006 – september 2005 6.40 %
 october 2006 – september 2006 1.60 % october 2006 – october 2005 6.92 %
 november 2006 – october 2006 0.00 % november 2006 – november 2005 5.95 %
 december 2006 – november 2006 0.00 % december 2006 – december 2005 6.53 %


Table – 2005 inflation India (CPI)

 inflation (monthly basis) inflation   inflation (yearly basis) inflation 
 january 2005 – december 2004 0.96 % january 2005 – january 2004 4.37 %
 february 2005 – january 2005 -0.19 % february 2005 – february 2004 4.17 %
 march 2005 – february 2005 0.00 % march 2005 – march 2004 4.17 %
 april 2005 – march 2005 0.76 % april 2005 – april 2004 4.96 %
 may 2005 – april 2005 -0.38 % may 2005 – may 2004 3.74 %
 june 2005 – may 2005 0.38 % june 2005 – june 2004 3.32 %
 july 2005 – june 2005 1.70 % july 2005 – july 2004 4.06 %
 august 2005 – july 2005 0.37 % august 2005 – august 2004 3.45 %
 september 2005 – august 2005 0.37 % september 2005 – september 2004 3.63 %
 october 2005 – september 2005 1.11 % october 2005 – october 2004 4.18 %
 november 2005 – october 2005 0.91 % november 2005 – november 2004 5.33 %
 december 2005 – november 2005 -0.54 % december 2005 – december 2004 5.57 %


Table – 2004 inflation India (CPI)

 inflation (monthly basis) inflation   inflation (yearly basis) inflation 
 january 2004 – december 2003 0.40 % january 2004 – january 2003 4.35 %
 february 2004 – january 2004 0.00 % february 2004 – february 2003 4.13 %
 march 2004 – february 2004 0.00 % march 2004 – march 2003 3.49 %
 april 2004 – march 2004 0.00 % april 2004 – april 2003 2.23 %
 may 2004 – april 2004 0.79 % may 2004 – may 2003 2.83 %
 june 2004 – may 2004 0.79 % june 2004 – june 2003 3.02 %
 july 2004 – june 2004 0.98 % july 2004 – july 2003 3.19 %
 august 2004 – july 2004 0.97 % august 2004 – august 2003 4.61 %
 september 2004 – august 2004 0.19 % september 2004 – september 2003 4.81 %
 october 2004 – september 2004 0.57 % october 2004 – october 2003 4.57 %
 november 2004 – october 2004 -0.19 % november 2004 – november 2003 4.17 %
 december 2004 – november 2004 -0.76 % december 2004 – december 2003 3.78 %


Table – 2003 inflation India (CPI)

 inflation (monthly basis) inflation   inflation (yearly basis) inflation 
 january 2003 – december 2002 -0.21 % january 2003 – january 2002 3.43 %
 february 2003 – january 2003 0.21 % february 2003 – february 2002 3.86 %
 march 2003 – february 2003 0.62 % march 2003 – march 2002 4.06 %
 april 2003 – march 2003 1.23 % april 2003 – april 2002 5.12 %
 may 2003 – april 2003 0.20 % may 2003 – may 2002 4.66 %
 june 2003 – may 2003 0.61 % june 2003 – june 2002 4.41 %
 july 2003 – june 2003 0.80 % july 2003 – july 2002 4.16 %
 august 2003 – july 2003 -0.40 % august 2003 – august 2002 3.10 %
 september 2003 – august 2003 0.00 % september 2003 – september 2002 2.89 %
 october 2003 – september 2003 0.80 % october 2003 – october 2002 3.29 %
 november 2003 – october 2003 0.20 % november 2003 – november 2002 3.07 %
 december 2003 – november 2003 -0.40 % december 2003 – december 2002 3.72 %


Table – 2002 inflation India (CPI)

 inflation (monthly basis) inflation   inflation (yearly basis) inflation 
 january 2002 – december 2001 -0.43 % january 2002 – january 2001 4.94 %
 february 2002 – january 2002 -0.21 % february 2002 – february 2001 5.19 %
 march 2002 – february 2002 0.43 % march 2002 – march 2001 5.17 %
 april 2002 – march 2002 0.21 % april 2002 – april 2001 4.69 %
 may 2002 – april 2002 0.64 % may 2002 – may 2001 4.66 %
 june 2002 – may 2002 0.85 % june 2002 – june 2001 4.16 %
 july 2002 – june 2002 1.05 % july 2002 – july 2001 3.89 %
 august 2002 – july 2002 0.62 % august 2002 – august 2001 3.86 %
 september 2002 – august 2002 0.21 % september 2002 – september 2001 4.30 %
 october 2002 – september 2002 0.41 % october 2002 – october 2001 4.06 %
 november 2002 – october 2002 0.41 % november 2002 – november 2001 3.60 %
 december 2002 – november 2002 -1.02 % december 2002 – december 2001 3.20 %


Table – 2001 inflation India (CPI)

 inflation (monthly basis) inflation   inflation (yearly basis) inflation 
 january 2001 – december 2000 -0.22 % january 2001 – january 2000 3.25 %
 february 2001 – january 2001 -0.45 % february 2001 – february 2000 3.02 %
 march 2001 – february 2001 0.45 % march 2001 – march 2000 2.53 %
 april 2001 – march 2001 0.67 % april 2001 – april 2000 2.28 %
 may 2001 – april 2001 0.67 % may 2001 – may 2000 2.50 %
 june 2001 – may 2001 1.33 % june 2001 – june 2000 3.39 %
 july 2001 – june 2001 1.31 % july 2001 – july 2000 4.04 %
 august 2001 – july 2001 0.65 % august 2001 – august 2000 5.19 %
 september 2001 – august 2001 -0.21 % september 2001 – september 2000 4.73 %
 october 2001 – september 2001 0.65 % october 2001 – october 2000 4.23 %
 november 2001 – october 2001 0.85 % november 2001 – november 2000 4.89 %
 december 2001 – november 2001 -0.64 % december 2001 – december 2000 5.16 %


Table – 2000 inflation India (CPI)

 inflation (monthly basis) inflation   inflation (yearly basis) inflation 
 january 2000 – december 1999 0.00 % january 2000 – january 1999 2.62 %
 february 2000 – january 2000 -0.23 % february 2000 – february 1999 3.61 %
 march 2000 – february 2000 0.93 % march 2000 – march 1999 4.83 %
 april 2000 – march 2000 0.92 % april 2000 – april 1999 5.54 %
 may 2000 – april 2000 0.46 % may 2000 – may 1999 5.01 %
 june 2000 – may 2000 0.45 % june 2000 – june 1999 5.24 %
 july 2000 – june 2000 0.68 % july 2000 – july 1999 4.95 %
 august 2000 – july 2000 -0.45 % august 2000 – august 1999 3.99 %
 september 2000 – august 2000 0.23 % september 2000 – september 1999 3.50 %
 october 2000 – september 2000 1.13 % october 2000 – october 1999 2.75 %
 november 2000 – october 2000 0.22 % november 2000 – november 1999 2.74 %
 december 2000 – november 2000 -0.89 % december 2000 – december 1999 3.48 %

– See more at: http://www.inflation.eu/inflation-rates/india/historic-inflation/cpi-inflation-india-2000.aspx#sthash.SwcvuHbL.dpuf

http://mospi.nic.in/Mospi_New/site/PressRelease.aspx


SNo. Subject Press Release Date
1 Press Release on New CPI for September, 2014 13/10/2014
2 Press Release on New CPI for august 2014 12/09/2014
3 Press Release on New CPI for July 2014 12/08/2014
4 Press Release on New CPI for June 2014 14/07/2014
5 Press Release on New CPI for May 2014 12/06/2014
1 2 3 4 5 Last


http://dbie.rbi.org.in/DBIE/doc/Release_Calender.pdf


SAMPLE OF INFLATION REPORT GENERATED BY GOVT OF INDIA


This Press Release is embargoed against publication, telecast or circulation on internet till 5.30 pm today i.e. 13th October 2014. Page 1 of 4

GOVERNMENT OF INDIA

MINISTRY OF STATISTICS AND PROGRAMME IMPLEMENTATION

CENTRAL STATISTICS OFFICE

Dated the 13th October2014

21, Asvina, 1936 Saka

PRESS RELEASE

CONSUMER PRICE INDEX NUMBERS ON BASE 2010=100 FOR RURAL,

URBAN AND COMBINED FOR THE MONTH OF SEPTEMBER 2014

The Central Statistics Office (CSO), Ministry of Statistics and Programme Implementation releases Consumer Price Indices (CPI) on base 2010=100 for all-India and States/UTs separately for rural, urban and combined every month with effect from January, 2011. In addition to this, Consumer Food Price Indices (CFPI) for all India for rural, urban and combined separately are also released w.e.f May, 2014. Inflation rates (on point to point basis i.e. September, 2014 over September, 2013), based on General Indices and CFPIs, are given as follows:

Inflation rates based on CPI (General) and CFPI Indices September 2014 (Prov.) August 2014 September 2013
Rural Urban Combd. Rural Urban Combd. Rural Urban Combd.
CPI (General) 6.68 6.34 6.46 8.27 7.04 7.73 9.71 9.93 9.84
CFPI 7.78 7.45 7.67 9.75 8.40 9.35 11.79 11.50 11.75


Complete Details : http://mospi.nic.in/Mospi_New/site/PressRelease.aspx


Lokesh Madan

Algo Trading India


Related Readings and Observations

The post Trading Economic Indicators : CPI Inflation appeared first on Marketcalls.

Gold Rally Could Continue.

$
0
0

Gold (16.10.2014) traded higher as per our article published on sep. 24th & reach to $1240 mark with some if & but.

This time lets start with some economic fundamentals, US doing with as far as economic data concern while a continue fall in equity market in this week may showing an effect of end of QE3. Euro area facing major hurdles in economic while china continue showing weak data with slowing economy activity.

All this activity leading to a sharp fall under stocks , oil , base metals & bond then the question is “where is investment liquidity is going on ?” Yes the answer could be bullion , gold , if it continue.

Technically , gold is trading around $1239 now & as we can see on charts, gold was able to bounce sharply form $1280 area & made a triple bottom. This move was well supported by volume & an ascending trendline. Now as we can see on charts, gold have lots of minor hurdles ahead but a reverse H&S pattern & RSI stability above 50 mark, suggesting the move to continue.

Gold

Based on above studies, there is major possibility for gold to move higher for possible levels around $1252-1260-1268-1283 while a reversal below $1221 will force us to reanalyze the charts.

Note – Above technical analysis is not a buy/sell recommendation. For recommendations Contact Us 


MCX  levels ->    S2(27000)         S1(27210)        cmp(27430)       R1(27630)        R2(27880)

Related Readings and Observations

  • Is Solar Power a “Good” Investment? The idea that solar power may soon be everywhere isn’t nutty anymore. The price of solar panels has plunged more than 80 percent in the past five years and is expected to keep […]
  • Gold Technical Analysis – Reversal or Corrective Bounce. Now gold is trading around $1221 & as we can see on charts , gold proving some upside momentum from last 2 days with some very obvious reasons. The downside rally in gold filled a gap […]
  • Strong Greenback Weakens Gold Prices Last year, investors were really bearish on gold, what with the foreseen interest hike that would be imposed by the U.S. Fed. In 2013, economists were sure that gold’s bull run would end […]
  • USDINR and GOLD Spot Price Medium Term Outlook Currently both USDINR and Gold maintains a medium term buy mode. And the support zone comes around 59.55/Dollar and 1260.6 respectively. Outlook will turn bearish if the support zone […]

The post Gold Rally Could Continue. appeared first on Marketcalls.

3 Old School Methods That Still Beats the Market

$
0
0

When it comes to 21st century financial markets,The complexity takes a heavy toll when you scroll down the list of market participants all you notice is the emerging linear changes that keeps the market evolving from phase to phase. After dot.com bubble,technology played a big role in transforming marketplaces,auction facilities and order flow transmittation from open out cry towards computer screening.By looking at the changes it becomes clear that traders who failed to adapt the new technology will be running out of business when we look at the list it is quite predictable that future will be ruled by technology-  Algo trading will be more common in exchanges,HFT’s will be regulated, what’s more for good or bad it is clear that future technology and costs will make even retail traders to operate HFT’s from their home computers which will totally outstrip the order flow advantage they prey on.If you are like me a digital savvy- open minded- information absorber  or in simple terms a Informative geek ,would have noticed that we already moving from algorithms to Neural networks,Micros-Nanos.  Future exchanges will be operating at a speed that only a computer can play the intraday game which will dictate the so called day traders to retire from the business or adapt the new technology. As Hebert spencer quoted” survival of the fittest”

benjamin-ben-graham-1

But there is other side of the coin many fail to understand-The classical “old is gold” methods that still beat the best of wallstreet and these techniques some as old as 19th century always puzzled,terrified the Efficient market advocates become an example of  survival of the fittest,in other words they are  producing results against hi-tech Algo traders, super giant hedge funds, and predative black swan hunters etc. Let’s take a look at them

3 Old school methods 

1. Trend trading  (Orgin: 1856)

Created by the first pit traders of NYSE, Later modified by Charles Dow- creator of Dow theory

What is it?

A trading strategy that attempts to capture gains through the analysis of an asset’s momentum in a particular direction. The trend trader enters into a long position when a stock is trending upward (successively higher highs). Conversely, a short position is taken when the stock is in a down trend (successively lower highs).This strategy assumes that the present direction of the stock will continue into the future. It can be used by short-, intermediate- or long-term traders. Regardless of their chosen time frame, traders will remain in their position until they believe the trend has reversed – but reversal may occur at different times for each time frame


When it didn’t work?

As long as their is markets their will be trends to profit from,Market cannot exist without trends- Of course some may argue the market will be in range bound 80% of the time etc. Flip it on other side, what’s range in one time frame is a trend on other time frame For eg: 1 Day chart might be in range bound structure but 4 hrs chart of the same asset will be trending

 Rating: 5 star  

2.Value Investing (Origin: 1932)

Derived on the ideas of  Benjamin graham and David Dodd

What is it?

The strategy of selecting stocks that trade for less than their intrinsic values. Value investors actively seek stocks of companies that they believe the market has undervalued. They believe the market overreacts to good and bad news, resulting in stock price movements that do not correspond with the company’s long-term fundamentals. The result is an opportunity for value investors to profit by buying when the price is deflated.
Typically, value investors select stocks with lower-than-average price-to-book or price-to-earnings ratios and/or high dividend yields.

When it didn’t work?

The big problem for value investing is estimating intrinsic value. Remember, there is no “correct” intrinsic value. Two investors can be given the exact same information and place a different value on a company. Also this  style tends to break down during financial crisis or economic downturns. Sometimes stock’s value doesn’t rebound as expected by a value investor, But overall it is still a worthy strategy due to it’s track record and performance

Rating : 4 star

3. Contrarian or Counter crowd Investing (Origin: 1929)

Derived from Great wall street crash on 1929 with the principle that crowd is always wrong

What is it?

An investment style that goes against prevailing market trends by buying assets that are performing poorly and then selling when they perform well. A contrarian investor believes that the people who say the market is going up do so only when they are fully invested and have no further purchasing power. At this point, the market is at a peak. On the other hand, when people predict a downturn, they have already sold out, at which point the market can only go up.For example, widespread pessimism about a stock can drive a price so low that it overstates the company’s risks, and understates its prospects for returning to profitability Identifying and purchasing such distressed stocks, and selling them after the company recovers, can lead to above-average gains. Contrarian investing also emphasizes out-of-favor securities with low P/E ratios.

When it didn’t work?

Contrarian as the name suggest is exactly opposite to trend trading, but one catch though- You need to get the timing right or the losses will be enormous. Contrarian Investors are not the ones who simply go against the trend but they bet against it at the right time and take away a huge chunk of profits within short period .A contrarian believes that certain crowd behavior among investors can lead to exploitable mispricings in securities markets.  But as usual everyone cannot be a contrarian-it takes right skill and experience to beat the market in this way and last but not least” Patience is the name of the game”

Still struggling to be a profitable trader? Take up our professional course and succeed in capturing market profits using Institutional trading strategies to know more contact arulbalaji184@yahoo.com

Related Readings and Observations

The post 3 Old School Methods That Still Beats the Market appeared first on Marketcalls.

Nifty and Bank Nifty Futures Positional Trend Update

$
0
0

Markets across the globe plunged due to economic data from Europe and Japan showed signs of recession. FIIs sold nearly Rs 4000 crore of Indian equities in the month of October. Banking stocks shows strength. TCS and HCL are the top loosers in nifty post their Q2 Result announcement.

Nifty Futures Hourly Charts
NIFTY V6

Nifty Futures continues its positions sell mode right from 24th September onwards and currently the resistance zone comes around 7997 .Reverse your position to positional buy mode if the resistance breaks on the hourly charts.. On Contrary Bank Nifty futures maintains the Positional Buy mode and currently the support zone comes around 15349. Reverse your position to positional sell mode if the support breaks on the hourly charts.

Bank Nifty Hourly Charts
BANK NIFTY V6

India VIX Hourly Charts

Volatility in the Market is slowly and steadily increasing and at this point of time the current value around 16 suggests no much of panic in the market overall and IndiaVIX continue to be in the positional buy zone and with the given elevated global volatility one can expect the same style of increasing volatility in Indian Market too.

India VIX Hourly

Open Interest Charts

After nifty closing below 7800 on EOD basis 7800PE writers are overridden by 8000CE writers as currently they are the active and highest open interest builders across the strike price. And now option writers strongly believe that 8000 will be the resistance zone for october month expiry.

Open Interest

Nifty Weekly Charts

Long Term Picture : Applying the principal of 5EMA high-low strategy over the Nifty spot weekly charts suggests that nifty is in long term down trend for the last two weeks and the long term weekly resistance is near 8005. Only closing above 8000 on weekly basis could turn the long term picture positive.

Nifty Weekly

Major Economic News for this week

US-based economist Arvind Subramanian on Thursday took charge as chief economic adviser in the finance ministry,
Sensex falls for fourth week in row; longest losing streak since Aug 2013

Upcoming Major Economic Events

October and Novemeber 2014 economic events

Related Readings and Observations

The post Nifty and Bank Nifty Futures Positional Trend Update appeared first on Marketcalls.

Inclusive Financing A Need For The Financially Humbled

$
0
0

Inclusive Financing A Need For The Financially Humbled

Many emerging economies of Asia, Africa and South America have large shares of the inhabitants living under poverty and have less access to economic or financial resources and services. Those people are either too poor to save or too risky to offer money to. Since the last many decades, many developed nations and world’s financial institutions are trying to pull this group of people out of poverty. Specialized schemes and methods to give financial amenities to these people have been made. It is known as inclusive financing. People belonging to this category have been receiving varied choice of financial help by world institutions for their stabilize growth in the society. Inclusive finance to these people includes savings, source of loans, insurance and various other financial aids. Over the past many years, it has been noted that appropriate financial support can encourage small enterprise activities and can provide them a better standard of living. Very Recently RBI Governor Raghuram Rajan called for leveraging technology to achieve financial inclusion.

stateInclusion
[Source : RBI working paper on Financial Inclusion in India A case study of West Bengal by Sadan Kumar Chattopadhyay]

Sustainable Financing

When individuals and businesses together come up with a range of financial services for the underprivileged within reasonable cost, then financial inclusion is said to be achieved. And when financial inclusion goes through increased savings, credit, insurance and payment services then it contributes to sustainable economic growth.  Sustainable economic growth determined by the socio economic structure of the region. If adequate provisions are to be taken to curb poverty growth, then policy makers and politicians are also required to pitch in it equally.

Goal of financial inclusion

The main goals of financial inclusion since the last two decades have focused mainly on the access for all households to a full range of financial services. They verily include savings, deposit services, payment and transfer services. Aim to provide sound and safe institutions by clear regulation and industry performance standard. However, continuity and certainty of investment is a must. Ensuring choice and affordability by competition is also a must to do. The main challenge however is to address the problems that exclude a large section of people from full participation in the financial sector. The main aim thus remains for financial powers and institutions to join and help poor improve their standard of life.

Institutions to work for financial inclusion

Inclusive finance holds the supply of loans, savings, and insurance. These services are mainly provided by microfinance institutes (MFIs). Appropriate financial services can inspire small enterprise events and improve the standard of life of households. At the global, regional and “country level” they provide popular analysis report. This financial organization has been working for the past two years with various policy makers, “financers”, to collect isolated dates and conclude on them.

Budget analysis to financial inclusion

The expenditure that has been incurred and the budget of the past two decades for financial inclusion can tell us how far the world had progressed in reaching out to the poor. Improvement in their condition of living can now only be analyzed by the budget tracking. Tools to track public expenditure by different civil societies have been adequately made. Such tools include social and public accountability surveys. Many adequate measures to connect the poor with the banking institutes also have been made. For such measure, accountability is required, which can only show us the statistics of improvement.

Related Readings and Observations

  • Updated Elliot Wave Structure for Nifty 3-5 Wave Still Missing to Complete the Major Wave 3.3-5 Is a 5 Wave Pattern.Means Pending Corrections are still left in nifty. This Elliot Pattern willcollapse if nifty shoots above […]
  • Nifty and Bank Nifty 90 min Volume profile charts for 27th July 2012 Trading Nifty and Bank Nifty 90 min volume profile charts are shown. Nifty and Bank Nifty 90 min charts are in sell mode since last friday and currently the 90min cloud resistance are near 5180 […]
  • Dukascopy free IEOD and EOD data Ducascopy provides a free IEOD(1 min data) and EOD(Daily) data for many of the commonly used symbols like Gold,Silver,Forex World Indices like( Dow Jones, Sensex,CAC40,DAX,SSEC...etc i.e […]
  • Intraday Swing Trading Example in Nifty The Traders Action Zone (TAZ) is a buy and sell zone on a chart that swing traders can use to identify possible reversals in a stock.This is just simply  "area" that we […]

The post Inclusive Financing A Need For The Financially Humbled appeared first on Marketcalls.

Things to Consider Before Creating your Own Trading Strategy

$
0
0

Backtesting and Optimization to be pretty much essential step in trading strategy development. If the strategy is not performing well in the backtest results we can skip the system and move on to the next one. But if the backtest results are good then one should be extra cautious as most of the times backtesting your own Trading Strategy might give interesting results. However when comes to practical trading the scenario might be completely different and most of the times it results in a poor performance or lower than the expected backtest results.

Generally speaking including realtime trading conditions in your backtesting is close to impossible. The real time market conditions like  transaction costs, slippage, realistic quotes, and survivorship bias are really tough to include in your backtest results.  Small mistakes here compounded and mostly results in hugely inaccurate results.

But here are the certain factors you can understand to avoid a drastic poor performance when comes to systematic trading.

Survivorship Bias : Its quite a dangerous phenomenon which can result in inflated performance in your backtest results as most of the time it fails to cover all the market conditions. For example if you had tested any trend following strategies during 2007-2008 period you would have got extraordinary results across all the scripts. However after apply the same strategy in 2009-2014 you would have got a varied and a poor performance as compared to the bactesting period. Some of the stocks would have gone bankrupt during a crisis situation if such situations are avoided and your strategy cover trading set of stocks then it could sometimes results in poor performance due to such biased attempt as your trying to trade only stock which managed to sustain during poor economic situations and prosper however you are rejecting the bad apples and taken only the good ones in your strategy for backtesting. Use a quality dataset which is free from survivorship bias. and your backtesting results covers all set of market conditions.

Curve Fitting : While Optimizing a trading system including too much of optimization variables (More than three or four) and finding the best variables that performed in the past is closely equal to Data Mining. Where it simply finds the best variables which performs extraordinary in the past. However this methodology fail to perform in the random market or unseen data. Its better to limit your trading system variables to a max of two or three while performing optimization.

Evolving Markets : Traders are evolving and so the markets are evolving the strategies worked during 2005, 2007 are not working in the present market situations. As a trader you should have an idea when your trading system fail where there is a complete change in the market conditions.

Worst Case Scenario and Risk Tolerance :  After backtesting one mostly look into the profit part and the ever growing equity curve. There are other trading metrics like Sharpe ratio, MAX Drawdown, Consecutive Losses, CAR/MDD. Though a trading system with 20-25% drawdown  looks like acceptable to trade such systems, but when comes to practical trading in realtime incurring a 20-25% drawdown you have to pass through lot of emotional stages. And when comes to systematic trading at lower timeframes during worst case scenario you might expect 7-10 consecutive losses in a row. This could occur even in your if you are doing discrete trading and by that times its really difficult to control your emotions which sometimes result in stopping such trading system at worst case scenario as your risk tolerance level is not predefined.

Build your own Realtime Audited Results : During Practical trading record your trading results (which includes transaction costs, brokerage, slippage) and cross check with your backtesting results and observe how much you are deviated from your backtesting results. This could help you in understanding your trading strategy even better.  Its good to have a realtime audited results which speaks more than your backtested results.


Related Readings and Observations

The post Things to Consider Before Creating your Own Trading Strategy appeared first on Marketcalls.

Emotional Trading Vs Rational Method Of Trading.

$
0
0

The worst thing ,an individual investor can do is to follow the market too closely.

Paul Bolster

Surely a sign of a good trader is that they don’t jump every time the market says ‘Boo’, but take a longer term perspective, ignoring short-term noise.

What is emotional investment?

Most of us invest based on our gut feeling or intuition also called instinctive impulses.Psychological factors such as greed ,fear ,hope and pride or Ego dominate our investing decisions.We sometimes go by tips or advice of some body or jump with news on TV or news papers.Our assumption of certainty of outcome is based on knowledge gained from various sources which we tend to believe or just give a try.This is irrational investing process as certainty of outcome is based on our belief of information where outcome is always binary and not predictable.

How emotional investing happens?

We have been hearing this gloom and doom stories or bubble themes since we are child. Good traders prefer to Turn off the TV and radio and study higher time frame charts. News is nothing but brainwashing to separate you from your hard earned cash by putting you in emotional freight train.

We all track news and information from various sources for investment purposes.Following very closely market news means tapping into short term developments which is deeply impacting price and consumer and investment sentiments.These short term moves emotionally involves us and influence our decision making.This is invariably true for most of us except professional experts or technical experts.When I say closely watching ,it means watching in 5 or 10 or 15 minutes time frame.You not only miss big picture ,but something happens in your head.It becomes subjective ,psychological called emotional trip.There you are in pressure of excitement or tension .

If you play chess ,imagine playing against an expert.You are not calm and relaxed.Your rational brain stops working completely.Time is pain then and you have no patience.Without patience ,you are in hurry like in greed or fear of missing out and you make mistakes. Similar mindset prevails when you are in trade.You don’t know when to buy or when to sell or when to book profit and loss. But Patience is slowing down in the face of pressure .It gives strength and maturity .It gives tremendous confidence to deal with any problems and provides solutions.Patience gives courage and confidence which opens the gates of solutions.This is true both in chess or trading or for that matter in any sports.

Emotional investing happens due to lack of patience resulting from addiction or obsession with market on 24X7 basis.You are just reacting to something which may or may not have certainty impact on price or expected outcomes.Your emotions or beliefs have nothing to do with market outcome whether present or future where mass beliefs are constantly changing.No predictability there, only probability or higher odds of certainty.Your emotional impulses or reactions affords none of these except the comfort of risk aversion.You eventually lose because emotions have nothing to do with certainty of outcome.We want to hit home run and don’t wish to be shaken out like suckers.Sound funny if someone tries to trade millisecond breakouts .Emotions lead you to be out of control and do silly thing in your attempt to control the uncontrollable.Give yourself and your mind some room to see big picture ,to observe from vantage point like a general instead of fighting like a foot soldier in direct combat.

What is Rational Investing Method?

Rationality is about probability ,odds and edge or superior chance of winning. In contrast ,Emotional investing is reacting to current market move by looking at smaller time frames which is most of times are not durable however terrible it may appear.It is called irrationality.On the other hand Rationality involves analyzing longer term or medium term trend and ignoring short term noise called volatility.Seeing big picture in randomness or chaos or deciphering high degree of certainty in sea of uncertainty .Trading is like crossing super highway where the danger getting crushed forever looms large.

However Rationality or objective method of trading does not afford 100% certainty per se.But trading safety is enhanced and Risk is greatly mitigated.Rational method demands high level of certainty of expected outcome and tolerable downside which is also kept in domain of possibility.This process protects downside and eliminates surprise elements from equation.

High level certainty of expected outcomes requires identification of long term or medium term trends or ranging behavior, historical volatility which determines both return and risk inbuilt in stock, or by building up higher odds with optimized and back tested Moving Average filters /MA cross over filter and ADX based filters like in trend following systems for examples. In addition ,odds are made favorable with Price action analysis by Japanese candlesticks ,trend lines and patterns or Fib tools and support/resistance study or price by volume study.Basically trading from long term chart is about objective trading.

Further ,we can reinforce our odds and edge to have greater certainty of expected outcome with higher safety and protection,using momentum indicator filters like RSI,STO,MACD, ATR, ADX and so on to know oversold/overbought conditions ,support/resistance ,filter noise or to know VAR and statistical significance of expected move.Your method should have formidable edge like that of casino and positive expectancy.Besides Using fundamental based filters like quarterly results or macro results like inflation.IIP or RBI policy announcements may serve same purpose. This is rational and objective filtering method for certainty and optimal outcomes.

Breakout traders ,momentum trading ,swing trading or trend following are some examples of rational method of trading.Rationality is about maths(quantitative methods like accumulation distribution or sentiment metric) ,charts ,probability. fundamental based study .positive expectancy or Edge which completely disconnects emotions from trading equation.

CROWD AND IRRATIONALITY

We tend to invest as herd and make our ivesting decision based on psychological factors such as fear,greed,hope and pride.We react and jump at every piece of news or every short term move of market which may not have decisive role to bring about certainty of the directon.Noise are misleading and to be ignored.In stead we ignore long term message of market about future.We tend to miss big picture over and over again.We are fooled by tips ,piece of inside information , media hype ,interesting news or noise and believe them.This happens we look at market too close in short timeframes which mistakenly gives us perception of certainty and we get trapped instead.

Ignore Noise and see big picture.Dont fall in Love and Keep distance from Market.

“The thing to do is to watch the market, read the tape to determine the limits of the get-nowhere prices, and make up your mind that you will not take interest until the price breaks through the limit in either direction.”

Jesse Livermore

Related Readings and Observations

  • How to Build a Portfolio – Your Trading Game Plan Successful investment involves professional approach or systemic approach to save time ,ensure disciplined approach and avoid unnecessary repetition and to prevents us from discretion […]
  • Study Of Common Investment Habits The core challenge as an investor is setting aside instinctive physiological and emotional responses at the root of our brain’s decision-making processes. Though they are perfectly suited […]
  • How Not To End Your Trading Career Untimely. Nineteen-year-old Monty spent the afternoon day-trading penny stocks because his prefrontal cortex isn't yet fully developed and he couldn't recognize risk-reward trade-offs if they hit […]
  • Why Most of New Traders Fail to Profit? Any persons today involved in buying and selling stocks or future or commodity calls themselves traders. If you are someone who is been involved in stock market trading be it from a week […]

The post Emotional Trading Vs Rational Method Of Trading. appeared first on Marketcalls.


Last Five Trades Result Dashboard – AFL code

$
0
0

Here is simple visualization to look into the past five trades result and plot the values over the chart which gives a quick view on how the strategy performed in the last five trades. In this AFL example we had created the dashboard for simple MACD crossover. And the dashboard doesnt include current open positions and only include last five closed positions.

Nifty Futures Daily Charts
Nifty Futures Dashboard

Here we are using equity function to generate realtime backtesting equity curve and from there we used BarIndex() feature to track back the Last Five trades Profit/Loss Results

To create your own Last Five Results Dashboard over your trading system you have to replace the sample MACD Buy/Sell/Cover/Short rules with your trading rules.

Download Last Five Trades Result Dashboard for Amibroker

Note :
1)PositonSize is set to 1 shares to get the exact profit/loss points
2)This AFL doesnt includes Slippages/Commissions and displays pure signal to signal profit/loss points
3)However you can include Slippages/Commissions in the Initial Values Section
4)Dont click on the chart this will create a vertical lines over the candlestick which will distort the values of dashboard
5)If you see such vertical lines or mistakenly clicked over the candlestick then double click over the vertical lines to remove it from the chart.

Related Readings and Observations

  • How to Plot Bid Vs Ask Dashboard in Amibroker Here is a little Bid Vs Ask Dashboard for Amibroker users which helps to monitor the Bid-Ask Spread during live trading. In a highly liquid market the Bid Ask spread difference will be […]
  • Simple Smoothed RSI Crossover Strategy Here is the simple smoothed RSI crossover strategy can be practiced on higher timeframes especially with daily timeframes with controlled risk. It catches the big trends and gets little […]
  • Intraday Gap Up and Gap Down – Amibroker Strategy Strategy is very simple. when the market open with gap up and at the same time ,it crossed the previous day high then it should be considered as strong buy. When the market open with gap […]
  • ATR Volatility Long Only Trading System Yet another ATR Volatility based Long only Trading System. ATR Volatility system a mechanical strategy for higher time-frames Written by Tudor Marcelin - Art Invest. Just modified the […]

The post Last Five Trades Result Dashboard – AFL code appeared first on Marketcalls.

Nifty Future October Expiry Overview

$
0
0

Nifty

Nifty Future closed the week at 8023.5 on Diwali mahurat trading session. the market has seen a sharp reversal from lows of 7752 and with positive global cues the index has managed a strong up run in short term. Majority of moves have happened with gap up’s in the same.

Now week ahead we are entering the FNO Expiry for October series hence playing in options huge amount shall be avoided. On index front the hurdle for nifty is at 8050 once sustain this level then expect the same to move towards the trend line resistance around 8120, breakout above 8120 will lead nifty to 8200 and higher.

Banknifty has already made an breakout to life time high’s and if bank nifty supports we can expect to see fresh life time high’s in nifty as well.

On downside the supports for bulls is at 7990 if break this level expect another 50 point cut soon for 7945 below which bear’s will become active again.

Trading Strategy : Enter Shorts Below 8015 with stops of 8050 abv close for a target of 7945/7930 

Related Readings and Observations

The post Nifty Future October Expiry Overview appeared first on Marketcalls.

Bank Nifty Futures October Expiry Overview

$
0
0

Banknifty

Bank nifty Future Hurdle 16700 / Major Supports 16300

After breakout from horizontal trading range in bank index the bank nifty futures made its life time high’s in past week. The high made on future is 16632 and the weekly close was at 16483+. Now going forward for monday trading session the Hurdle for banknifty is at 16700 fresh buying will happen once this level sustains and since there is no resistance left for market its all a bulls play the trend will continue.

However on downside below 16470 market will correct for 16400-16300 below which only bear’s will start entry for 16150-16000

Trading Stratgey : Be short below 16470 with stops 16650 tgt 16300-16250 take small risk around 16250 and below, take calls with stops of 16150 for upside targets new high.

Related Readings and Observations

The post Bank Nifty Futures October Expiry Overview appeared first on Marketcalls.

Myths about Warren Buffett and Value Investing

$
0
0

Warren Buffett is the most glorified and respected investor of all time. And rightfully so. After all, he became the world’s wealthiest man by essentially picking stocks?-Dead wrong.Not only that Warren Buffett is also remarkably misunderstood by the general public. I personally believe the myth of Warren Buffett is one of the greatest tricks ever played on the small investor and the approach of the value investing in general.

value-investing-is-the-answer

To the average investor Buffett is a folksy frugal regular old guy who just has a knack for picking stocks. You know, he just picks those “value stocks” and let’s them run, right? Well, nothing could be farther from the truth and here we sit with an entire generation of investors fooled by the idea that value investing/buy and hold is the single greatest way to accumulate wealth. With the poor results of the last ten years investors have finally started to challenge this thinking

To a large extent, the myth of Buffett has fed an investment boom as a generation of global aspire to make their riches in the equity markets. And who better to sell this idea than market salesman themself?After all, a quick investment in Value fund or Value stock (now essentially defunct) will get you a near replica of the Warren Buffett approach to investing, right? Not so fast.

Let me begin by saying that I have nothing but the respect for Value Investing folks and Buffet followers. When I was working back in Wallstreet I printed every single one of Buffet’s annual letters and read them page by page. It was and remains the single greatest education I have ever received. I highly recommend it for anyone who hasn’t done so. But in digging deeper I realized that Warren Buffett isn’t just this value stock picker that he is widely portrayed as. What he has built is far more complex than that in other words a financial monopoly which plays hands off and on game starting from refinancing to Insurance stakeholding.

In reality, he formed one of the original hedge funds (The Buffett Partnership Ltd) and used his gains to one day purchase Berkshire Hathaway. His evolution into the value investor we now think of today has been long in the making. Make no mistake, Buffett is a hedge fund manager. Yes, he comes from the awful hedge fund clan. Today, he hides behind the curtain of incorporation, but in many ways Buffett hasn’t changed one bit since his Partnership days

Buffett Partner’s is particularly interesting due to Buffett’s recent berating of hedge fund performance and fees. Ironically, Buffett Partners charged 25% of profits over 6% in the fund. This is how Buffett grew his wealth so quickly. He was running a hedge fund no different than today’s funds. And it wasn’t just some value fund. Buffett often employed leverage and at times had his entire fund invested in just a few stocks. One famous investment was his purchase of Dempster Mill in which Buffett actually pulled one of the first known activist hedge fund moves by installing his own management at the firm. Buffett the activist hedge fund manager? That’s right. He was one of the first. Don’t let the folksy charm fool you. His venture to purchase Berkshire Hathaway was quite similar.

Buffett likes for you to think that he just picks up an SEC filing, makes a phone call and seals the deal before he purchases a stock (and snakeoil market salesmen wants you to think this as well), but Buffett is far more savvy than he leads on. This is shown by the complexity of Berkshire Hathaway.Berkshire Hathaway isn’t just your average insurance company. The brilliance behind Buffett’s investment in Berkshire is astounding.

He effectively used (and uses) Berkshire as the world’s largest option writing house.The premiums and cash flow from his insurance business created dividends that he could invest in other businesses. But Buffett wasn’t just buying Coca-Cola and Geico as many have been led to believe. Buffett was placing some (short-term AND long-term) complex bets in derivatives markets, options markets, and bond markets (Yes aka speculation).The myth that Buffett is a pure value investor is just wrong.And it has been fed to the public hook line and sinker by people who entirely fail to understand Buffett’s genius, but benefit from an investing pubic that continues to pour money into the “hold and hope” myth.

Berkshire has grown into one of the most complex financial businesses in the world. The investment portfolio he has become famous for is the equivalent of just about 25% of Berkshire’s market cap. His most famous holdings (Coke, American Express & Washington Post) account for roughly 10% of the total market cap. Interestingly, two of Buffett’s most famous investments weren’t traditional value picks at all, but distressed plays. His original investments in American Express and Geico occurred when both companies were teetering on the edge of insolvency. These deals are more akin to what many modern day distressed debt hedge fund managers do – NOT what other “value” players do.Buying it with bargain hunting

Make no mistake – this old guy is a killer businessman. Just look at the deal he struck with Goldman Sachs and GE in 2008. He practically stepped on their throats, demanded high yielding dividends and the results speak for themselves. Of course, the deal was described by Buffett (all smiles of course) as a long-term value play. Right. If this same move had been achieved by a distressed debt hedge fund (which is a role Berkshire often plays) reporters would have described the fund manager as a thief who was attacking two great global corporations while they were down. But not Buffett, so long as he smiles, talks about Cherry Coke and makes himself sound like a regular old guy the public just smiles and looks for the next Coca-cola with the hope that they will be the next Buffett.(Lol!)

The statistics behind Buffett’s success and wealth are another thing altogether. Warren Buffett is an outlier amongst outliers. Whether his investment decisions are that of genius or pure luck is something I’ll leave to the expert statisticians. What is undeniable is the myth that any small investor can become the next Warren Buffett by employing the techniques of Graham and Dodd. If only it were that easy

Perhaps most interesting in the many myths of Buffett is his involvement in the bank bailouts. Clearly, Buffett had an enormous amount at stake in the financial crisis. Despite his repeated condemnation of derivatives, Buffett actually has a great deal at stake in the derivatives markets. In addition to the Gen Re business and the billions in options he has written on index put options, Buffett’s own portfolio and insurance business were at the heart of the crisis. I think it’s a stretch to say that the solvency of Berkshire was at risk in the Fall of 2008, but just imagine how things might have unfolded if Goldman Sachs had indeed failed? The dominoes in Buffett’s portfolio and behind Berkshire would have started to tumble quite quickly. Something makes me wonder if Buffett would have survived without government aid.

Not surprisingly, Buffett had a hand in the bailouts (but don’t let the mainstream media tell you that). During the height of the credit crisis, Buffett sent Hank Paulson an interesting letter which I have covered in my course.The letter is priceless.Not only does Buffett again take potshots at hedge fund managers (those bastards and their fees!), but he describes personal conversations with Bill Gross and Lloyd Blankfein about how they would all contribute to the bank bailout. Of course, Buffett was talking his book. He knew what was at stake. But it all makes me wonder – was the great Warren Buffett bailed out? Did genius nearly fail? Or has the myth of Warren’s genius failed us all? I have no idea, but what I am certain of is that the media’s misportrayal of Warren Buffett has been astounding and perhaps even damaging to the small investor.

Warren Buffett is a great American and a great investor, but do your homework before investing in the stock market with the idea that you will one day sit atop the throne of Investing to be rich.It just isn’t that easy despite what people will have you believe

Also the important lesson this teaches us is that never believe in any big boots who tells you that their fortunes are made by this way or that around(includes tata, birla and ambani etc).It is logical to assume that people won’t sell the goose that lays the golden eggs.Playing this game is not easy folks :)

Need to become a profitable trader/Investor? Learn Institutional Trading strategies on our premium course and capture market profits-To know more contact +919741204250 or arulbalaji184@yahoo.com

Related Readings and Observations

The post Myths about Warren Buffett and Value Investing appeared first on Marketcalls.

TrakInvest : Virtual Trading Platform for Paper Traders

$
0
0

Trakinvest is a virtual social investing platform currently offering Virtual Exchange , Fundamental and Research analytics for Equity Markets in India,USA,China, Hong  Kong, Singapore, Australia. Founded by a former JP Morgan principal Mr Bobby Bhatia. TrakInvest partners with institutions like Thomson Reuters and Religare to offer sponsored internships to students in emerging Asian markets. Trakinvest is backed by Spark Labs Korea and some really well known individuals and families in the Middle East and India.

Trackinvest1 Trackinvest2

Once you opened the Virtual Account with Trakinvest (Marketcalls Readers can use the following link to gain access to the Virtual Stock Exchange Portal) you will be awarded with 50 Lakhs of Virtual  Money to do paper trading. TrakInvest parnered with Thomson Reuters to provide users access to analytics; the site’s own independent research reports; and its proprietary stock-scoring algorithms. TrakInvest currently has 12,000 reports covering markets and exchanges in countries including Australia, India, China and the U.S.

Trackinvest3

Features

  • Users are provided with Stock based news, Twitter feeds, Research Reports, Fundamental and Sector based analytical tools.
  • Track fundamental ratios and tracking parameters such as their return on equity and earnings per share.
  • Monitoring top traders, researchers and bloggers for investment news.
  • Job/Intership Oppurtunities for Top Virtual Traders.

Overview on Trakinvest Platform

//www.youtube.com/watch?v=1LqZbMZv0_0

Trakinvest APP is also available for android smartphone users. Now one can Trade, learn, and share anytime on the go. Most of the services are free till date but TrakInvest may charge a subscription for premium access to research and some of the advanced features on the website. Definitely it is not a place for Experience traders but mostly students or people who are new to trading usually spend time on such portals. Virtual trading platforms allow them to learn how to trade instead of playing with real money. Currently Indian Online Virtual Exchange Competitors are Moneybhai(Moneycontrol) and Khelostocks.

Bobby Bhatia on Trakinvest

//www.youtube.com/watch?v=qzP4B7dqZKM

Related Readings and Observations

The post TrakInvest : Virtual Trading Platform for Paper Traders appeared first on Marketcalls.

Nifty and Bank Nifty October Futures Positional Trend Update

$
0
0

Nifty Hourly Charts
Nifty October v6

Nifty Futures turned to Positional Buy mode right from Muhurat trading session onward and currently the support zone comes around 7894 and Bank Nifty maintains the positional buy mode right from 9th October onward and currently the support zone comes around 16291 respectively. Reverse your position to positional sell mode if the support zone breaks on hourly charts.

Bank Nifty Hourly Charts
Bank Nifty October v6

India VIX Hourly Charts
India VIX turned to positional sell mode as the vix cools down and settling around 13 levels and the resistance zone comes around 15.35. One can expect volatility in the market if the resistance zone taken out on hourly charts.

India VIX Hourly

Nifty Options Open Interest
This month nifty options open interest builtup is quite tricky. Initially 7800PE is written and once fell down below 7800 shortcovering takes place in 7800PE and option writers started concerntrated on writing 8000CE. But once market recovered from the lows and broken 8000 on the upside now Call writers are focusing on 8100CE. Overall the current sentiment says 8100 is the resistance for the current month expiry as only three more trading sessions left for expiry.
Nifty OI

Upcoming Economic Events
India Calendar

Related Readings and Observations

The post Nifty and Bank Nifty October Futures Positional Trend Update appeared first on Marketcalls.

Price Behavior Analysis-Reliance Playing in the Range

$
0
0

chart-page-0

Reliance is down so far since May-June Phase (see the chart). And also if you notice closely there is no clear trend as price is moving from range to another range with small swings in between,This indicates that decline in price movement is weak and buyers are stepping in at every time stock makes a swing low (Bargain hunting).Right now the price action is moving inside a range so if you consider this stock you can play the futures by buying low and selling high for short term.In case if your are Intermediate/long term player you can consider buying it now or at still lower price. Hey it’s reliance man! Holding this company is not bad for long/intermediate term portfolio

Struggling to become a profitable trader? Take our premium course and turn around your performance-seize market profits.Already more than 100 students have benefited from this.To know more contact us on +919741204250 or arulbalaji184@yahoo.com

Related Readings and Observations

The post Price Behavior Analysis-Reliance Playing in the Range appeared first on Marketcalls.


IS Crude Ready to Fall More?

$
0
0

Crude(30.10.2014) fall sharply in last couple of weeks & likely continue.

Now crude is trading around $81.30 & we can see on charts crude unable to trade able broken support area of $84.20 while a formed a very bearish candlestick pattern just below the resistance. The minor ascending channel broken by crude suggest that consolidation done here & we may witness more downfall in coming trading sessions. Technically crude may find support at $79-77 area but before the hidden negative divergence (LH/HH) will do its job.

On fundamental side, crude inventories continue rising while end of QE3 & slowing economy from europe & china will put more pressure.

crude oil

Based on above studies, crude probably downside for possible targets around $79.20 & then $77.30 in coming trading sessions. However a day close above $84.20 will reject the forecast.

 
Note – Above technical analysis is not a buy/sell recommendation. For recommendations Contact Us 

Related Readings and Observations

The post IS Crude Ready to Fall More? appeared first on Marketcalls.

FED Ends it’s Big Bond Buying Program – Watch out !

$
0
0

$0 — that is how much the Federal Reserve will buy in mortgage and treasury bonds next month. As widely anticipated the Federal Open Market Committee announced the end of its multi-year asset purchases Wednesday.In case you haven’t been watching, every month in 2013 the Federal Reserve purchased $85 billion worth of bonds, the peak of what was ultimately 37 months in a row of buying. The program, known as Quantitative Easing, was a key component of the central bank’s attempt to simulate job growth in an American economy that was still struggling to come back from 2008 recession.After months of speculation brought on a when the Fed Chairwoman Janet yellen will signal a tightening phase (Markets Pricing it in and out of and on) Now it happens as FED officially ended the Asset purchases yesterday and moving towards First rate hike cycle (Many are expecting it to happen around Q2 2015).The committee promised to keep a close eye on incoming economic data but told investors— barring significant changes to its outlook that the economy was moderately expanding — they should expect the same small measured cuts.

Market’s Reaction
Prior to the meeting you would have hard pressed to find an investor who did not see this latest policy move coming, however, the initial market reaction to the FOMC statement was slightly stronger than many anticipated. Major indices were mixed in morning US-trading, with the Dow Jones Industrial Average and S&P 500 trading up but the Nasdaq Composite in negative territory. By the time however, all three were trading in the red, albeit the S&P and Dow down just about 0.2% versus the Nasdaq’s 0.7% slide. In the half hour following the release of the S&P was down 0.5% at 1,975 points. The Dow was down 0.4% at 16,939 points. And the Nasdaq was down 0.8% at 4,528 points. The 10-year Treasury note yield was up about 4 basis points prior to the announcement at 11.30 (IST) and maintained that level following the release.While most Fed watchers agree the statement is hawkish, they are not in agreement about what that means for rates.

What it means for Emerging markets including India?
FED leaves Emerging Markets exposed.For six years, emerging markets have lived in a world defined by the US Federal Reserve’s policies of easy money. Tides of liquidity have flowed from developed to developing economies, financing infrastructure and corporate investment and allowing consumers to indulge credit-fueled retail dreams.Thus, the Fed’s announcement on Wednesday that it would draw quantitative easing to an end represents both a watershed and upcoming trouble.The end of asset-purchases comes at a challenging time for emerging markets, beset by a confluence of adverse and interconnected trends. China’s economy is slowing,Brazil will see massive outflows,South Africa’s economic reports are somewhat muddy.Expect India where Modi premium is taking a toll on Investor’s confidence,BRC’s are in deep watershed issues

Sensex and MSCI EM Performance During QE Period

Even without the Global downturn, monetary tightening by the US is a dangerous time for emerging markets.The unwinding of the US monetary stimulus has underpinned an appreciation by the US dollar (think about Exchange rates around mid 2013 where USD/INR jumped to 70),In the minds of many analysts, the future depends on what the Fed does next. If it moves swiftly to a more hawkish monetary policy, leading ultimately to a rise in US interest rates, the result for emerging markets could be stark.

But still hopes..
Nevertheless, even with all the negative signals, there are silver linings. Falling commodity prices are leading to ebbing inflationary pressures in much of the emerging world, giving central banks latitude to keep monetary policy loose. And while the Fed has drawn its asset purchases to an end, the Bank of Japan is still busy buying government bonds. The European Central Bank may follow suit if growth in the eurozone continues to disappoint. The era of abundant liquidity is by no means over.

Want to be a profitable trader? Get trained by a former institutional trader-Learn Institutional Trading strategies and capture market profits to know more contact +919741204250 or arulbalaji184@yahoo.com

Related Readings and Observations

  • Gold Rally Could Continue. Gold (16.10.2014) traded higher as per our article published on sep. 24th & reach to $1240 mark with some if & but. This time lets start with some economic fundamentals, US doing […]
  • Is Solar Power a “Good” Investment? The idea that solar power may soon be everywhere isn’t nutty anymore. The price of solar panels has plunged more than 80 percent in the past five years and is expected to keep […]
  • Nifty Hourly Charts – Gann Charts Clear Resistance near 4440-4450 zone. If resist near then in short term nifty willlikely to test 4280 zone. Breakout above 4450 Zone Source: www.marketcalls.in
  • Ideal Nifty Trade for 07 Dec 2009 Ideal Nifty Trade : Hold Longs only if Nifty opens above 5121 and holds on hourly basis make a trailing stop loss just below 5121.   Resistance Near 5220 and Supports at 5050 […]

The post FED Ends it’s Big Bond Buying Program – Watch out ! appeared first on Marketcalls.

NRI’s BENFITS from Double Taxation Avoidance Agreements (DTAA)

$
0
0

Double Taxation Avoidance Agreements (DTAA)

taxesThe Double Tax Avoidance Agreements (DTAA) is essentially bilateral agreements entered into between two countries, in our case, between India and another foreign state. The basic objective is to avoid, taxation of income in both the countries (i.e. Double taxation of same income) and to promote and foster economic trade and investment between the two countries. The advantages of DTAA are as under.

Currently India has comprehensive DTAA or Tax Treaty with 84 other countries.

The advantage of DTAA are as under,

  1. Lower Withholding Taxes (Tax Deduction at Source)
  2. Complete Exemption of Income from Taxes
  3. Underlying Tax Credits
  4. Tax Sparing Credits


The Provisions of DTAA override the general provisions of taxing statue of a particular country. It is now well settled that in India the provisions of the DTAA override the provisions of the domestic statute. Moreover, with the insertion of Sec.90 (2) in the Indian Income Tax Act, it is clear that assessee has an option of choosing to be governed either by the provisions of particular DTAA or the provisions of the Income Tax Act, whichever are more beneficial.

The Non Resident can certainly take the benefit of the provisions of DTAA entered into between India and the country, in which he resides, more particularly in respect of Interest Income from NRO account, Government securities, Loans, Fixed Deposits with Companies and dividends etc. This is explained below: –

For the Assessment Year 2012-2013,

Withholding Tax Rate (TDS) under the Indian Income Tax for Interest Income – 33.99% whereas,

Rate of Tax prescribed in the DTAA with the country where Non Resident resides e.g. Singapore – 15%

Therefore, chargeable rate will be 15 % (Lower of the Two)

Every Non Resident should choose lower of the tax rate prescribed in DTAA with the country where he resides and the tax rate prescribed under the Indian tax laws.

How to avail benefits under the DTAA

Any NRI can avail benefits under the DTAA by timely submission of documents listed below to the deductor.

  1. Tax Residency Certificate (TRC)
  2. Self-attested copy of PAN Card
  3. Self-declaration cum indemnity format (formats of such letter are availabe in the bank website)
  4. Self-attested copy of Passport and Visa
  5. Copy of PIO Proof (applicable if the passport has been renewed during the Financial Year)

Mandatory details to be included in the TRC

  1. Name of the assessee
  2. Status (individual, company, firm etc.) of the assessee
  3. Nationality (in case of individual)
  4. Country or specified territory of incorporation or registration (in case of others)
  5. Assessee’s tax identification number in the country or specified territory of residence or in case no such number, then a unique number on the basis of which the person is identified by the Government of the country or the specified territory
  6. Residential status for the purposes of tax
  7. Period for which the certificate is applicable
  8. Address of the applicant for the period for which the certificate is applicable

The certificate containing above details should be duly verified by the Government of the country or the specified territory of which the NRI claims to be a resident for the purposes of tax.

How to obtain the TRC

You can approach the tax/government authorities of the overseas where you reside to obtain the TRC. You may also check with your Chartered Accountant / Tax Consultant abroad on the procedure to obtain the same. Remember! No other document in lieu of the TRC is considered for availing the benefits under DTAA.

Now the question may arise, whether you need to submit these documents every year to avail benefits under the DTAA? Answer is Yes! DTAA benefit is extended on an annual basis. Therefore, any NRI is required to provide all the requisite documents every year to continue availing the benefit under DTAA.

Also what happens if one (here NRI) doesn’t submit TRC and other documents to the bank within stipulated timelines? In such case, the bank will have to deduct interest earned on NRO deposits at the presently applicable rate of 33.99%.

Question to All.

You are Indian NRI & now shift to UAE & earn 50 Cr their & transfer that amount to your Indian bank account. Now FD interest rate at India is 9% where as Interest arte at UAE is 1%…& due to DTAA UAE taxes are 0% where as Indian taxes are 33.99%… so By doing DTAA those people get Interest @9% & pay taxes @ 0 %….


Lokesh Madan


Related Readings and Observations

The post NRI’s BENFITS from Double Taxation Avoidance Agreements (DTAA) appeared first on Marketcalls.

Why your NSE Datafeed will not work on Nov 5th and Nov 7th?

$
0
0

NSE in its recent circular stated that its is planning to test Live trading sessions from Disaster Recovery (DR) Chennai site. It is noted that the nse authorized data vendors who are not having leaseline/VSAT connectivity with chennai exchange might not able to provide datafeed to its customers on Nov5th and Nov 7th.

Why NSE Exchange is testing Disaster Recovery Solution

According to Gartner Research, “40% of all companies that experience a major disaster will go out of business if they cannot gain access to their data within 24 hours.” so most of the big players in the industry goes for Business Continuity Planning(BCP)/Disaster Recovery.

The major advantages of establising a Disaster Recovery Site are

  • Protect against calamities like earthquake, fire and flood.
  • Minimizes disruption and operational losses
  • Restore and build back confidence of investors, stakeholders and customers
  • Manage the recovery operation in an organized and effective manner
  • Manage brand image and reputation

Who will Suffer?

Retail traders and Algorithmic traders who are getting datafeed from authorized data vendors like Globaldatafeeds, Neotradeanalytics, Reliable, Spider, Icharts,Tickerplant etc might not get data from the NSE Exchange due to lack of connectivity with the NSE Disaster Recovery exchange. However Big data players in this segment like Bloomberg, Interactive Data might go for the connectivity to avoid complaints from their potential customers.

Global datafeeds in its mail to customers stated that,

NSE is conducting Live Trading Sessions from their Disaster Recovery Site on following dates. Since we do not have connectivity with Disaster Recovery Site of NSE, it is almost certain that realtime as well as historical data for 5th and 7th November 2014 will not be available through our data products. Kindly inform your clients.

NSE Live Trading Disaster Recovery

We have received a communication from NSE recently (on 28th October 2014) about the same. This circular is available on NSE site (http://www.nseindia.com/content/circulars/CMTR27907.pdf) and is available as a link through Circulars page (http://www.nseindia.com/content/circulars/circ_cmt2014.htm). This is for the first time NSE is conducting a Live Trading Session from DR Site.

We wish to clear our stand as to why we have not taken connectivity with NSE’s Disaster Recover Site – below.

  • No Utility Value - We already have independent primary and backup connectivity through different Service Telecom Providers with NSE Servers. Existing Backup Connectivity is almost redundant and is hardly used (3-4 times a year). Under this scenario, we do not see any utility value in adding another connectivity.
  • No Utility Value (most important) – In last 6 years since the time we are disseminating NSE datafeed (since 2009), we have not seen a single failure where both NSE Primary and Secondary network have failed resulting in non-receipt of data. So taking connectivity with DR site is not going to have any positive effect on deliverables as it is going to remain unused (going by experience of last 6 years).
  • Does not make Commercial Sense - NSE has their DR site at Chennai. Telecom Service Providers are asking for a huge sum for connectivity (in several lakhs per anum). It does not make any commercial sense for us to go for it as it is not adding any value to our deliverables. There is also considerable cost involved in maintaining this redundant connection (so that it works during actual emergencies – which we have not seen in our lifespan with NSE).
  • Connectivity through internet is not available - MCX provides data through leased lines as well as internet. We have requested NSE to make similar facility available to data vendors so that they can connect to DR Site ‘on demand’ over internet (during planned mock / live sessions as well as real emergencies). This will relieve data vendor from the cost and efforts of having and maintaining a physical leased line connectivity. We are yet to hear from NSE on this.
  • Like Brokers, TAP Facility is not extended to data vendors - NSE provides TAP facility to all their brokers (as can be seen in above circular). It means that brokers can select where they wish to connect (Primary site or DR Site) simply by selecting a radio button. Brokers are not required to take point-to-point connectivity with the DR site of NSE and this is managed by NSE on their behalf. We have requested DotEx to provide similar TAP facility to us (data vendors) and till the time TAP facility is ready, relay data from DR site through Primary Connection (this was done before for mock trading session from DR site) but Exchange is not ready to commit anything on the guaranteed availability of data on above dates.

From time to time, we have communicated our stand on DR site connectivity to NSE. We are hopeful that NSE will relay data through Primary Connection on above dates. But since NSE is not in a position to commit guaranteed availability, we too are not in a position to give any assurance about availability of data on above dates (realtime, historical as well as IEOD).

This is very unfortunate but we have no option. We have tried hard (and still trying) so that datafeed would be available on above dates. If we do not succeed in our efforts and if we could not disseminate data on 5th and 7th November 2014 as per this communication, we would add 2 days to your subscription (for NSE F&O and NSE CDS Subscribers) as per our policy.

Through this mail, we wish to keep you informed about the scenario. We request you to be prepared and make alternate arrangement for the datafeed on above dates (5th and 7th November 2014).

Will the customers get IEOD data after market hours?
Still no confirmation on that. Players are negotiating with the exchange and will update here once clarity is arrived.

Will my MCX feeds also gets affected?
No MCX Feeds will not be affected

Will the Brokers also face such issues?
No such

Disclosure: Marketcalls is a reseller for Globaldatafeed products.

Related Readings and Observations

The post Why your NSE Datafeed will not work on Nov 5th and Nov 7th? appeared first on Marketcalls.

MCX Currency Novemeber Futures Trend Overview

$
0
0

USDINR spot on last friday closed at 61.37 which is a two week low. The currency depreciated on the back of the US Federal Reserve meeting on Wednesday winded up its QE tapering program and Yen fell to a seven-year low against the dollar on Friday as the Bank of Japan surprised financial markets by significantly expanding its massive stimulus programme which is followed by global rally in the equity market. Almost all the MCX currencies (USDINR, EURINR, GBPINR, JPYINR) November month futures maintains a positional sell mode and we can expect rupee strengthening across all the major currencies trading in MCX-SX Exchange.


USDINR Hourly Charts
USDINR

Positional resistance zone for USDINR comes around 61.90
Positional resistance zone for EURINR comes around 78.03
Positional resistance zone for GBPINR comes around 99.13
Positional resistance zone for JPYINR comes around 56.14

Strategy will turn to positional long mode if the resistance zone breaks above on the hourly charts.


EURINR Hourly Charts
USDINR Hourly Charts
EURINR

GBPINR Hourly Charts
GBPINR

JPYINR Hourly Charts
JPYINR

Related Readings and Observations

The post MCX Currency Novemeber Futures Trend Overview appeared first on Marketcalls.

Viewing all 2070 articles
Browse latest View live


Latest Images