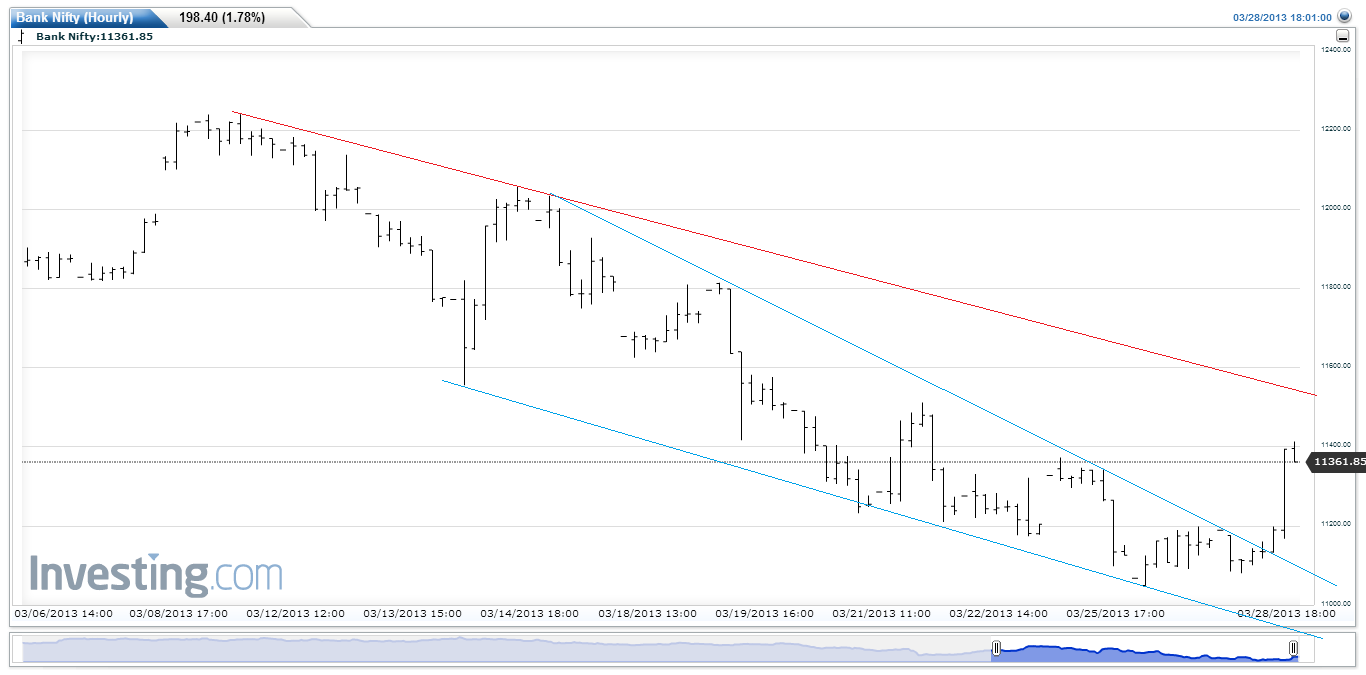
Bank nifty has gave breakout of falling wedge on hourly chart .11420-30 is an resistance zone as per line chart which is comfortably above 200dma. above which it can face resistance at falling red channel line. Close above 11420 will generate a buy signal in bank nifty, first sign of weakness on close below 5DSMA.
Plan your trade accordingly.
Happy Trading
DISCLAIMER:
All the views and contents mentioned in this blog are merely for educational purposes and are not recommendations or tips offered to any person(s) with respect to the purchase or sale of the stocks / futures. I do not accept any liability/loss accruing from the use of any content from this blog. All readers of this blog must rely on their own discretion and neither any analyst nor any publisher shall be responsible for the outcome.
Related Readings and Observations
The post Falling wedge Pattern Formation in Bank Nifty appeared first on Marketcalls.