Nifty April Futures 500 Tick Charts
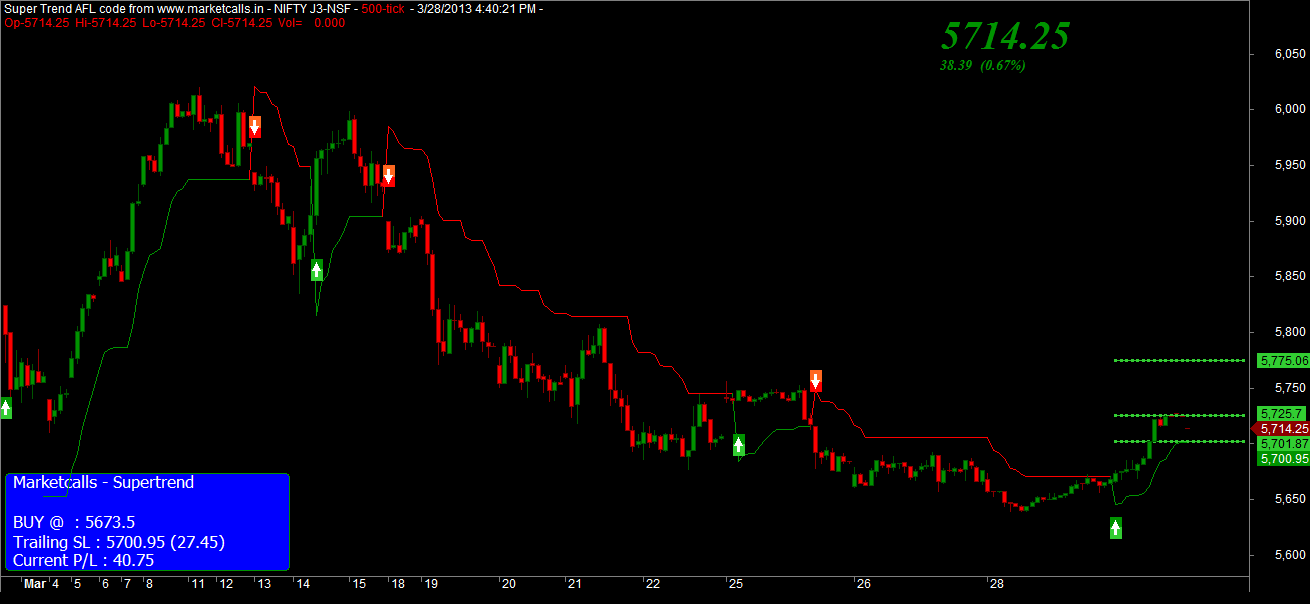
Nifty April futures 500 Tick Charts turns to positional buy mode on 28th March 2013. Trailing Stoploss zone come near 5700 and CMP : 5714. Revese the position the sell if Nifty breaks 5700 on the 500 Tick Charts. The monthly Market Profile on Nifty spot charts shows that the POC zone are developed near 5612 and 5677 respectively. The Value Area High (VAH) 5850.90 and Value Area Low (VAL) is at 5634 respectively.
Nifty April Futures Daily Profile Charts
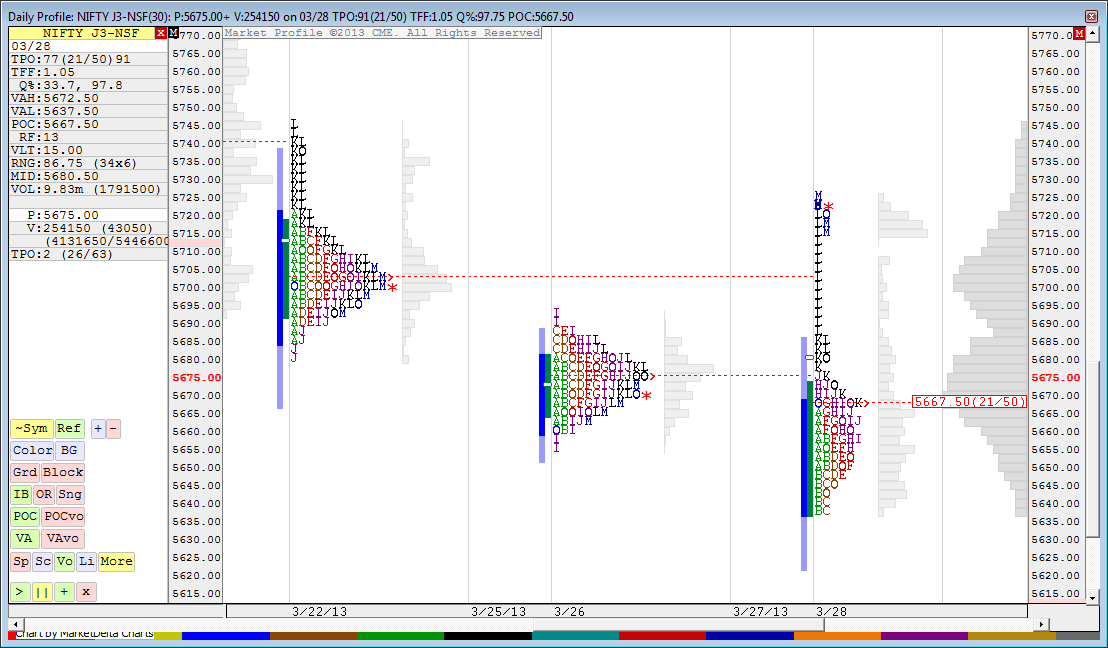
Nifty April Futures market profile (Daily Profile) Charts showing 5677 is the POC for the next day trading indicating that 5677 could be the support zone for the day.
Nifty Spot Monthly Profile

Related Readings and Observations
The post Nifty Futures 500 Tick Charts and Monthly Profile Update appeared first on Marketcalls.