Here is a little Bid Vs Ask Dashboard for Amibroker users which helps to monitor the Bid-Ask Spread during live trading. In a highly liquid market the Bid Ask spread difference will be very thin whereas in a illiquid script the Bid-Ask spread get wider due to less number of buyers and sellers.
How to Get Bid Vs Ask Data
Amibroker supports a function called getRTdata() to retrive realtime data fields like Bid, Ask, BidSize, AskSize, Volume, Last…etc. refer here for more detailed reference
Requirements
1)Realtime Data Subscription Supporting Bid, Ask, BidSize, AskSize, Volume, Last.
2)Preferably Amibroker 5.6 verion or above.
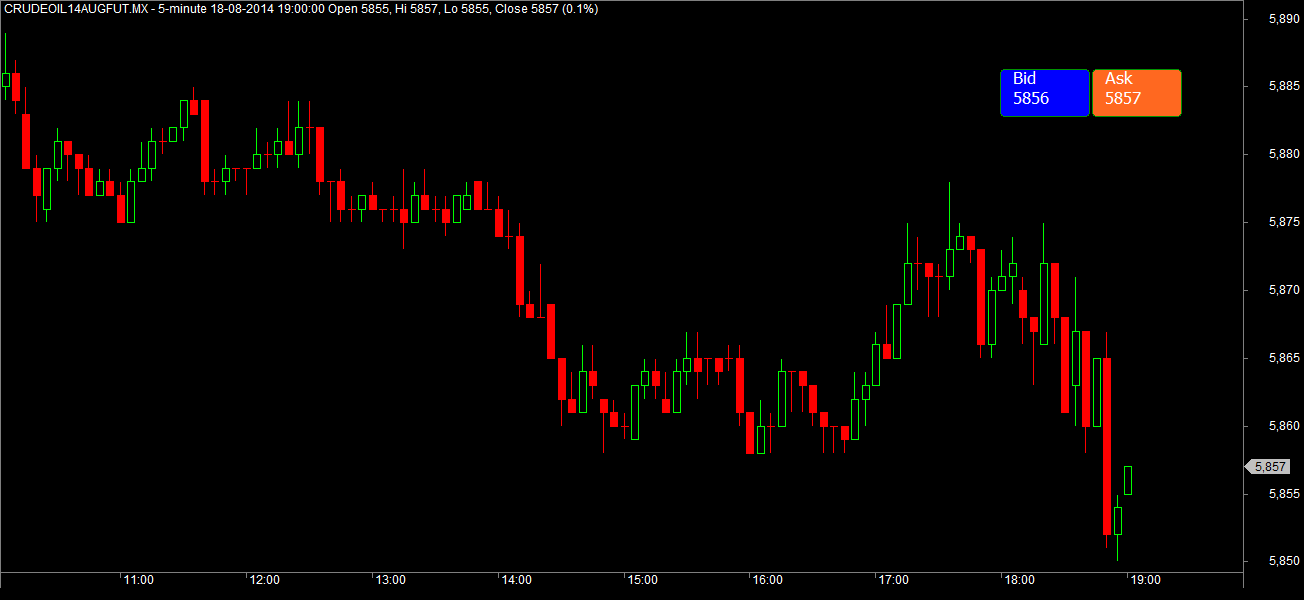
Crude Oil Bid Vs Ask Dashboard
Steps to Install Bid Vs Ask Dashboard
1)Downlad Bid Vs Ask Dashboard Amibroker AFL Script
2)Unzip to local folder and Save the AFL script in C:/Program Files/Amibroker/Formulas/Basic Charts folder.
3)Now goto File->New Blank Chart and Apply the Candle Stick Chart or your favorite Trading System
4)Now goto Charts->Basic Charts->Bid Vs Ask. Drag and Drop it to the Charting Space.
5)Bingo you are done. Now you should be able to see the Bid Ask Dashboard as shown above.
Related Readings and Observations
The post How to Plot Bid Vs Ask Dashboard in Amibroker appeared first on Marketcalls.