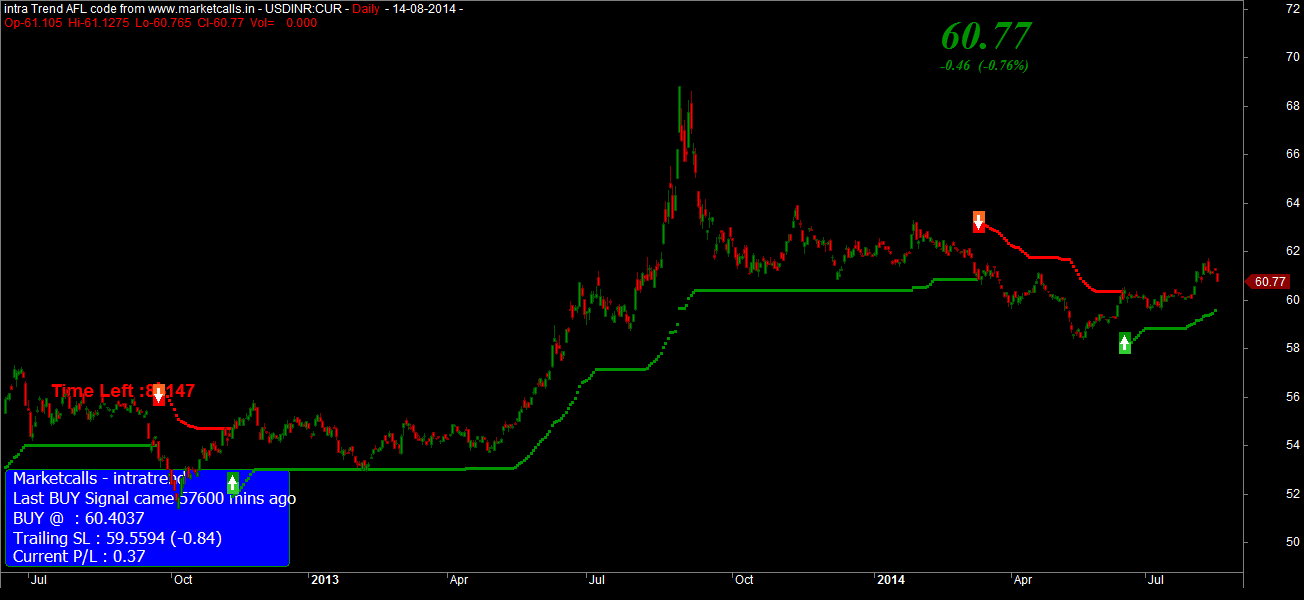
USDINR Spot Price – Daily Chart
![USDINR]()
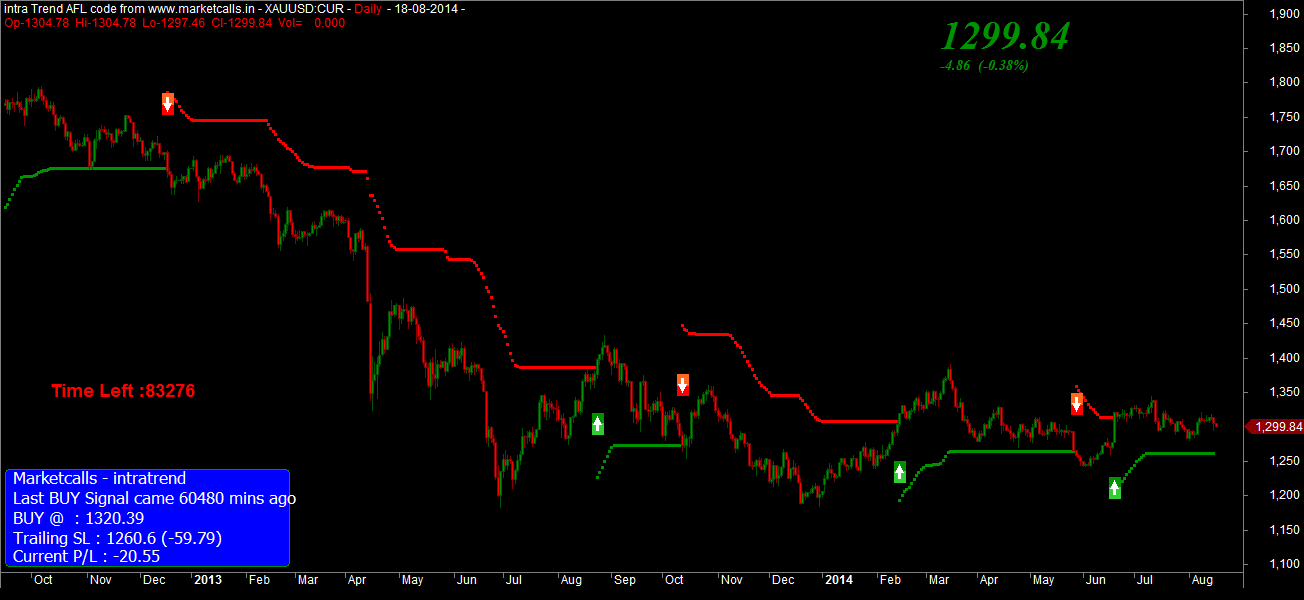
Currently both USDINR and Gold maintains a medium term buy mode. And the support zone comes around 59.55/Dollar and 1260.6 respectively. Outlook will turn bearish if the support zone breaks on the Daily Charts.
Gold Spot Price – Daily Chart
![GOLD]()
Related Readings and Observations
- Triangle Breakout in Gold Daily Charts Now gold is trading around $1301 & we can see on charts, gold was able to provide a triangle breakout. This breakout was very much awaited after gold placed a bullish candlestick pattern […]
- Lead on Reversal Pattern. Now Lead is trading at 2226 on LME & as we can see on charts, lead was able to produce a negative candlestick pattern after touching the topline of short term channel . The top line was […]
- USDINR Long Term and Short Term : July Month Overview USDINR on the daily charts very recently turned to long term buy mode since 16th June 2014. Currently the EOD support comes near to 59.06. USDINR will turn to long term sell mode if the […]
- Will Gold Resume Downtrend Move Again Now gold is trading around $1271 mark & as we can see on charts, gold retested the upper tradeline of minor descending channel & placing a bearish candlestick pattern once again […]
The post USDINR and GOLD Spot Price Medium Term Outlook appeared first on Marketcalls.
![]()