This tutorial explores how to build Put Call Ratio (Open Interest) chart in Amibroker for the any given Option Instrument. Since creating a PCR chart involves multiple Option Strike price and it is a composite indicator it can be achieved in Amibroker using Addcomposite function.
About Addcomposite Function
Bascially the concept behind AddToComposite is that we run our afl code (using Scan feature) through a group of symbols performing some calculations. We will compute some multiple security statistics and store the results in the artificial ticker created using AddToComposite function.
Requirements
Before building the PCR(OI) composite indicator here are some of the prerequisites
1)Amibroker Trial/Licensed Version
2)Realtime Data Subscription / IEOD data for NSE Future and Options Segment which supports Open Interest Data.
3)Knowledge to Create Watchlist and Scanning in Amibroker.
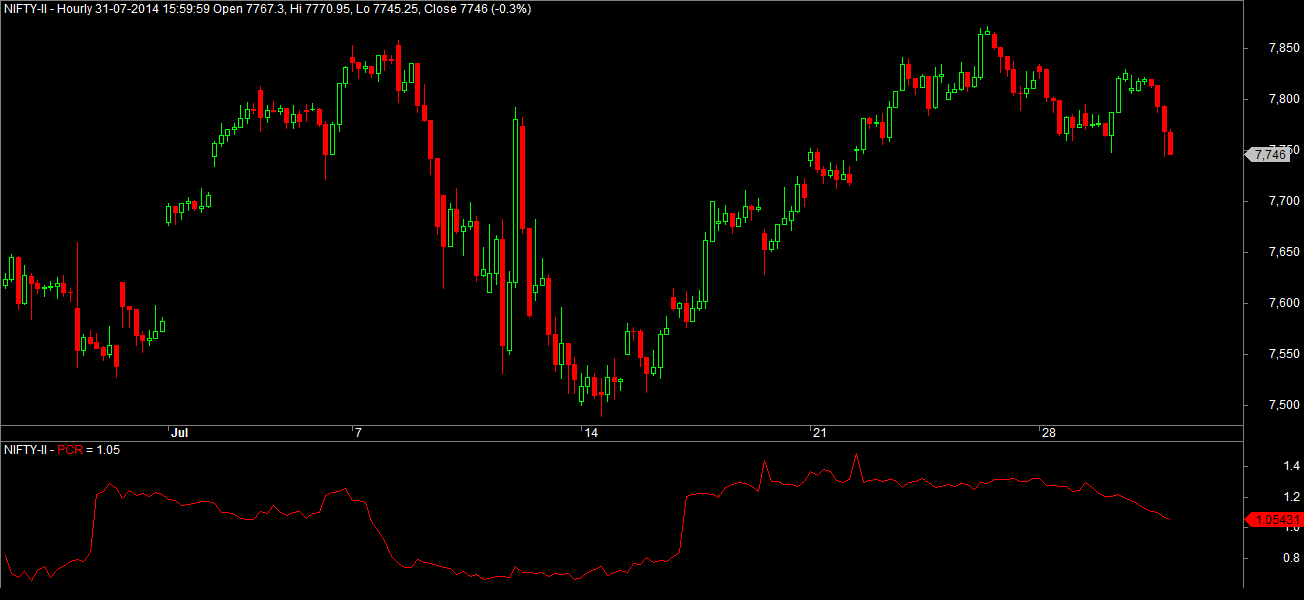
July PCR Chart below July Futures Price Chart

What to Calculate in the Composite Indicator?
1)We need to calculate the Total Open Interest of Call for the particular option series and push it to the Artifical Ticker ~niftyoice
2)1)We need to calculate the Total Open Interest of puts for the particular option series and push it to the Artifical Ticker ~niftyoipe
3)Now divide ~niftyoipe/~niftyoice and plot the results on the charts.
Aug PCR Chart below Aug Futures Price Chart
Steps to Create Put Call Ratio Chart
1)Creating Watchlist
Create a Watchlist with the Strike Price of Option symbols belongs to the same series(includes PE and CE as shown below). For Ex push all the Nifty Option symbols of August 2014 series in a watchlist. (Manual Work takes lots of efforts the best way is to use the search function and select the list of option symbols and push it to the watchlist).
2.Install the Indicator
i)Download Put Call Ratio – Amibroker AFL code
ii)Unzip Put-Call-Ratio-OI.afl_.zip to local folder
iii)Copy Put-Call-Ratio-OI.afl file to \\program files\\amibroker\\formula\\basic folder
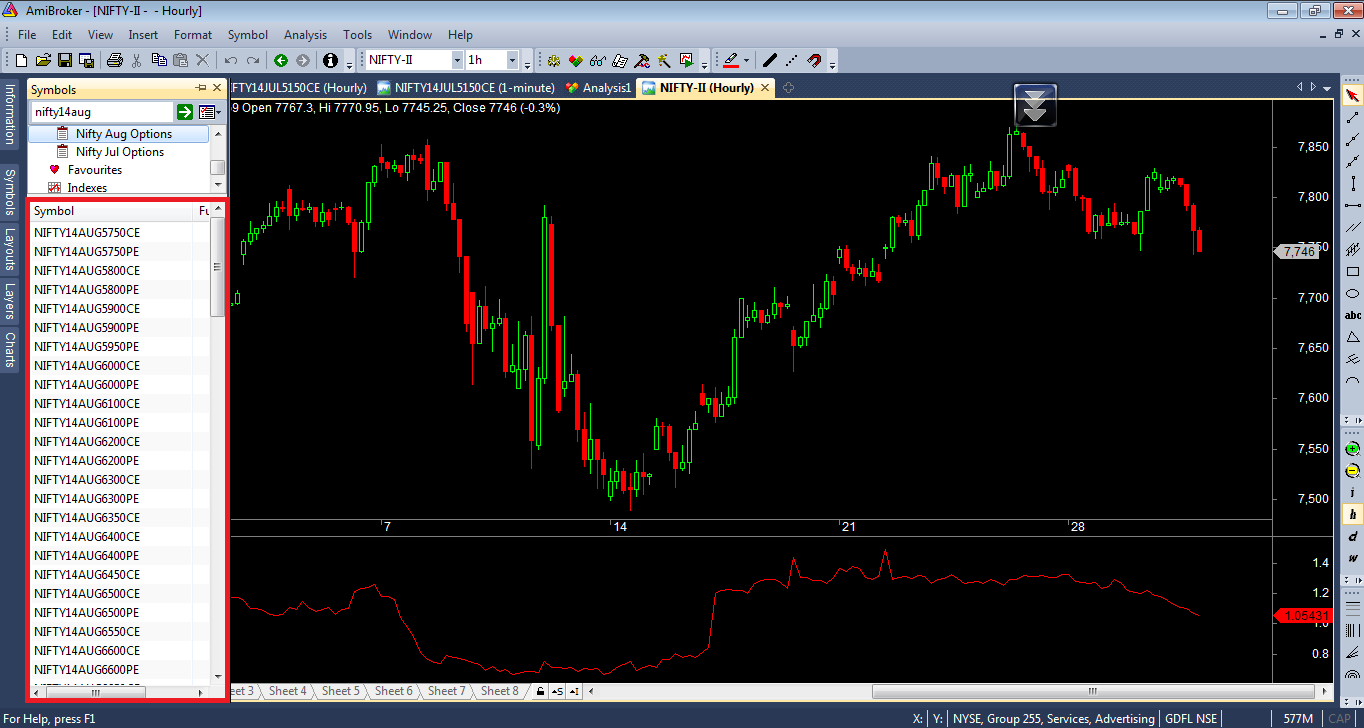
iv)Open Amibroker and Open a New Blank Chart
v)Apply Plain Candle stick chart
vi)Insert PCR chart below the Plain Candle Stick chart (you dont see any charts until you perform scan)
3)Perform Scan
i)Open New Analsis and Select the Put-Call-Ratio-OI.afl file from \\program files\\amibroker\\formula\\basic folder.
ii)Set the timeframe to hourly

iii)Set the filter settings as shown below. In this example Nifty August series watchlist is selected.

iv)Now Press the Scan Button. This attempt will create the Artificial symbols ~niftyoice and ~niftyoipe
Now get back to the chart and you should be able to see the Nifty futures candlestick chart along with August PCR chart below the nifty futures price chart. You can perform an auto scan to update the PCR chart at regular scanning intervals.
Related Readings and Observations
The post How to Build Put Call Ratio Chart in Amibroker? appeared first on Marketcalls.