Nifty 500 Tick Charts
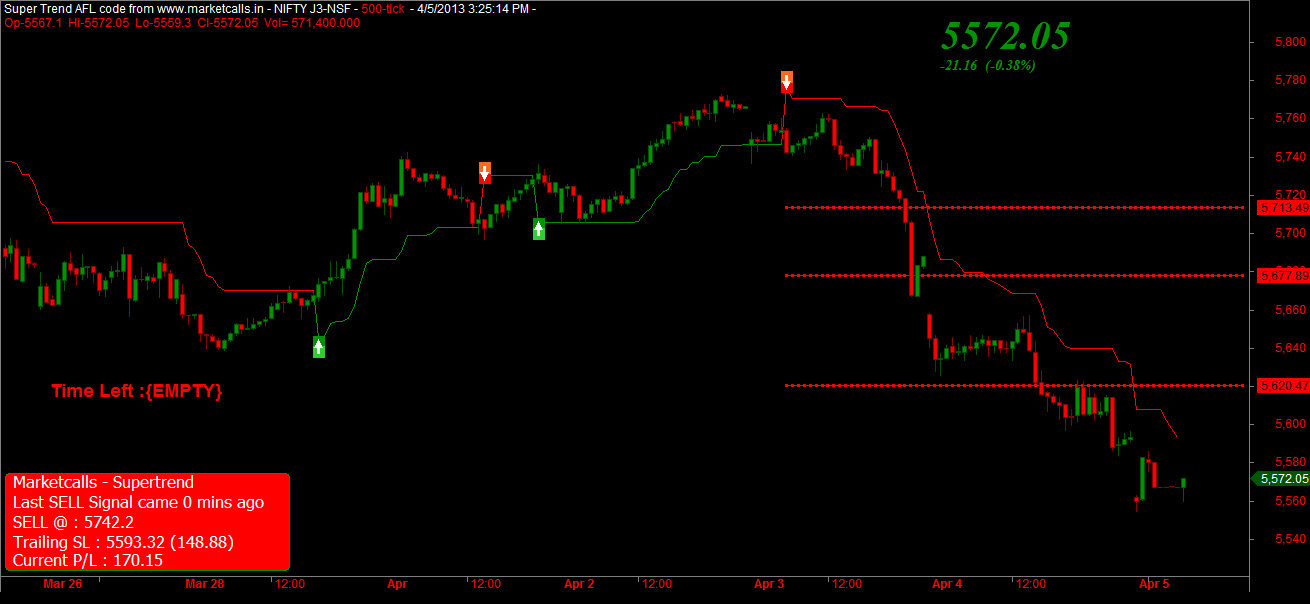
Nifty futures is in strong sell mode since 3rd April and currently the resistance zone is coming near 5593.2. Reverse your position to positional buy if the resistance zone breaks on the 500Tick Charts.
Nifty Futures Daily Profile Charts
From the Profile Charts Value Area High (VAH) – 5592 and Value Area Low – (VAL) at 5570 and the Point of Control (POC) at 5580. Nifty Opening above VAH could turn the sentiment positive and could attract more buyers.
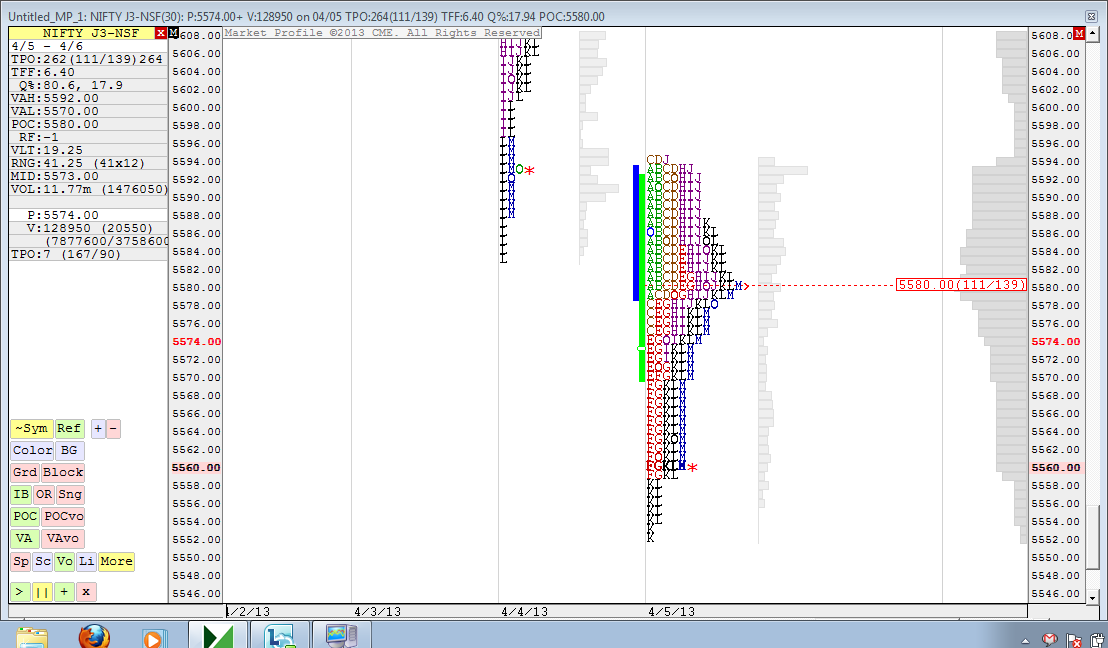
Nifty Market Profile Replay charts shown below with x120 Market Speed from Market Detla. Blue Zone Represents Initial Balance(IB) and the Green Zone Represents Value Area(VA) and the Red line represents Developing Point of Control(DPOC) of the day. Each Letter Represents 30min of duration. For more here for more Market Profile charts
http://www.youtube.com/watch?v=FiK_nu8Je2Q
Related Readings and Observations
The post Nifty Futures Tick and Daily Profile Charts for 8th April 2013 appeared first on Marketcalls.