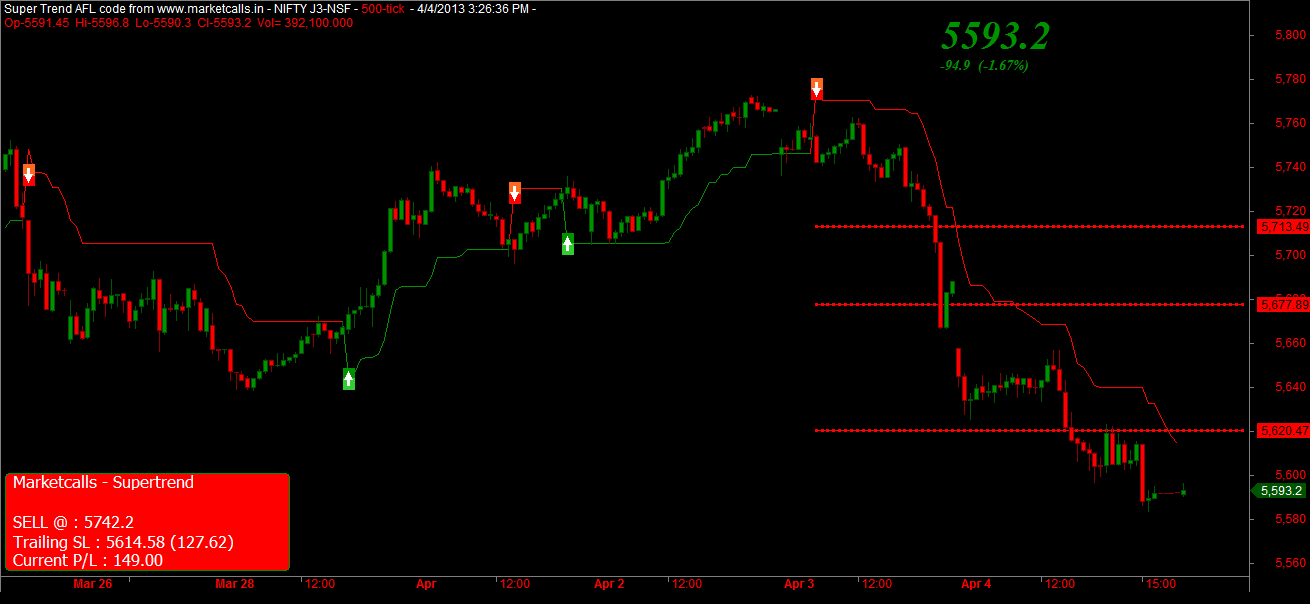
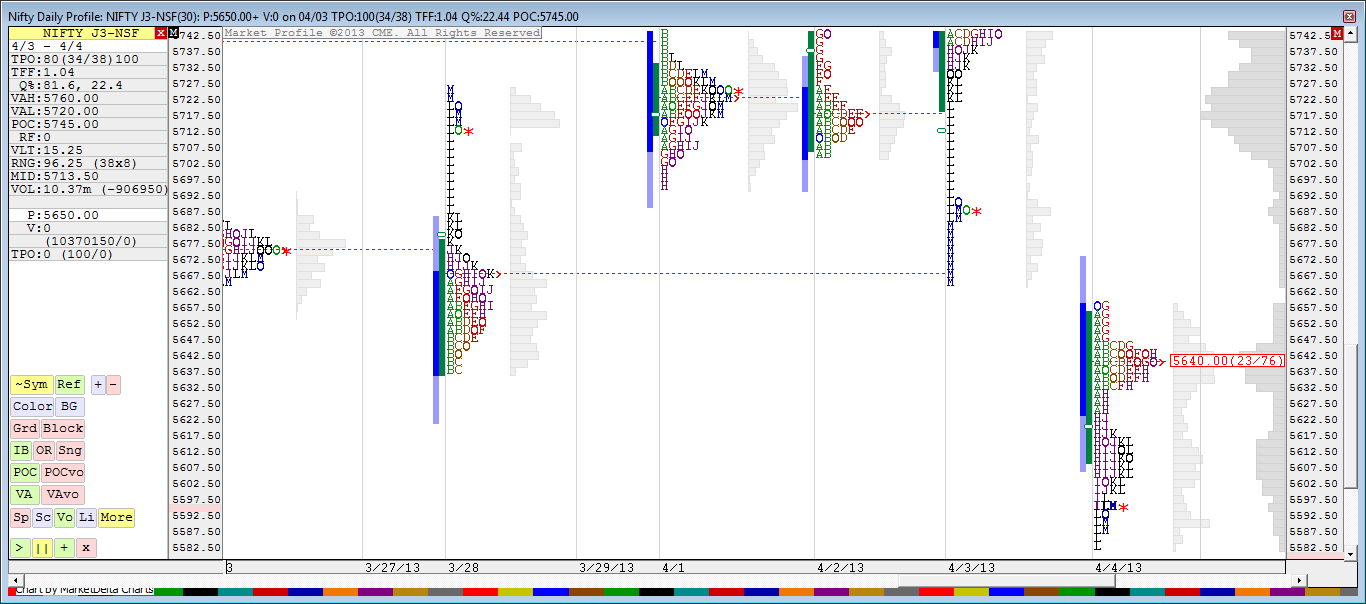
Nifty 500 Tick Charts is in sell mode since 3rd APR 2013, Currently the Resistance zone is coming near 5614. Go long in Nifty only if the Resistance zone breaks on the upper side on the upperside. On the Daily Profile Charts the Value are high (VAL) is at 5655, Value Area Low is (VAL) at 5610 and Point of Control (POC)at 5640
Related Readings and Observations
The post Nifty 500 Tick Charts and Daily Profile Update for 5th April 2013 appeared first on Marketcalls.


