Welcome to Market Profile Series. In the last tutorial we seen Poor High and Poor Low. In this tutorial we will be seeing couple of examples on Excess. Excess generally indicates end of auction and the start of another. Generally Excess is seen in the extremes of the profile with strong pullback as shown below. Excess occurs across various timeframes (Hourly, Daily, Weekly Charts)

Here is a simple example from Nifty FEB 2016 contract. You can clearly notice that the letter G- Period dropped to fresh low followed by sharp pullback (almost 90 points recovery from the lower extreme) followed by price moved to the other side of the Intial Balance. Such sharp pullback with longer tail extremes are often called as excess.
No Excess(lack of Excess)
No Excess is a situation where the shorter term bottom/top is made followed by a lazy pullback(poor low or poor high). However no tails are noticed at the profile extremes (lack of excess). Such zones have high probability of revisit in the short run.
How to Differentiate between Excess and Failed Auction?
If you are familiar with Failed Auction then both the terms Excess and Failed Auction sounds similar to you. How to differentiate both? Well Failed Auction is nothing but weaker excess and the probability of revisiting those zones are more likely within t+5 days. However from the practical experience it may take more than t+5 also. Very Recently we observed Failed Auction Pattern in Gail Jan Futures it literally taken t+8 days to clear the failed auction high.
Failed Auction is coined by Mr Ray Barros and it is not part of classical Market Profile study. To differentiate Failed Auction (Weak Excess) most of the time occur during the intermediate trend reversal zones. However Strong Excess only occur during the end of the trend and the occurrence is not very common.
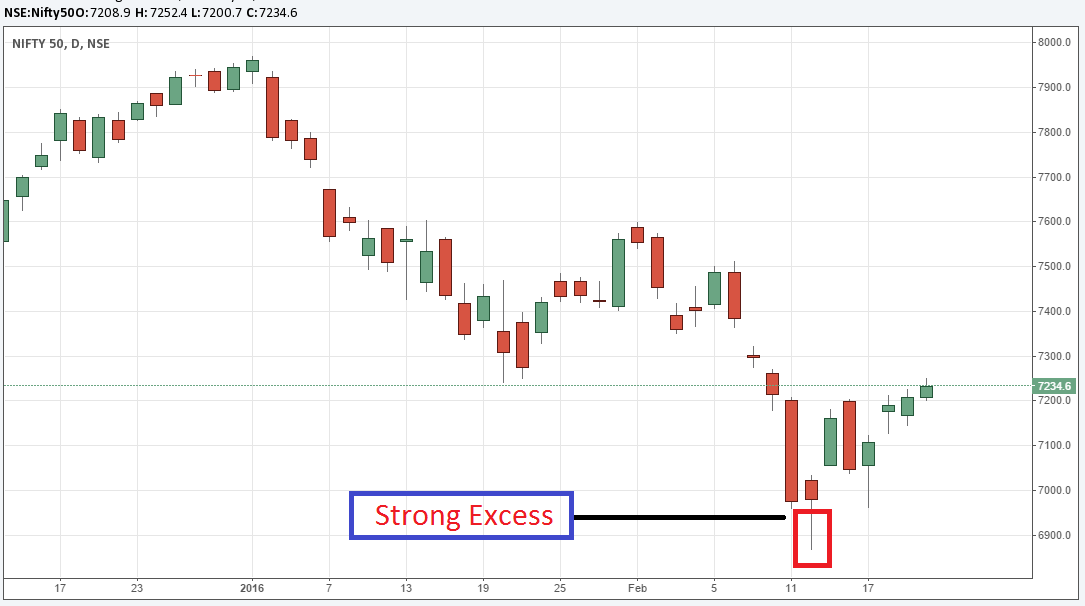
Excess on Nifty Spot Daily Charts
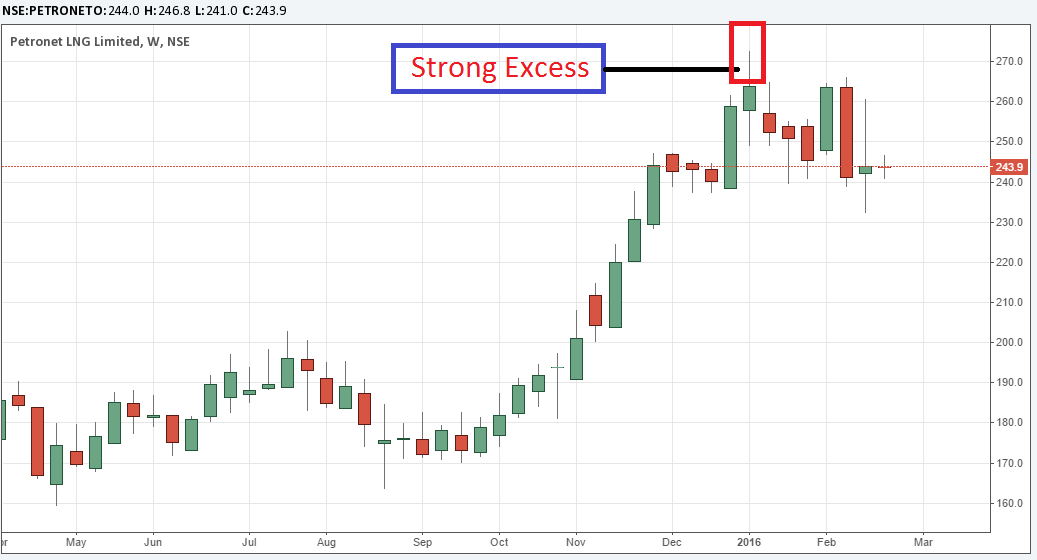
Excess on Petronet Weekly Charts
When the volatility in the market is high and if you are able to spot excess/failed auction it is advisable to consider carry forwarding the information near to EOD. Identifying Excess/Failed Auction and trying to play the rules intraday could be trickly especially in a highly volatile environment.
In the next tutorial we will be discussing more in-depth about Value Area , POC and VPOC Concepts.
The post Market Profile – Excess (End of Auction) appeared first on Marketcalls.