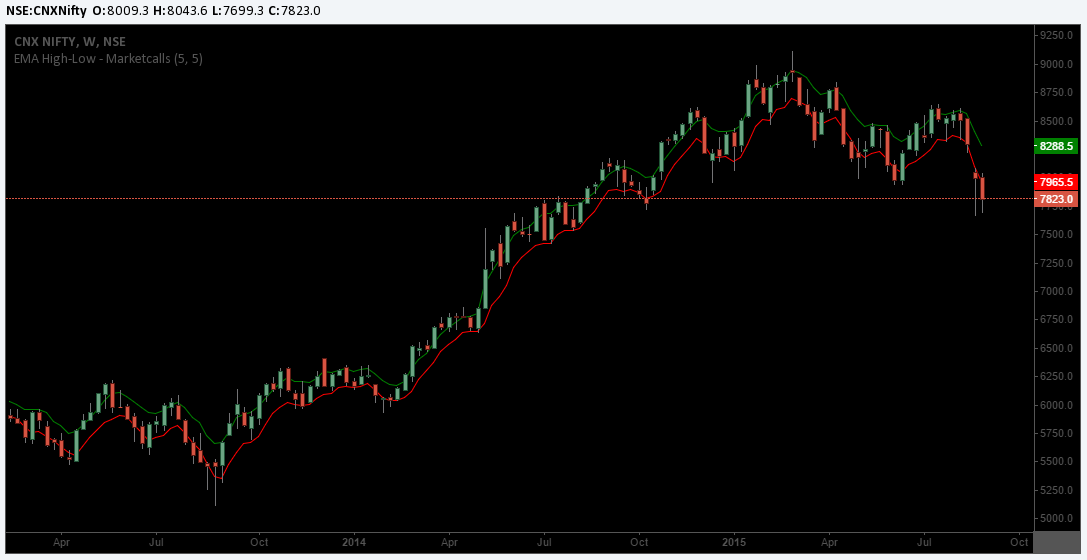
One more custom indicator added to our Interactive Live Charts and EOD Charting section. 5EMA(High-Low) simple trend following strategy that can be practiced on Hourly, EOD and Weekly timeframes to gauge the overall trend in the market.
Trading Rules
1)If the stock/Index trading above 5 EMA(High) – trend is expected to be up with support at 5 EMA(High)and next level of support comes near 5 EMA(low)
2)If the stock/Index trading in between 5 EMA(low) and 5 EMA(High) trend is expected to be rangebound between 5 EMA high and 5 EMA low with resistance at 5EMA(high) and suppport at 5 EMA (low)
3)If the stock/index trading below 5 EMA(low) then price is expected to be trend lower with resistance at 5 EMA low and next level of Resistance comes near 5 EMA(High)
How to Apply the Indicator?
1) Goto Interactive Charts (EOD or Live Charting Section)
2) Open your favorite stock/index/currency
3) Right click over the chart -> Insert Indicator
4) Search for EMA High-Low in the search box
5) Apply the Indicator
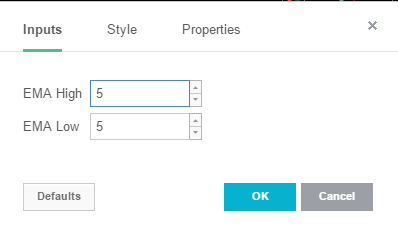
6) Provision has been provided to change the EMA value as shown below
Tradingview Pinescript Code
Amibroker Users download 5EMA High-Low Strategy Code here
Related Readings and Observations
The post 5 EMA High-Low Indicator Added to Interactive Charts appeared first on Marketcalls.