Welcome to Market Profile Series. In the last tutorial we seen How to Play 80 Percentage Rule and this tutorial we will be discussing about the profile open types and the other timeframe traders confidence. Reading the profile right from the market day open gives more confidence to a day trader towards trade conviction. The confidence level of the Other timeframe trader (Long Term or Positonal trader) can be analysed through market opening.
If you are new to market profile it is recommended to start here How to read a market profile charts
Open Drive
When the price open above/below the value area and outside yesterdays trading range and auctions(moves) one sided right from the beginning towards the opening direction. It shows the high confidence level of other timeframe traders(OTF) with strong directional commitment.
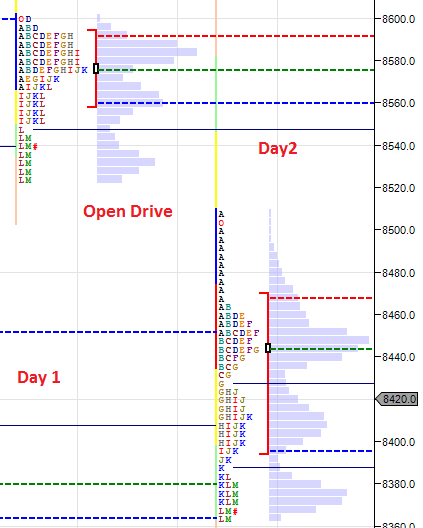
The above picture shows, price opens lower on Day 2 and below the Yesterdays Value Area and Below Yesterdays low. Market Opens Imbalance which indicates the presence of Other timeframe players and start auctioning lower and closed near to the day low. Clear Sign of other timeframe seller in control right from the market open.
Typically the low made in the first 30 min will not be breached during the intraday session.
Watch Live Market Profile Charts
Open Test Drive
When the price open above/below the value area and outside yesterdays trading range and test the key reference level(Value Area Level, POC level, Prev day high/low) on the reverse direction and auction back towards the market open direction. This type of market open type shows less confidence less than the Open Drive.

the above picture, price open high on Day 2 and above the yesterdays high value area and above yesterdays high. Market Open Imbalance but the traders reverses the price towards yesterdays POC level followed by Other Timeframe Buyers taking control and auctions higher on the upper side.
Open Rejection Reverse
Market Open Strongly higher/lower test a reference point (Resistance/Support) price rejects from there and auctions in the reverse direction.

In the above picture price opens higher and above value area but soon finds resistance at higher levels followed by price reversal towards the downside. Such kind of auction happens near the end of the bull market or end of the major trend.
Open Auction In Range
When the volatility is very low and market opens within previous value area and previous days high-low range indicates market is balancing and one can expect price rotation at this zone. Complete lack of Other timeframe traders and trading opportunity for a day trader is lower compared to other open types. In classical technical analysis the day is represented as ‘ínside day’ and price rotates around the day open. Other timeframe traders are not present till end of the market.
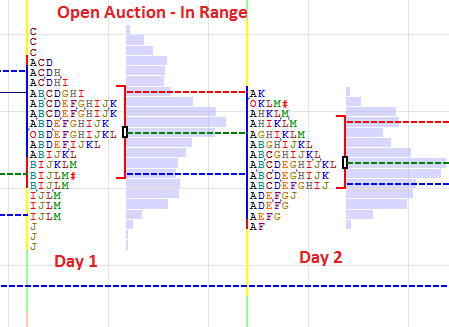
The above provide shows the open is in-between value area and inside previous high-low range. Days are boring till the market close.
Open Auction Out of Range
Price opens above or below the previous days range and auctions back and forth around that opening values. Such open lead to a conviction that the OTF buyers or sellers have stepped in and will manage to drive prices in their direction.
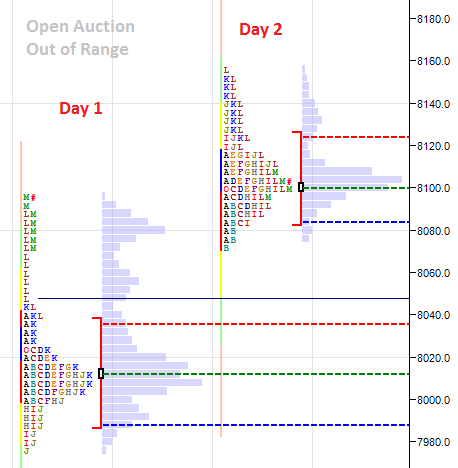
In the above example price gaps up and open higher but later the price rotates near the open most of the times. Later Other timeframe buyer entered and pushed the price higher. Open Auction generally shows low conviction on market direction by OTF buyers or Sellers compared to other open types.
In the next tutorial we will be discussing more in-depth about Value Area , POC and VPOC Concepts.
Related Readings and Observations
The post Market Profile Open Type and Confidence appeared first on Marketcalls.