Welcome to Market Profile Series. In the last tutorial, we saw the different types of markets (Balanced and Imbalanced). In this tutorial, we will be discussing about the different types of Market Profile Days. By analyzing the shape of profile, one can easily identify
- who is in control in the market.
- whether other timeframe players are present for the day.
- What the market is trying to do. Which direction market is attempting to move
- Which are the key levels market is attempting to test or re-visit
If you are new to market profile it is recommended to start here How to read a market profile charts
Non Trend Day
Non Trend day is a balanced market profile which occurs before an major economic event, news, earning result outcome to happen resulting in lack of participants and a typical dull boring day. Range (high-low) for the day is very compressed and the risk-rewarding nature for an intraday trader is very less. Market likes to auction both the sides centered to the point of control. Only scalping the market favors an intraday trader on these non trend days.
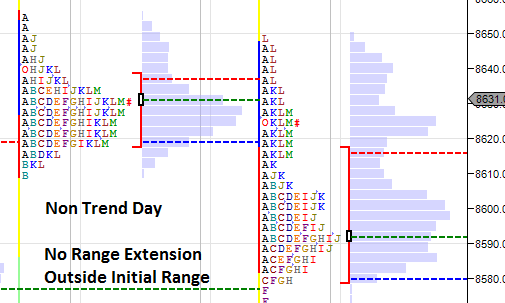
Non Trend Days are mostly inside day where the current day’s range is within the previous day’s high-low range and the price rejection (at high or low) happens near to the previous days high volume node. There is no range extension on either sides which shows lack of other timeframe traders and the price rotates within Initial Balance. Market shows very low volatility and the Initial Balance is very small.
Watch Live Market Profile Charts
Normal Day
Normal day is a balanced market profile but with a wider Initial Balance. It occurs generally when there is a news release post previous days market hours or due to global market sentiment(too negative or too positive). This action is followed by range extension on the direction of the sentiment and the long term traders or investors are responsible for the such action (driving the price outside (which can be identified with single prints) the range extension). But, due to lack of conviction among the participants, the one sided directional move comes to an end and the price reverses back to test the other side of range extension.

Price generally rotates near center of the profile and the maximum participation happens at the center of the profile with higher volumes at the POC (point of control). Single prints(Buying tails and Selling tails) on both the sides indicates lack of conviction among both the other time-frame buyers and sellers. Profile shape looks like a perfect bell curved shape.
No one is control of this market type and the risk reward ratio is higher for a day trader at the extremes. More wider the initial range, more risk-rewarding for the day trader. However, the profile is low risk rewarding for new shorter term traders or long term players (who holds the position for more than a day) as the market closing is very close to the center of the profile.
A Profile day with wider initial balance with no range extension is also considered as normal day.
Normal Variation Day
Normal Variation Day is typically an imbalanced profile and the day is dominated by large timeframe players (Buyers or Sellers). Long time-frame players are waiting for the market to settle down where they consider the price to be fair and then they take control who drives the market aggressively post 11.00a.m or 12.00p.m with the range extension outside the initial range. The range extension is more than 2 times the Initial Range And the Initial Balance is typically smaller than the normal day but higher than the trend day.
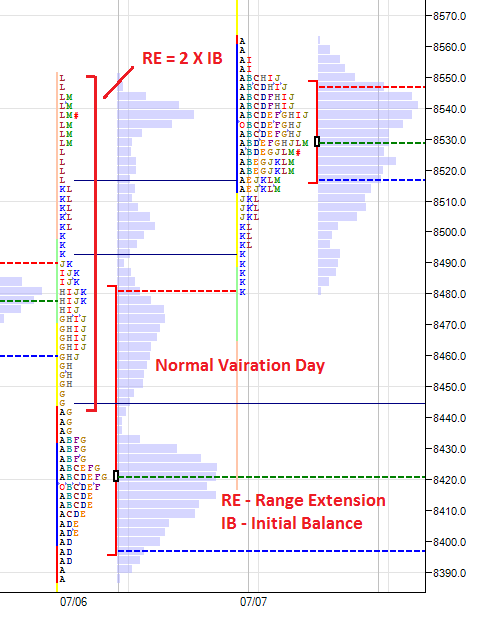
The above picture shows a typical normal variation up day where the range extension happens in the ‘G’ period and the length of range extension is 2x Initial Balance.
Trend Day
Trend day is an imbalance profile where the day is controlled by the long timeframe participants and the conviction is very strong among the long timeframe players right from the beginning of the market. A Perfect Trend Day looks like low of letter A > B > C > D in a uptrending market and the high of letter A > B > C > D in a down trending market. However price overlap in A,B,C,D may occur.

Profile shape is vertical, elongated and very few price rotation and clear sign of one sided trend right from the beginning. And the Value Area is typically very large on a trend day. Risk-Reward Ratio is typically higher for a day trader during Trend Days.
Double Distribution Day
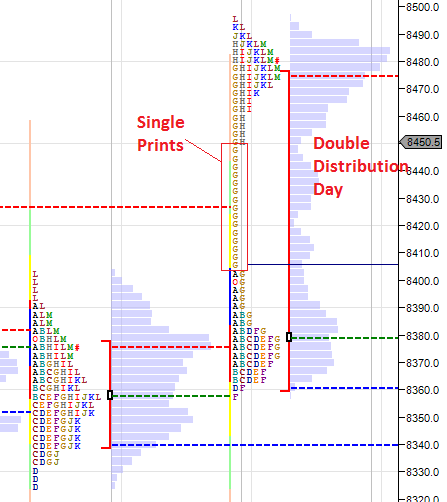
Double Distribution is an imbalance profile where Initial Balance is small and the first price rotation (1st Balance Region) happens at Initial Balance. Then, the larger timeframe traders take control and drive the price in one direction. In the later session, another price rotation happens at the other side of the edge(2nd Balance Region). Both the price rotation regions should be separated by single prints. Risk-Reward Ratio is typically higher for a day trader during Double Distribution Days.
Neutral Day
Neutral Day is a balanced profile where initial range is smaller than Normal day. Both the Other timeframe buyers and other timeframe sellers are Present. They don’t trade directly each other but the intraday trader will act like a mediator between both the larger time-frame buyer and seller.

Range Extension happens on both the sides however, it will be a failed Range extension which brings the price back into the Initial Balance range and the price rotation happens there. Range extension tails will be very minimal and such range extension confuses a trader to assume as normal day or normal variation day during the development of profile but the failed range extension pushes the price to the other side of the edge and trade back and forth. Such profile days occur generally when the VIX is higher.
If the price closes at the center, then it is called Neutral Profile Center and if the price closes at the extreme edge of the profile it is called at Neutral Day Extreme.
P Profile Shape
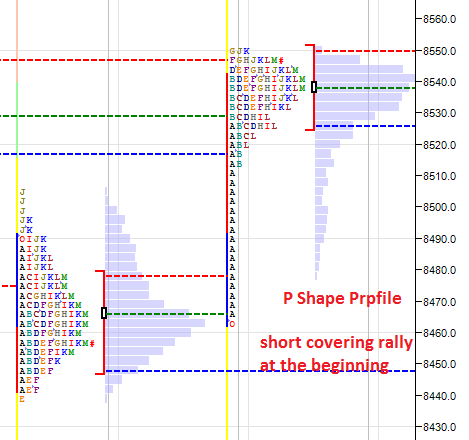
P Profile days are short covering days and the letter A or B forms the bottom with single prints in the Initial Range and market opens at the bottom of the profile. The price rotation happens at the top of the profile (i.e at the range extension area).
b Profile Shape
b Profile days are long exit days and the letter A or B forms the top with single prints in the Initial Range and market opens at the top of the profile. The price rotation happens at the bottom of the profile (i.e at the range extension area).
Risk Reward ratio
- lower in Non Trend Day, Normal Day.
- neutral in normal variation day and Neutral Day
- higher in Trend Days and Double Distribution Day
Initial Balance Range
- Non Trend Day – Narrow IB
- Normal Day – Wider IB
- Normal Variation Day – less than Normal Day IB
- Trend Day – Narrow IB
- Double Distribution Day – Narrow IB
In the next tutorial we will be discussing about the different opening types and how it gives more conviction for a day trader on trend direction.
Related Readings and Observations
The post Market Profile : Different Types of Profile Days appeared first on Marketcalls.