Monte Carlo Analysis is a process of validating the robustness of the Trading Strategy. With Monte Carlo Analysis we can simulate set of Equity curves using random numbers from the backtest data. These large sets of simulations are then used to find the likely probability distribution of an unseen risk in trading the strategy.
Monte Carlo Simulation performs trial runs using combination of positions from your trading system (backtested data) and collects statistics. You can use the statistics to analyze the characteristics of your trading systems.
AmiBroker in its recent version 5.94 beta onwards released a built-in Monte Carlo simulator which is high speed (30+ million trades per second) simulator. It uses high-quality Mersene Twister random number generator. Probably one can expect to access Monte Carlo Simulator in its upcoming major release upgrade (Amibroker Version 6.0 onwards).
Monte Carlo Settings in Amibroker

Following are the Input Parameters in Monte Carlo Settings available under backtester settings section in New Analysis
“Enable Monte Carlo Simulation” – turns on/off MC simulator
“Number of runs” – defines how many MC simulation runs is done (default value is 1000)
“Position sizing” – defines position sizing used by Monte Carlo simulator.
“Enable MC Equity Curves” – Enable MC (Min/Max/Avg) Equity Curves CDF Charts statistics
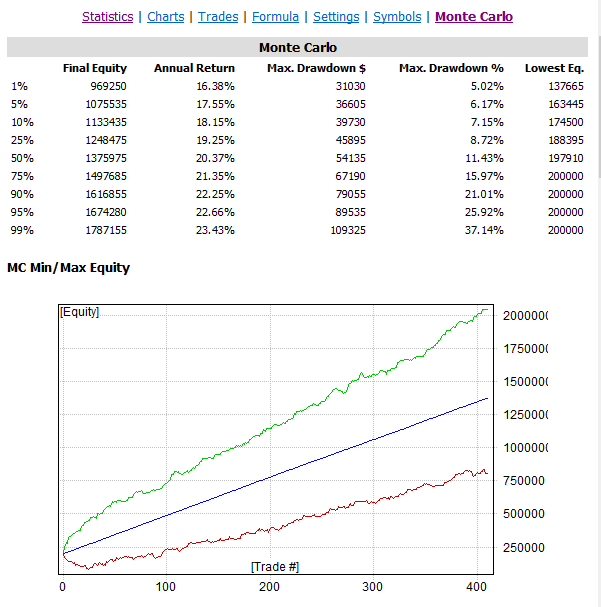
In Amibroker Monte Carlo Analysis is readily available in the backtest report once the backtest is done. The output statistics is set of CDF Charts (Cumulative Distribution Function Charts). MC Min/Max Equity, MC Final Equity, MC CAR, MC Max Drawdown $ and %, Lowest Equity are the output statistics from Monte Carlo Analysis. And one can access these reports from the Backtesting report from Amibroker v5.96 beta onwards.
MC Final Equity CDF Charts

Above chart shows the terminal equity level percentile. You can find out for a specific equity level, the percentile of trials that are above/below the level. Terminal equity level is the final equity value after a trial is run.
Above MC Final Equity is the cumulative result of 1000 simulated runs with a sample strategy. From the CDF charts 30% of the trial runs generated equity retuns between 7,50,000 and 12,50,000 returns. And rest of the 70% of the trail runs are able to generate more than 12,50,000 profits with a Initial Capital of 2,00,000. Every time you do backtest you will get different output statistics due to random generation of Equity Curve.
Sample Backtest Report with Monte Carlo Analysis
To enable Monte Carlo simulation in each backtest of optimization process and each individual backtest at code level one can
SetOption( “MCEnable”, 2 ); // value == 2 forces MC to be enabled everywhere (in every mode including optimization).
the old option:
SetOption(“MCEnable”, 1 ); // value == 1 enables MC only in portfolio backtests (default)
Monte Carlo will help you in understand the robustness of the trading system and idenifty the problem with the trading strategy but Monte Carlo analysis will not solve the problem in your trading system. To put it in simple words it is just a validation process. To create a better trading system the trader should adapt better trading design principles to improve his/her trading system performance.
If you are using lower version of Amibroker still one can perform Monte Carlo analysis using Amibroker alongwith Ms Excel which we will be discussing in the upcoming articles.
Related Readings and Observations
The post Monte Carlo Analysis using Amibroker appeared first on Marketcalls.