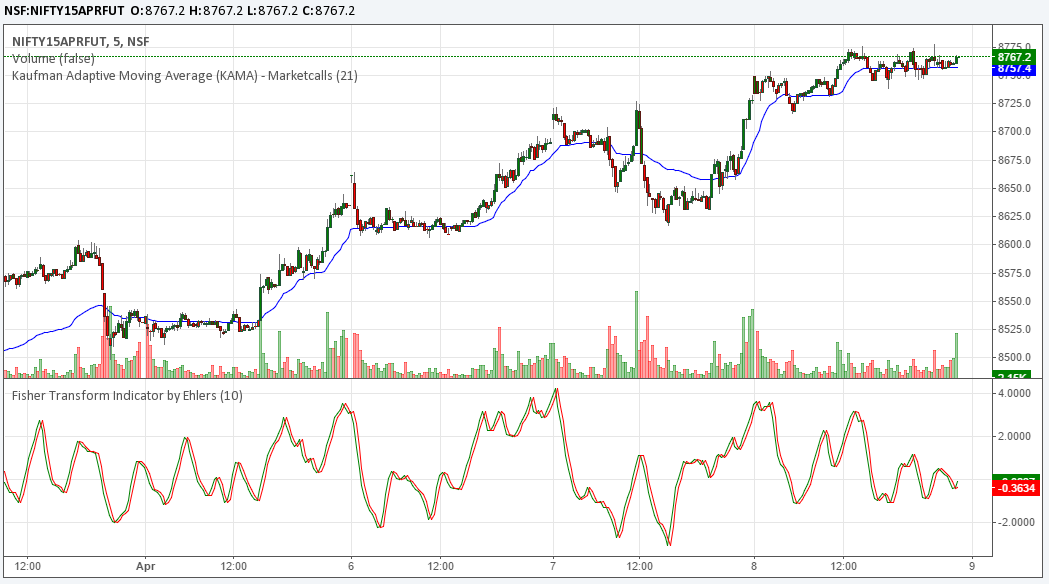
Two New Indicators Kaufman Adaptive Moving Aveage – KAMA and Fisher Transform Indicator by Ehlers are added in our Interactive charting section. Now users can make use of these indicators in NSE FNO 5min charts and NSE Cash and Futures EOD charting section
Kaufman Adaptive Moving Average
Kaufman Adaptive Moving Average (KAMA) was created by Perry Kaufman. Wikipedia says Perry J. Kaufman is an systematic trader, index developer, and quantitative financial theorist. He is considered a leading expert in the development of fully algorithmic trading programs.
Generally Moving averages are one of the most favourite trading tools for the traders. As other indicators moving average also has its own advantages and setbacks.
Pros and cons of moving averages:
Simple moving average:
In moving averages, by averaging the data for a stated number of days,one can derive a sort of automated trendline which highlights the trend. While smoothing the data, trader always gives back a part of profit as moving averages lag behind the market action.
Weighted moving average or Exponential moving average:
To overcome the setback in simple moving average, weighted moving average compared to SMA tracks the price very closely by assigning high weightage to the recent data. The formula to calculate an exponential moving average is:
EMA = (W * Close) + ((1-W) * EM)
Where,
- W is the smoothing constant calculated as
2 / (N + 1)
- which remains constant
- EM is the exponential moving average from yesterday
Eventhough EMA overcomes the lag resulted in Simple Moving Average,it failed to reduce the losing trades.
Adaptive Moving Average:
Perry Kaufman introduced the Adaptive Moving Average which compared the price direction with the level of volatility.The name “Adaptive” reveals that AMA automatically adapts to the market volatility.AMA traverse between fast and slow moving average.
If a market is advancing with very small countertrend moves, the degree of noise is low and enough if one follows a shorter look back period.However, if the market is moving sideways, the degree of noise is high and one should look for a longer look back period. So AMA is designed likewise , to move slower in a sideways market and faster in a trending market.
In AMA, Kaufman replaced the “weight” variable with a factor “Efficiency Ratio” ,which can be calculated as follows:
ER = (total price change for period) / (sum of absolute price changes for each bar)
Principle behind ER: An ER of +1.0 indicates that the stock is in a perfect uptrend; -1.0 represents a perfect downtrend. In practical terms, the extremes are rarely reached.
AMA can be calculated as follows:
1. Calculation of weight factor
C = [(ER * (SCF – SCS)) + SCS]2
Where,
- SCF is the exponential constant for the fastest EMA allowable (usually 2)
- SCS is the exponential constant for the slowest EMA allowable (often 30)
- ER is the efficiency ratio that was noted above
- C is the weight factor which is adaptive
SCS can be calculated as 2 / (SA + 1)
Where, SA – trader’s choice of a slow moving average > FA
SCF can be calculated as 2 / (FA + 1)
Where, FA – choice of a slow moving average < SA
2. Replacing the weight factor in Exponential Moving Average formula
After finding the C value, W in EMA formula should be replaced with C like,
AMA = (C * Close) + ((1-C) * EM)
Where,
- C is the smoothing constant calculated by applying Efficiency ratio
- EM is the exponential moving average from yesterday
Simple understanding of AMA:

In the above chart,when price moves sideways Adaptive Moving Average(in blue) maintained a flattened line whereas, the Exponential Moving Average(in pale green) moved with the choppiness of prices.
Conclusion:
The adaptive moving average’s strength is its ability to respond to changing market conditions, which is a problem for studies that use fixed look-back periods.
Using a fixed look-back period is not possible. Because the market is always changing, static approaches are likely to have limited success. Using adaptive study which is dynamic is a potential way to get good results. The AMA could also be combined with other indicators to develop a profitable trading system.
Amibroker Users Download the AFL Code for Kaufman Adaptive Moving Average here
Fisher Transform
General assumption in share market is, market price follows the Gaussian Normal Distribution forming a bell shaped curve.In practice, the price movements not only follows Gaussian distribution but also other probability distribution functions. At this point,a indicator is necessary to transform such values to Gaussian normal distribution to identify trend reversals.
Fisher Tansform is the one ,which transforms any probability distribution function to Gaussian normal distribution
Assumption: underlying prices follows square wave distribution
Implementation:
The fisher transform formula is as follows:

Where x is the correlation coefficient.
How transformation is made
1. Prices should be constrained to remain within the limits of -1 to +1.
2. Comes the real transformation using fisher transform formula
Result:
As Gaussian normal distribution function most of the values are highly concentrated around the mean, while the extremes are observed to be concentrated at the right and left tails of the bell shaped curve. So transformed time series helps to identify trends,i.e sharp turning points in price movements
How to Apply the Indicator
In this indicator along with fisher line,fisher delay(one previous fisher bar) is also added.Signals are identified when fisher line crosses above or below its signal line.
Bullish signal – Fisher line turns up below -1 threshold & crosses up the fisher delay line
Bearish signal -Fisher line turns down above +1 threshold & crosses down the fisher delay line
Its shown in the below chart

Amibroker Users can Download the Fisher Transform Amibroker AFL code here
Conclusion:
The Fisher Transformation transforms the probability density function of any waveform into a Gaussian-like probability density function. Unlike other indicators & oscillators, the Fisher Transformation introduces no lag and provides the turning points in advance. It is an excellent tool to improve our trading systems.
Related Readings and Observations
The post New Custom Indicators in Interactive Charts Section appeared first on Marketcalls.