Whenever we are coming up with a Trading solution for retail traders we make sure that the solution is interesting , meaningful and interactive as much as possible. And this time we want to do one step better in providing interactive charting functionality to our beloved readers to use the edge in the market at the fullest extent.
And this time we planned to do with NSE EOD, NSE FNO EOD, NSE FNO 5min, MCX FNO 5min charting (data updates every 5min) using tradingview library. However at the Beta stage would like to keep only NSE and BSE EOD data (80% of symbols covered in Beta) for beta testing. And you can access the Interactive Charts here and soon it will extend to NSE EOD, BSE EOD, NSE FNO EOD and NSE FNO 5min, MCX FNO 5min.
We are not great professional coders but love to do awesome stuff here. So things might take time to evolve and we love to iterate our solution as frequent as possible to match actual traders requirements. Whenever we build something we make sure that we keep things open right from the beginning to get qualitative feedback from our readers. All we want from your side is constant inputs and suggestions.
Key Features
1)Access Anywhere , Any device – Mobile and Tablet Friendly
2)Comes with PreBuilt Classical Technical Indicators and the ability to add custom indicators using PineScript. Pine Script is a vector language created by tradingview and quite similar to Amibroker AFL or Easy language.
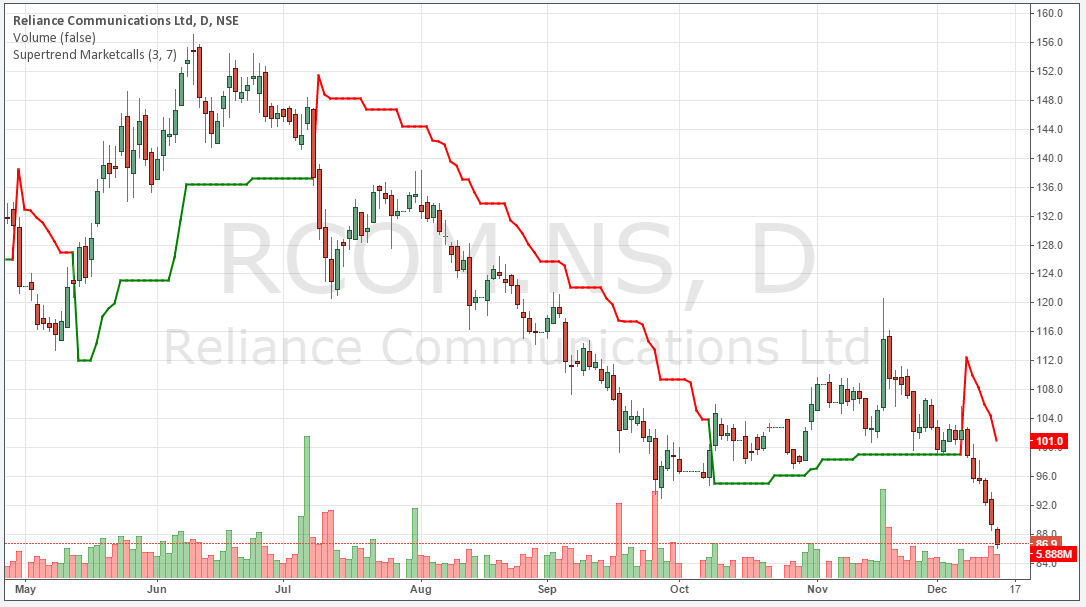
3)Currently Added Supertrend Indicator (Custom indicator). But soon more and more custom indicators will be added. If you are good in creating your own PineScript at Tradingview. Provide us the Pine Script we will enable the custom indicator for you. Moreover Tradingview is filled with tons of PineScipt at the Public Library.
4)Supports Charting types like Candlestick, OHLC Bars, Hollow Candles, Line Charts, Area and Heinkin Ashi Charts.
5)Ability to take screenshots, save indicator Templates and share the snapshot in twitter automatically.
6)Interactive Drawing Tools like Gartely Patterns, Elliot Waves, Fibonacci Tools, Gann Tools, Trend Lines, Regression lines and lots of tools to draw over the chart.
How to provide feedback?
You can always use Marketcalls Community to provide your qualitative feedback or write a mail to rajandran@marketcalls.in to improve ourself.
Related Readings and Observations
The post Interactive Web Charts – Open Beta appeared first on Marketcalls.