Here is simple visualization to look into the past five trades result and plot the values over the chart which gives a quick view on how the strategy performed in the last five trades. In this AFL example we had created the dashboard for simple MACD crossover. And the dashboard doesnt include current open positions and only include last five closed positions.
Nifty Futures Daily Charts
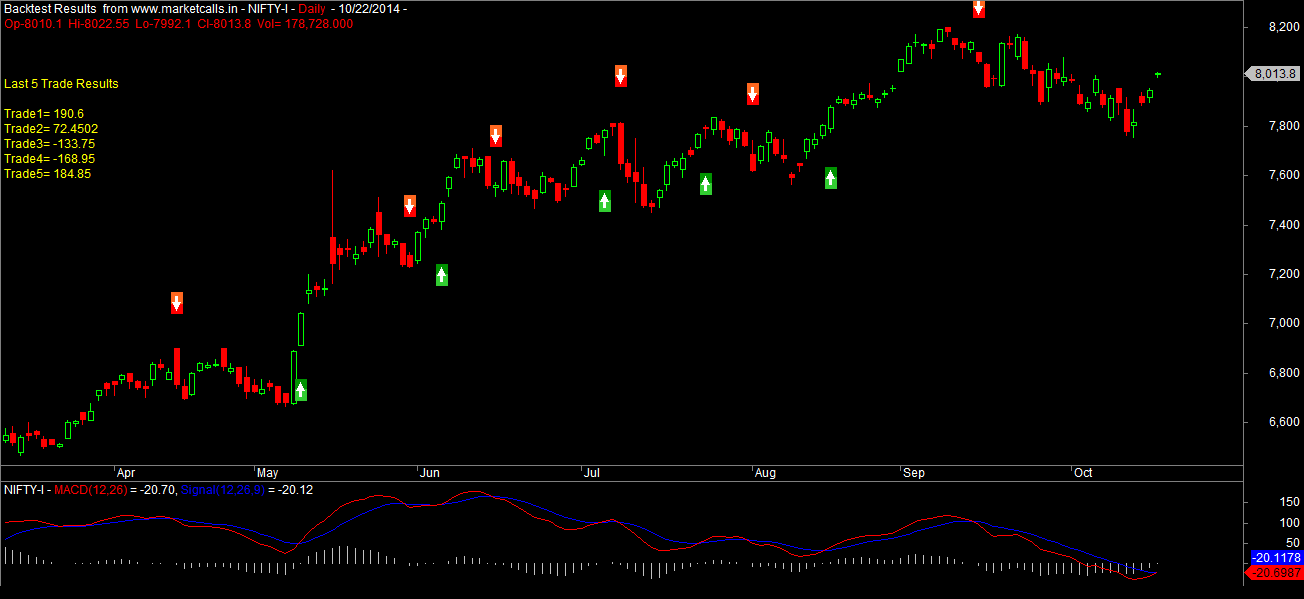
Here we are using equity function to generate realtime backtesting equity curve and from there we used BarIndex() feature to track back the Last Five trades Profit/Loss Results
To create your own Last Five Results Dashboard over your trading system you have to replace the sample MACD Buy/Sell/Cover/Short rules with your trading rules.
Download Last Five Trades Result Dashboard for Amibroker
Note :
1)PositonSize is set to 1 shares to get the exact profit/loss points
2)This AFL doesnt includes Slippages/Commissions and displays pure signal to signal profit/loss points
3)However you can include Slippages/Commissions in the Initial Values Section
4)Dont click on the chart this will create a vertical lines over the candlestick which will distort the values of dashboard
5)If you see such vertical lines or mistakenly clicked over the candlestick then double click over the vertical lines to remove it from the chart.
Related Readings and Observations
The post Last Five Trades Result Dashboard – AFL code appeared first on Marketcalls.