Here is a simple AFL code snippet to plot One Previous Day High Low and currently day One hourly high low (i.e high between 9:15a.m – 10:15a.m as per NSE timings)
Previous Day High Low AFL code
To compute Previous days high-low values we need to use TimeFrameGetPrice function as shown below. TimeFrameGetPrice basically retrive the O,H,L,C values from other timeframes and in this case it is Daily timeframe and the same values are plotted in lower timeframes.
DayH = TimeFrameGetPrice(“H”, inDaily, -1);
DayL = TimeFrameGetPrice(“L”, inDaily, -1);
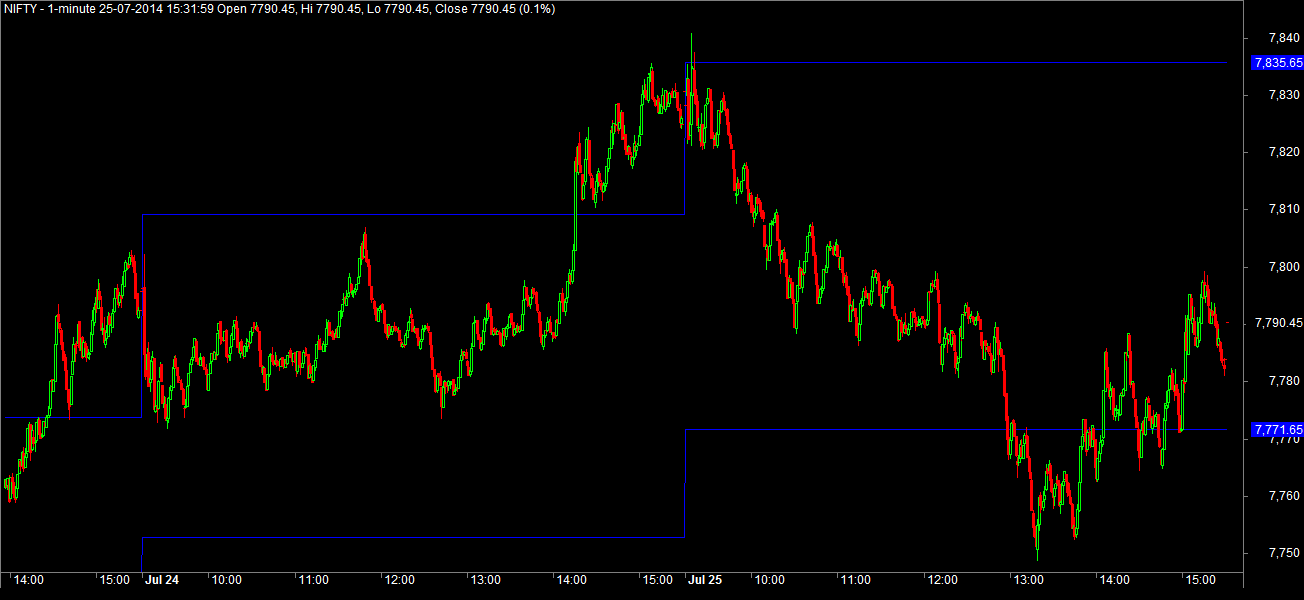
Nifty Spot showing Previous day High-Low
Download Previous day High Low Amibroker AFL code
Current day’s One Hour High-Low
To get Current days’ first one hour high and low we need to use timebased functions like timenum() and finally ORBH and ORBL captures the first one hour high and low. And you can change the timings mentioned below the suit your exhchange and your requirements.
OST=091500; //Observation Start Time
OET=101500; //Observation End TimeCurrtime =TimeNum(); //get current time
ob_end = Cross(TimeNum(),OET); //detect the observation end time
ob_st = Cross(TimeNum(),OST); //detect the observation start timeHighest_since = HighestSince(ob_st,H,1); //capture the 1 hour high
Lowest_since = LowestSince(ob_st,L,1); //capture the 1 hour lowORBH = ValueWhen(ob_end ,Highest_since,1); //
ORBL = ValueWhen(ob_end ,Lowest_since,1);Plot(ORBH,””,colorGreen,styleDots);
Plot(ORBL,””,colorBlue,styleDots);
Nifty Spot showing Current Day’s One Hour High-Low

Download One hour high low Amibroker AFL code
Related Readings and Observations
The post Code Snippet : One Hour High-Low and Previous Day High Low appeared first on Marketcalls.