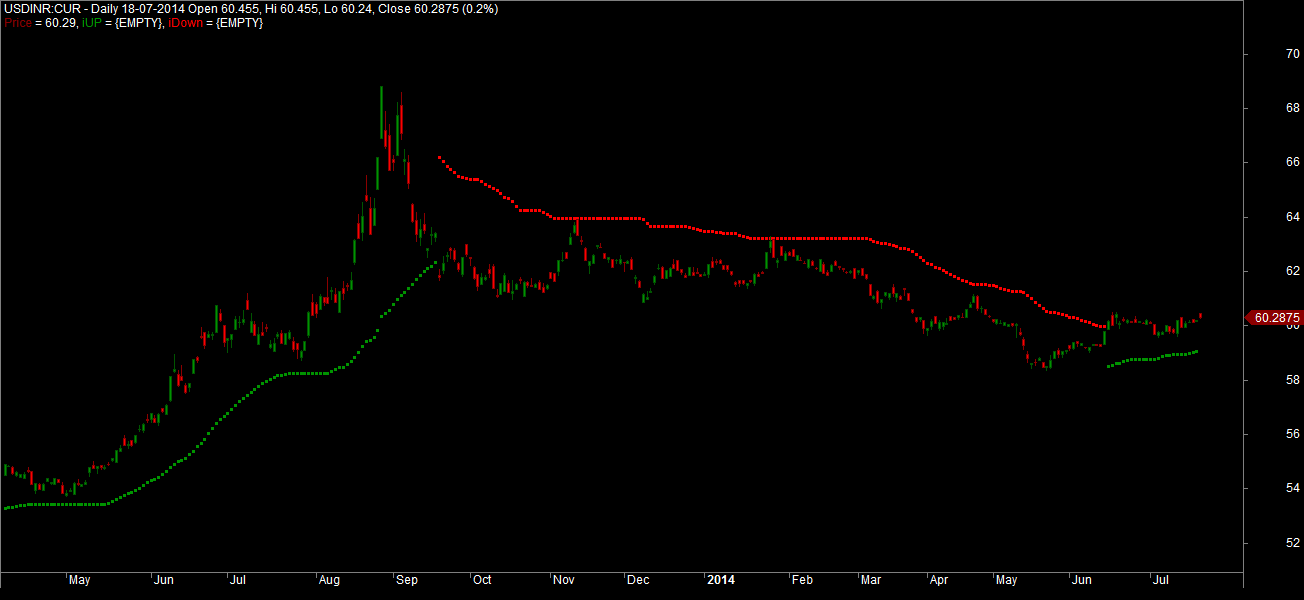
USDINR Weekly Spot Charts
![USDINR Long Term Update]()
USDINR on the daily charts very recently turned to long term buy mode since 16th June 2014. Currently the EOD support comes near to 59.06. USDINR will turn to long term sell mode if the support levels breaks on the weekly charts.
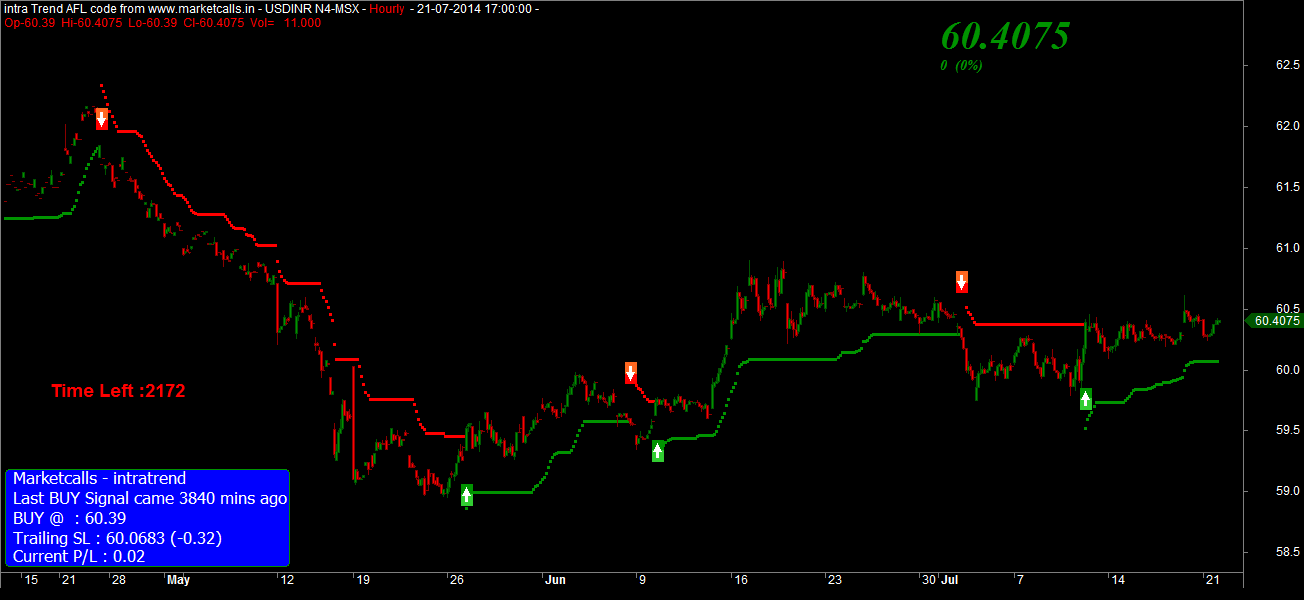
USDINR MCX-SX July Futures Hourly Charts
![USDINR Short term Update]()
USDINR July Futures on the hourly charts is in positional buy mode and currently the hourly support zone comes near 60.06. Reverse your position to shorts if the support zone breaks on the hourly charts.
Related Readings and Observations
- USDINR Long Term and Short term Overview USDINR on the daily charts is in long term sell mode since Sep 2013. Currently the EOD resistance comes near to 60.49. USDINR will turn to long term buy mode if the resistance levels […]
- USDINR Hourly Future Charts March Overview – I The recent strengthening of the USDINR currency is due to the continuous buying of FII's for the past 15 days into India Equity Market. Interestingly FII's are the net buyers for the past […]
- USDINR Long term Charts Overview USDINR daily charts are shown with Intratrend indicator. Currently charts are in sell mode since September 2013 and the long term resistance zone comes near 63.19. Breaking this 63.19 on […]
- USDINR trend analysis using Andrew Pitchfork USDINR trend turns up on weekly basis. USDINR close above WHEMA. Next trend line hurdle near 55.30. Close above that TL breakout possible. RSI breakout gives early indication.
The post USDINR Long Term and Short Term : July Month Overview appeared first on Marketcalls.
![]()