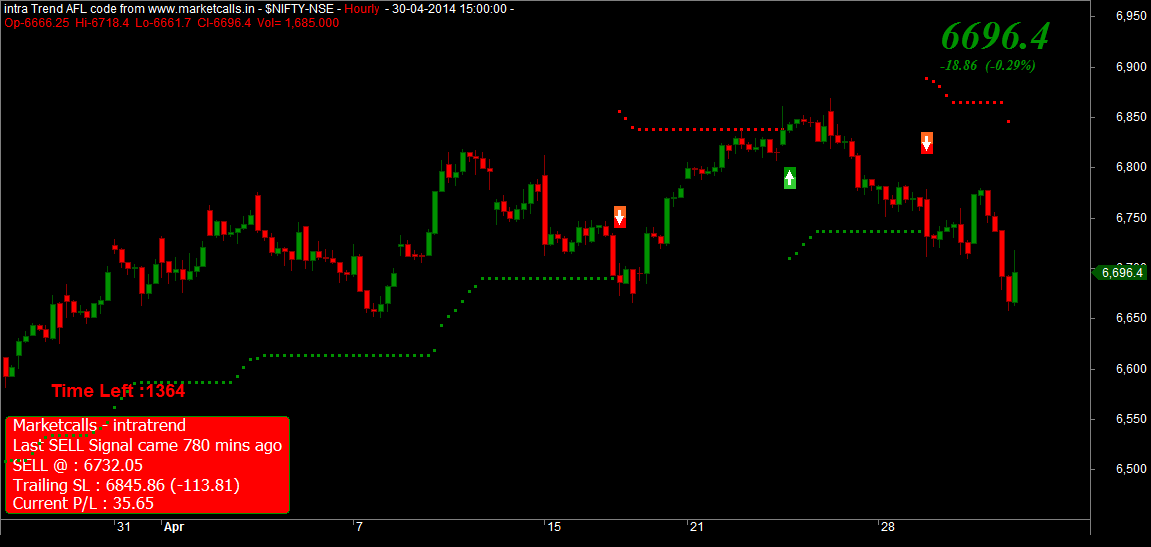
Nifty Hourly Charts
![Nifty]()
Nifty hourly charts is in positional sell mode since 28th April and currently the resistance zone come near 6845. However Banknifty on the hourly charts still manage the positional buy mode and currently the support zone comes near 12790 and trades very close to the support zone. Reverse your trading positions if the support/resistance zone breaks on the hourly charts.
Bank Nifty Hourly Charts
![Banknifty]()
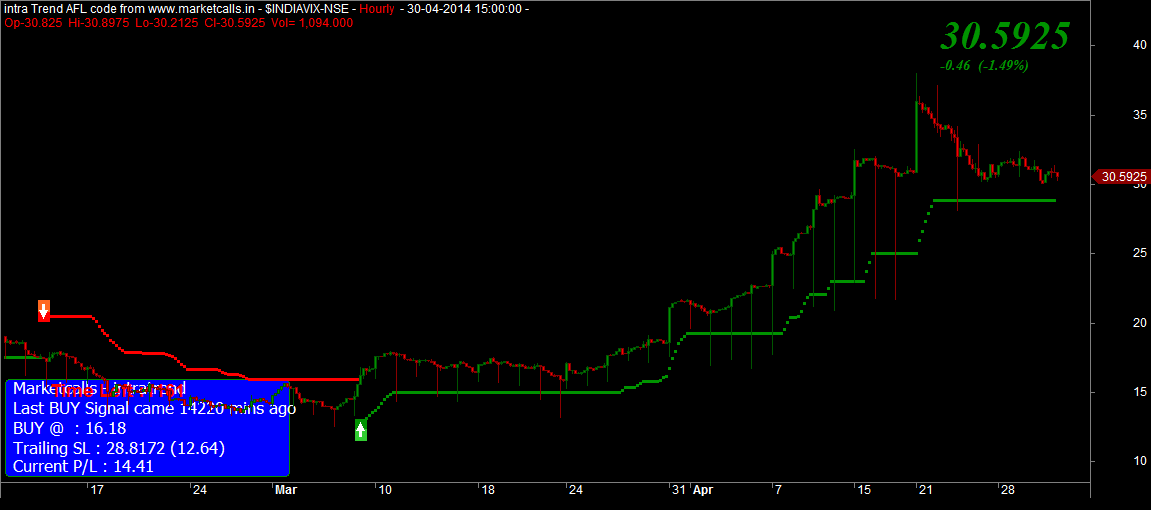
India VIX Hourly Charts
India VIX still trades just above 30 levels and supports currently coming near to 28.81 VIX trend could turn down if the support zone breaks on the hourly charts.
![India VIX]()
Related Readings and Observations
- India VIX the short term Multibagger On 6th March India VIX volatility index achieves the all time low of 12.5 since then within a short span of time scales to above 30 due to the upcoming election results which creates too much of ex...
- Nifty and Banknifty Hourly Charts and Open Interest Lookup Nifty and Banknifty is in positional buy mode since 22nd April and currently the support zone comes around 6736 and 12820 respectively. Reverse your position to positional shorts if the support zon...
- Nearing Elections and Raising India VIX As elections are nearing the volatility in the past days keep raising constantly and Currently VIX Index is around around 29, During last 2009 Elections it rose to over 50 by mid-April and averaged...
- Nifty and Bank Nifty November Futures Overview – III Nifty and Bank Nifty November futures hourly charts are in sell mode since 6th November.Currently resistance zone is at 6137 and 10931 respectively. One should reverse your position to positional b...
The post Nifty and Bank Nifty Hourly Charts Overview appeared first on Marketcalls.
![]()