Triple Momentum Strategy is from Gerald Appel, introduced in his 2005 book, “Technical Analysis: Power Tools for Active Investors.” It’s included on pages 58-63 of his book. That section is headed, “The Triple Momentum Nasdaq Index Trading Model.” Gerald Appel, is also probably best known for his creation – Moving Average Convergence Divergence (MACD).
Mr. Appel’s Says, “There is only one buy rule and only one sell rule: You buy when the Triple Momentum Level, the sum of the 5-, 15-, and 25-day rates of change, crosses from below to above 4%. You sell when the Triple Momentum Level, the sum of the 5-, 15-, and 25-day rates of change, crosses from above to below 4%.“
Here is a slightly modified Triple Momentum Strategy which works good with Equities and Commodities for Positional Trading and one can consider this as a low risk strategy.
“There is only one buy rule and only one exit rule: You buy when the Triple Momentum Level, the sum of the 5-, 15-, and 25-day rates of change, crosses from below to above 4%. You Exit Longs when the Triple Momentum Level, the sum of the 5-, 15-, and 25-day rates of change, crosses from above to below 0%.“
Nifty Hourly Charts
Image may be NSFW.
Clik here to view.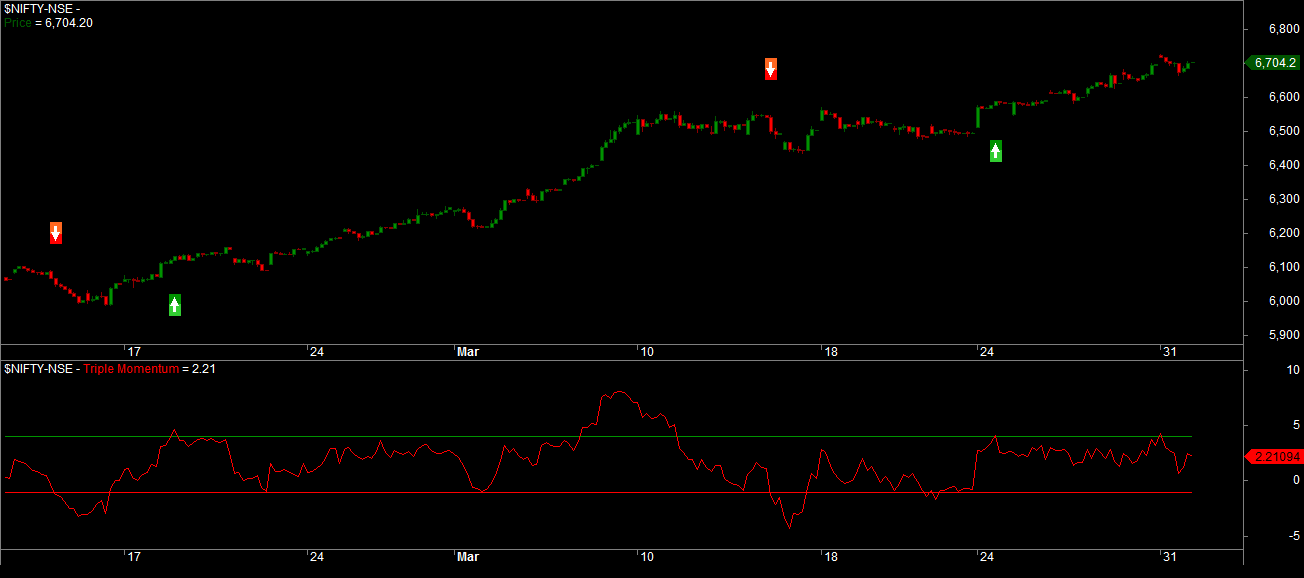
Steps to Install the Indicator
1)Download Triple Momentum Timing Model
2)Unzip the files Triple Momentum Timing Model.afl and Triple Momentum Indicator.afl to //amibroker//formulas//system// folder
3)Apply both the indicators to the New Blank charts
Backtesting with Nifty hourly Charts
Backtested the strategy on the Nifty Hourly Charts(Spot) since June 2009 with 2lots of Nifty and Rs100 per leg as a brokerage (i.e Rs200 per buy and sell transaction). Here are the results
Image may be NSFW.
Clik here to view.
Equity Curve
Image may be NSFW.
Clik here to view.
Profit Table
Image may be NSFW.
Clik here to view.
Underwater Equity
Image may be NSFW.
Clik here to view.
Recent Momentum Signals from Nifty50 pack
Sunpharma and TCS(Cash market) turned to Buy mode as the Triple momentum indicator crossed above the 4 level. One can hold the stock until the indicator hold above Zero. Cover your longs if the momentum enters the negative zone.
Sunpharma Hourly Charts
Image may be NSFW.
Clik here to view.
TCS Hourly Charts
Image may be NSFW.
Clik here to view.
Related Readings and Observations
The post Modified Triple Momentum Strategy – Amibroker AFL code appeared first on Marketcalls.
Image may be NSFW.Clik here to view.