S&P500 Hourly Charts
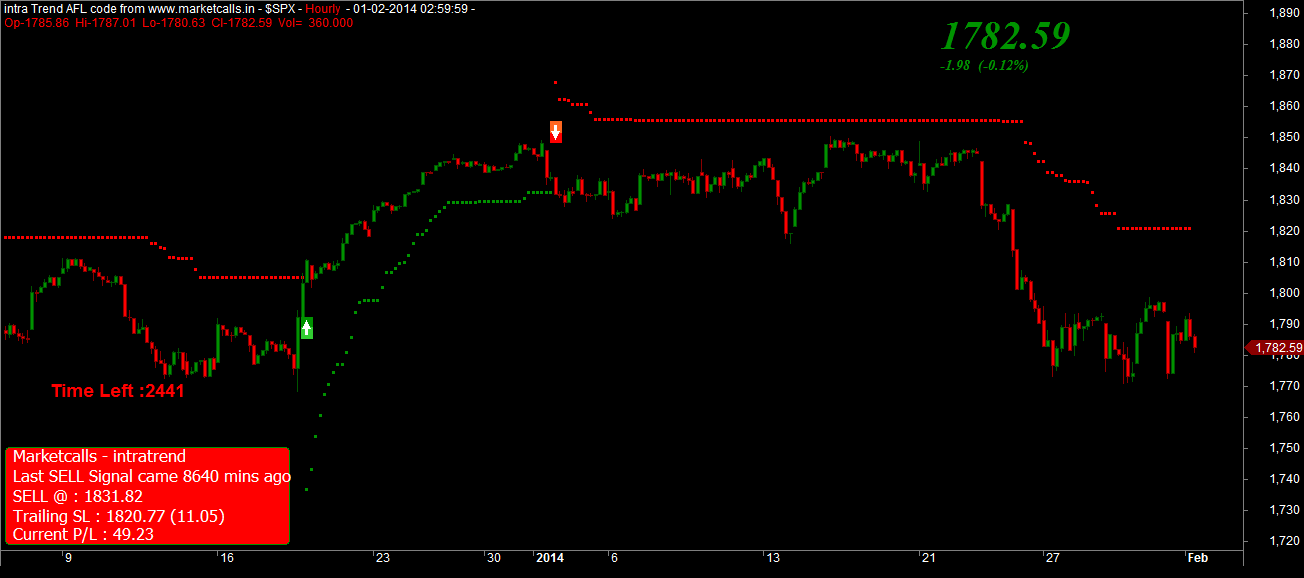
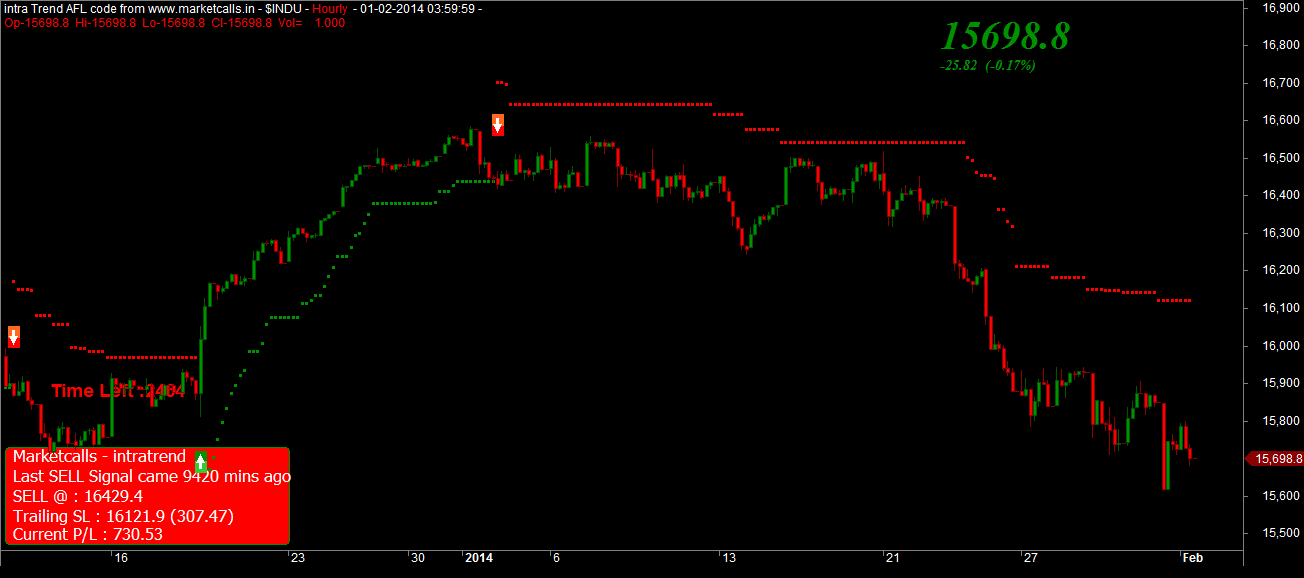
Currently Both the US Indices S&P500 and Dow Jones are in positional sell mode for a long time since 2nd Jan 2014. Currently the resistance zone coming around 1820 and 16121 respectively. Position will be reversed to positional buy mode if the resistance zone breaks on the hourly charts.
Dow Jones Hourly Charts
Related Readings and Observations
The post S&P500 and Dow Jones Hourly Charts February Overview – I appeared first on Marketcalls.