![Nifty Jan]()
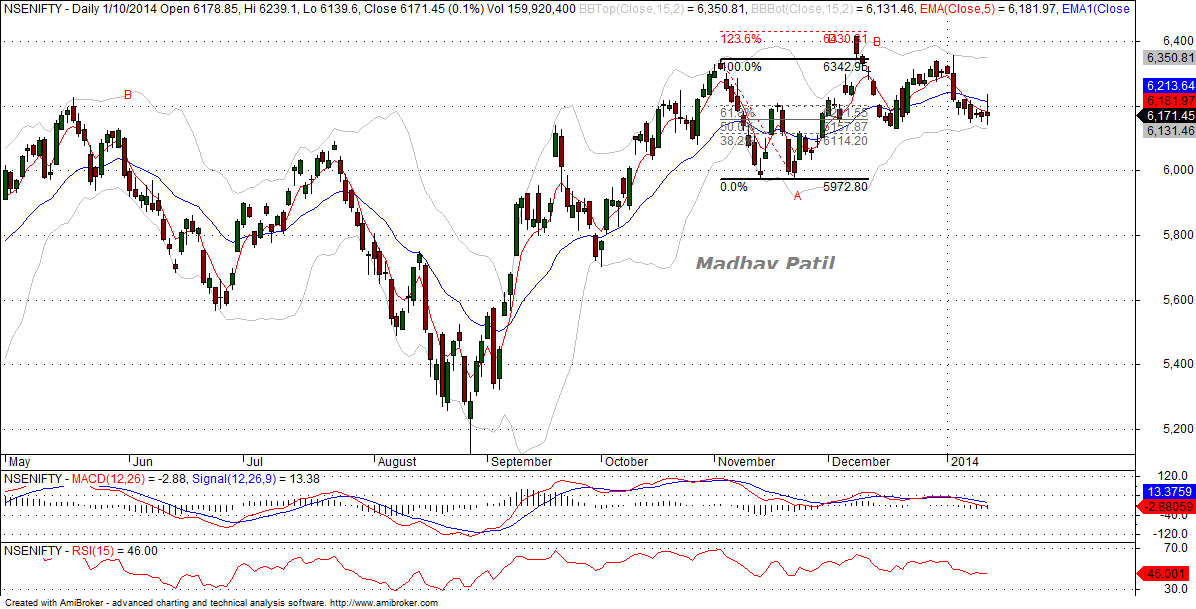
As we can see in the daily chart,If we label 6342 (3 Nov 2013) to 5972 ( 22 Nov 2013) as wave A, gradually wave has to be labeled at 6415 (9 Dec 2013). The C wave has been confirmed when Nifty breached the 38.2% of wave B. Here Nifty have formed ‘ Flat ‘ where B wave is larger than A wave but fails to exceed above 123.6% of wave A.
Now considering these conditions, Nifty have relatively good chance of completely retracing the B wave 5972 but wont be more the 161.8% of wave A ie 5819 level but if it exceeds beyond then it will be considered as ‘Elongated Flat’ which will certainly exceed 161.8% of wave B ie 5698.
However, These readings will be negated if Nifty moves above 5415.
Thanks N Reagards
Madhav Patil
Related Readings and Observations
- Medium Term View Of Indian Equity Markets The Nifty is presently in minor wave 5 of Intermediate wave (1) of Primary wave (I) of a new cycle which started in March 2009. It completed minor wave 1 at 4693 in June 2009, followed by the co...
- Nifty and Bank Nifty November Futures Overview – III Nifty and Bank Nifty November futures hourly charts are in sell mode since 6th November.Currently resistance zone is at 6137 and 10931 respectively. One should reverse your position to positional b...
- Nifty and Bank Nifty Futures Overview – IV On the Nifty spot weekly intratrend charts nifty turned to fresh long term buy mode after three consecutive failures in weekly charts which is a high probability setup for mother of all bull rallies.
- Nifty and Bank Nifty October Futures Overview – III Nifty and Bank Nifty maintains the positional buy mode on the hourly charts. Currently the support zone comes near 5953 and 10097. Reverse your position to sell mode if the support zone breaks on t...
The post Nifty – Probable Flat Formation appeared first on Marketcalls.
![]()