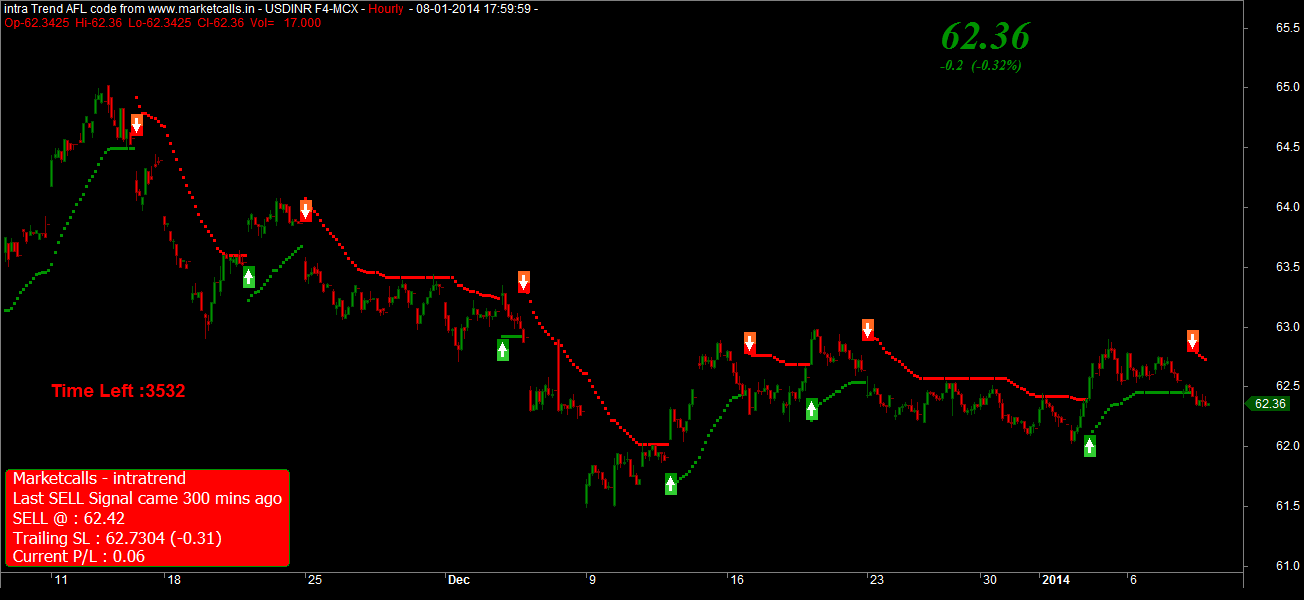
USDINR Futures Hourly Charts
USDINR January Futures turned to sell mode on the hourly charts and currently the resistance zone comes around 62.73. Reverse your position to positional buy mode if the resistance zone breaks on the hourly charts.
Along with equities, debt markets too have started to witness FIIs inflows from December 2013 which may result in strengthening INR in near term. Domestic stocks will be watched for cues on foreign fund flows.
Related Readings and Observations
The post USDINR January Futures Technical Analysis Overview – I appeared first on Marketcalls.