![Nifty Daily Profile Charts]()
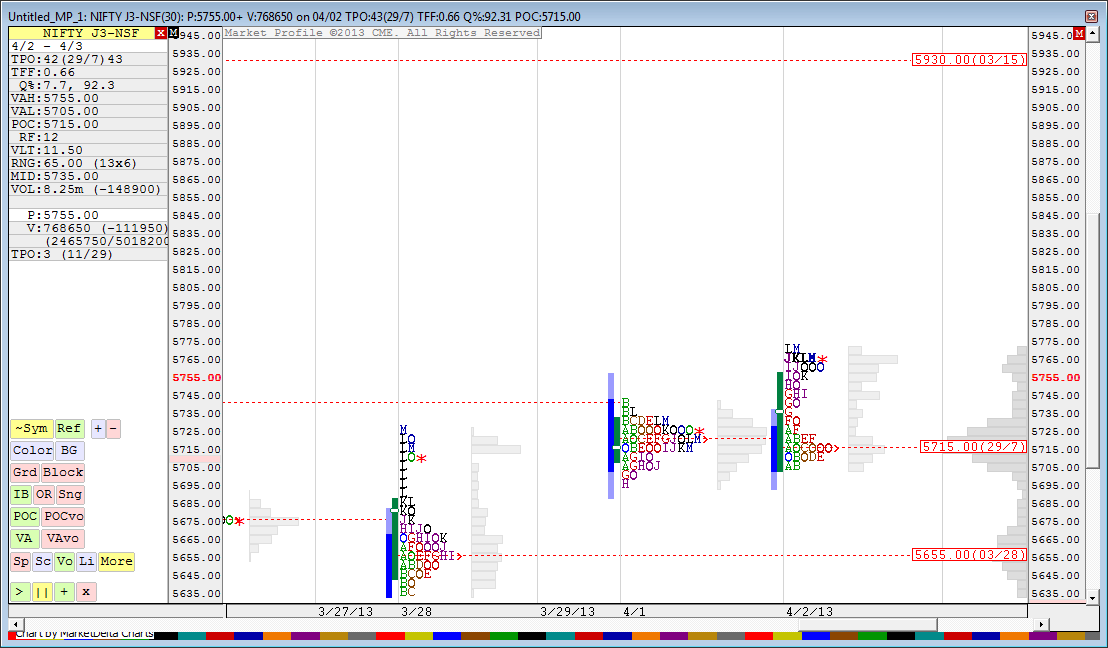
Nifty April Futures Daily Profile Charts are shown. Yesterday nifty had formed a double distribution Trend Day pattern. A double distribution trend day occurs when trading is light during the day followed by a sudden expansion of the initial balance by the longer term market participants later in the session. This one-time activity usually occurs into the afternoon session. This sudden change can be caused through fundamentals, news, economic reports, or just plain supply or demand.
Value are High(VAH) at 5755 and Value area low(VAL) at 5705 and the Point of Control (POC) at 5715
Related Readings and Observations
- Trend Day in Nifty Daily Market Profile Charts
A trend day occurs when there is a high level of cofidence expressed throughout the day. Larger time frame market participants must be active in order for any trend day to occur. The above Nifty Chart... - Nifty : Weekly and Daily Profile charts
Nifty opened above Value Areas which itself was bullish sign and the new values were created outside of the previous day’s value. Now for Tuesday an open over 5619 will be Bullish, but if 5619 is brea... - Nifty Futures 500 Tick Charts and Monthly Profile Update
Nifty April futures 500 Tick Charts turns to positional buy mode on 28th March 2013. Trailing Stoploss zone come near 5700 and CMP : 5714.The monthly Market Profile on Nifty spot charts shows that the... - SMV Trading System v1.0 – AFL code for Amibroker
SMV Trading system V1.0 - An Intraday Trading Approach with Combination of SDA2 Trend Trading System + Market Profile + Volume Profile (SMV Trading System v1.0)...
The post Nifty Market Profile Charts for 3rd April 2013 Trading appeared first on Marketcalls.
![]()